


For my last few toots I have been mostly using #ukpolicycharts to show how inequality has increased over the last 14 years and more. It has become a runaway train. It is cementing itself across generations, and internationally. I'm not sure if either of the two main parties have policies to […]
Original post on mstdn.social
mstdn.social
July 4, 2024 at 8:13 PM
For my last few toots I have been mostly using #ukpolicycharts to show how inequality has increased over the last 14 years and more. It has become a runaway train. It is cementing itself across generations, and internationally. I'm not sure if either of the two main parties have policies to […]
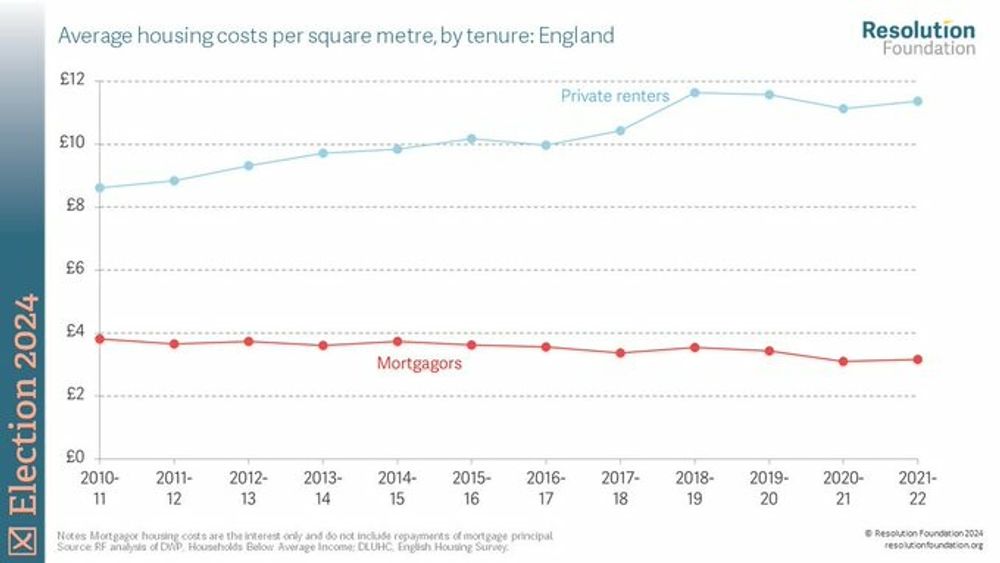
🧵 This Resolution Foundation graph comparing housing costs for renters and owner-occupiers again shows growing inequality under the ConDem and Conservative governments of the last 15 years. TBF it was widening under New Labour before that, too. This is important for many reasons 1/3 #ukpolicycharts
June 30, 2024 at 9:43 AM
🧵 This Resolution Foundation graph comparing housing costs for renters and owner-occupiers again shows growing inequality under the ConDem and Conservative governments of the last 15 years. TBF it was widening under New Labour before that, too. This is important for many reasons 1/3 #ukpolicycharts
This latest in my #ukpolicycharts series comes from The Health Foundation in 2022, and shows health inequality against neighbourhood deprivation 🧵 […]
[Original post on mstdn.social]
[Original post on mstdn.social]

June 26, 2024 at 8:43 AM
This latest in my #ukpolicycharts series comes from The Health Foundation in 2022, and shows health inequality against neighbourhood deprivation 🧵 […]
[Original post on mstdn.social]
[Original post on mstdn.social]
🧵 There have been some interesting #ukpolicycharts in the run-up to the General Election here on 4th July. This one published in @FT is particularly telling. Source: https://www.ft.com/content/bc19bbf4-2939-489e-a113-e21d5baf356d (paywall)
June 19, 2024 at 5:16 PM
🧵 There have been some interesting #ukpolicycharts in the run-up to the General Election here on 4th July. This one published in @FT is particularly telling. Source: https://www.ft.com/content/bc19bbf4-2939-489e-a113-e21d5baf356d (paywall)