


⛽ 38.7MB UK oil & gas dataset? Too large for standard tools, but Plotly Studio processed 50 years of data (1975-2025) in seconds using AI prompts—generating a comprehensive interactive dashboard with zero manual setup.
🔗 Explore the live dashboard: https://bit.ly/3WtaPNC
#plotlystudio
🔗 Explore the live dashboard: https://bit.ly/3WtaPNC
#plotlystudio
October 15, 2025 at 1:00 PM
⛽ 38.7MB UK oil & gas dataset? Too large for standard tools, but Plotly Studio processed 50 years of data (1975-2025) in seconds using AI prompts—generating a comprehensive interactive dashboard with zero manual setup.
🔗 Explore the live dashboard: https://bit.ly/3WtaPNC
#plotlystudio
🔗 Explore the live dashboard: https://bit.ly/3WtaPNC
#plotlystudio
At Data Driven Wisconsin 2025, Robert Claus shared how modern data apps help teams explore data, predict outcomes, and guide decisions. From spreadsheets to AI-assisted apps like Plotly Studio, the future is self-service and predictive. Read more 👉 plotly.com/blog/build-d...
#PlotlyStudio
#PlotlyStudio

Building Data Applications the Modern Way
Plotly engineering manager Robert Claus shares lessons on building modern data apps, tool tradeoffs, and the future of AI analytics.
plotly.com
October 10, 2025 at 3:30 PM
At Data Driven Wisconsin 2025, Robert Claus shared how modern data apps help teams explore data, predict outcomes, and guide decisions. From spreadsheets to AI-assisted apps like Plotly Studio, the future is self-service and predictive. Read more 👉 plotly.com/blog/build-d...
#PlotlyStudio
#PlotlyStudio

I built ECO+, a climate dashboard showing progress 🌍, for the Plotly Analytics Vibe-a-Thon.
See it here: 74f463cb-6ded-4206-bb1c-880fe2e73445.plotly.app
#PlotlyStudio #ClimateAction #DataForGood
See it here: 74f463cb-6ded-4206-bb1c-880fe2e73445.plotly.app
#PlotlyStudio #ClimateAction #DataForGood
Sign in
Don't have an account? Sign up
74f463cb-6ded-4206-bb1c-880fe2e73445.plotly.app
October 6, 2025 at 4:57 PM
I built ECO+, a climate dashboard showing progress 🌍, for the Plotly Analytics Vibe-a-Thon.
See it here: 74f463cb-6ded-4206-bb1c-880fe2e73445.plotly.app
#PlotlyStudio #ClimateAction #DataForGood
See it here: 74f463cb-6ded-4206-bb1c-880fe2e73445.plotly.app
#PlotlyStudio #ClimateAction #DataForGood

Just finished my hackathon project FutureFrames 🎬
It explores how sci-fi movies predicted real technologies turning imagination into reality.
Built and deployed in #PlotlyStudio, I had so much fun working on it :D @plotly.com
Check it out here:
🔗 ad8df62d-91a2-4e77-b3b1-3b2c42f98824.plotly.app
It explores how sci-fi movies predicted real technologies turning imagination into reality.
Built and deployed in #PlotlyStudio, I had so much fun working on it :D @plotly.com
Check it out here:
🔗 ad8df62d-91a2-4e77-b3b1-3b2c42f98824.plotly.app
Sign in
Don't have an account? Sign up
ad8df62d-91a2-4e77-b3b1-3b2c42f98824.plotly.app
October 6, 2025 at 4:55 PM
Just finished my hackathon project FutureFrames 🎬
It explores how sci-fi movies predicted real technologies turning imagination into reality.
Built and deployed in #PlotlyStudio, I had so much fun working on it :D @plotly.com
Check it out here:
🔗 ad8df62d-91a2-4e77-b3b1-3b2c42f98824.plotly.app
It explores how sci-fi movies predicted real technologies turning imagination into reality.
Built and deployed in #PlotlyStudio, I had so much fun working on it :D @plotly.com
Check it out here:
🔗 ad8df62d-91a2-4e77-b3b1-3b2c42f98824.plotly.app

Explore global wellbeing! Compare 47 countries across 11 dimensions, track trends, analyze demographics, and spot top performers. c0be0731-0373-4600-9137-7180d973e0ce.plotly.app
#plotlyStudio
#plotlyStudio


October 6, 2025 at 3:52 PM
Explore global wellbeing! Compare 47 countries across 11 dimensions, track trends, analyze demographics, and spot top performers. c0be0731-0373-4600-9137-7180d973e0ce.plotly.app
#plotlyStudio
#plotlyStudio

Just built an interactive data app exploring how education, income, health and happiness intertwine across OECD countries called The Wellbeing Correlation Playground.
Built using #PlotlyStudio , this app allows you play around with global wellbeing data and visualize correlations in real time!
Built using #PlotlyStudio , this app allows you play around with global wellbeing data and visualize correlations in real time!

October 6, 2025 at 2:59 PM
Just built an interactive data app exploring how education, income, health and happiness intertwine across OECD countries called The Wellbeing Correlation Playground.
Built using #PlotlyStudio , this app allows you play around with global wellbeing data and visualize correlations in real time!
Built using #PlotlyStudio , this app allows you play around with global wellbeing data and visualize correlations in real time!

Excited to share my latest interactive data app built with #PlotlyStudio — the OECD Employment and Well-being Data App!
It visualizes links between employment, job quality and well-being across OECD nations with clear, dynamic charts.
Explore it here
76b5065f-b7f2-4e9e-813c-e25702dc1392.plotly.app
It visualizes links between employment, job quality and well-being across OECD nations with clear, dynamic charts.
Explore it here
76b5065f-b7f2-4e9e-813c-e25702dc1392.plotly.app
Dash
76b5065f-b7f2-4e9e-813c-e25702dc1392.plotly.app
October 6, 2025 at 5:12 AM
Excited to share my latest interactive data app built with #PlotlyStudio — the OECD Employment and Well-being Data App!
It visualizes links between employment, job quality and well-being across OECD nations with clear, dynamic charts.
Explore it here
76b5065f-b7f2-4e9e-813c-e25702dc1392.plotly.app
It visualizes links between employment, job quality and well-being across OECD nations with clear, dynamic charts.
Explore it here
76b5065f-b7f2-4e9e-813c-e25702dc1392.plotly.app

Explore exoplanets, spot habitable worlds, and see the cosmos come alive. Built using #PlotlyStudio, OrbitLens transforms astrophysical data into interactive visualizations :)
Demo Video: www.youtube.com/watch?v=wA4R...
Project Dashboard: 6c9a05bf-d6e0-4ab0-a505-16ac92af5fc8.plotly.app
Demo Video: www.youtube.com/watch?v=wA4R...
Project Dashboard: 6c9a05bf-d6e0-4ab0-a505-16ac92af5fc8.plotly.app

OrbitLens | Plotly Analytics Vibe-a-Thon Hackathon
YouTube video by JonathanSolvesProblems
www.youtube.com
October 5, 2025 at 9:11 PM
Explore exoplanets, spot habitable worlds, and see the cosmos come alive. Built using #PlotlyStudio, OrbitLens transforms astrophysical data into interactive visualizations :)
Demo Video: www.youtube.com/watch?v=wA4R...
Project Dashboard: 6c9a05bf-d6e0-4ab0-a505-16ac92af5fc8.plotly.app
Demo Video: www.youtube.com/watch?v=wA4R...
Project Dashboard: 6c9a05bf-d6e0-4ab0-a505-16ac92af5fc8.plotly.app

🚀 Thrilled to share my #Plotly Analytics Vibe-a-Thon submission! An AI-powered dashboard that turns OECD wellbeing data into policy insights across 35 countries & 11 life dimensions — built in just 2 mins with #PlotlyStudio AI!
👉 Try It: 936cbd67-d7fb-4d60-b4e0-b6f77b6219cb.plotly.app
👉 Try It: 936cbd67-d7fb-4d60-b4e0-b6f77b6219cb.plotly.app
Dash
936cbd67-d7fb-4d60-b4e0-b6f77b6219cb.plotly.app
October 5, 2025 at 4:03 PM
🚀 Thrilled to share my #Plotly Analytics Vibe-a-Thon submission! An AI-powered dashboard that turns OECD wellbeing data into policy insights across 35 countries & 11 life dimensions — built in just 2 mins with #PlotlyStudio AI!
👉 Try It: 936cbd67-d7fb-4d60-b4e0-b6f77b6219cb.plotly.app
👉 Try It: 936cbd67-d7fb-4d60-b4e0-b6f77b6219cb.plotly.app

I just launched "Inferno Atlas" for the #PlotlyStudio Hackathon! 🌋 It's an interactive app that lets you explore 12,000 years of global volcanic eruptions. Watch the planet's history unfold and discover the most powerful volcanoes on Earth. Check out: 74af5ffa-86f4-467a-ac66-068733328b77.plotly.app
Dash
74af5ffa-86f4-467a-ac66-068733328b77.plotly.app
October 5, 2025 at 2:27 PM
I just launched "Inferno Atlas" for the #PlotlyStudio Hackathon! 🌋 It's an interactive app that lets you explore 12,000 years of global volcanic eruptions. Watch the planet's history unfold and discover the most powerful volcanoes on Earth. Check out: 74af5ffa-86f4-467a-ac66-068733328b77.plotly.app
Weekend plans? 😎👾 Join 1300+ participants in the Plotly Analytics Vibe-a-Thon! Build a data app in Plotly Studio, compete for $1,750, and show off your skills. 3 days left! Beginner-friendly, low/no-code, worldwide! https://analytics-vibeathon.devpost.com/
#PlotlyStudio
#PlotlyStudio

October 3, 2025 at 2:01 PM
Weekend plans? 😎👾 Join 1300+ participants in the Plotly Analytics Vibe-a-Thon! Build a data app in Plotly Studio, compete for $1,750, and show off your skills. 3 days left! Beginner-friendly, low/no-code, worldwide! https://analytics-vibeathon.devpost.com/
#PlotlyStudio
#PlotlyStudio

Just completed Wellbeing Atlas to the Plotly Analytics Vibe-a-Thon! Explore global well-being with maps, rankings, & radar charts to find your ideal country. Built with #PlotlyStudio.
Find your match here: 8d06442b-cff1-4727-8685-0601ea5e2326.plotly.app
#DataViz #OECD #Hackathon
Find your match here: 8d06442b-cff1-4727-8685-0601ea5e2326.plotly.app
#DataViz #OECD #Hackathon

October 2, 2025 at 7:40 PM
Just completed Wellbeing Atlas to the Plotly Analytics Vibe-a-Thon! Explore global well-being with maps, rankings, & radar charts to find your ideal country. Built with #PlotlyStudio.
Find your match here: 8d06442b-cff1-4727-8685-0601ea5e2326.plotly.app
#DataViz #OECD #Hackathon
Find your match here: 8d06442b-cff1-4727-8685-0601ea5e2326.plotly.app
#DataViz #OECD #Hackathon

The 4AM Test analyzes the gap between what countries claim (OECD surveys) vs what citizens search for during vulnerable hours (Google Trends).
Video Showcase: youtu.be/urmZXe1dKRY
70381211-90b5-4372-adaa-b7870c267fa1.plotly.app
github.com/hanish9193/T...
#PlotlyStudio#BehavioralData #Wellbeing
Video Showcase: youtu.be/urmZXe1dKRY
70381211-90b5-4372-adaa-b7870c267fa1.plotly.app
github.com/hanish9193/T...
#PlotlyStudio#BehavioralData #Wellbeing


October 2, 2025 at 6:46 AM
The 4AM Test analyzes the gap between what countries claim (OECD surveys) vs what citizens search for during vulnerable hours (Google Trends).
Video Showcase: youtu.be/urmZXe1dKRY
70381211-90b5-4372-adaa-b7870c267fa1.plotly.app
github.com/hanish9193/T...
#PlotlyStudio#BehavioralData #Wellbeing
Video Showcase: youtu.be/urmZXe1dKRY
70381211-90b5-4372-adaa-b7870c267fa1.plotly.app
github.com/hanish9193/T...
#PlotlyStudio#BehavioralData #Wellbeing

Took Plotly Studio for a spin in their Analytics Vibe-a-Thon and built this dashboard on South African well-being.
It's live now! You can filter by demographics, compare against BRICS nations, and see trends over time.
#DataViz
#SouthAfrica
#PlotlyStudio
[https://sawellbeingapp.plotly.app/]
It's live now! You can filter by demographics, compare against BRICS nations, and see trends over time.
#DataViz
#SouthAfrica
#PlotlyStudio
[https://sawellbeingapp.plotly.app/]

September 30, 2025 at 10:43 AM
Took Plotly Studio for a spin in their Analytics Vibe-a-Thon and built this dashboard on South African well-being.
It's live now! You can filter by demographics, compare against BRICS nations, and see trends over time.
#DataViz
#SouthAfrica
#PlotlyStudio
[https://sawellbeingapp.plotly.app/]
It's live now! You can filter by demographics, compare against BRICS nations, and see trends over time.
#DataViz
#SouthAfrica
#PlotlyStudio
[https://sawellbeingapp.plotly.app/]

Excited to be a part of the **Analytics VibeAThon**! 🚀📊 It’s a fantastic opportunity to sharpen my data analytics skills and work on innovative solutions. 🤓✨ #VibeAThon #Hackathon #DataAnalytics #PlotlyStudio #ChallengeAccepted
analytics-vibeathon.devpost.com?ref_feature=...
analytics-vibeathon.devpost.com?ref_feature=...

September 20, 2025 at 8:30 AM
Excited to be a part of the **Analytics VibeAThon**! 🚀📊 It’s a fantastic opportunity to sharpen my data analytics skills and work on innovative solutions. 🤓✨ #VibeAThon #Hackathon #DataAnalytics #PlotlyStudio #ChallengeAccepted
analytics-vibeathon.devpost.com?ref_feature=...
analytics-vibeathon.devpost.com?ref_feature=...
📣 Montreal — it’s almost time! On Sept 17 (6–8 PM), we’re opening the doors at Plotly HQ for an evening of hands-on exploration with #Python, Plotly Studio, and real Montreal datasets.
RSVP now! https://luma.com/pwg0e836
#PlotlyStudio
RSVP now! https://luma.com/pwg0e836
#PlotlyStudio

Plotly Data Exploration of Montreal · Luma
Join us in building Python-based visualizations, based on the Montreal dataset of the month. We'll work in small groups to build creative and rich apps to find…
luma.com
September 15, 2025 at 2:00 PM
📣 Montreal — it’s almost time! On Sept 17 (6–8 PM), we’re opening the doors at Plotly HQ for an evening of hands-on exploration with #Python, Plotly Studio, and real Montreal datasets.
RSVP now! https://luma.com/pwg0e836
#PlotlyStudio
RSVP now! https://luma.com/pwg0e836
#PlotlyStudio
Montreal, we’re bringing the Plotly community together! On Sept 17 (6–8 PM), join us at the Plotly HQ for an evening of hands-on exploration with Python, Plotly Studio, and real Montreal datasets. 😎✨
Register here 👉https://luma.com/pwg0e836
#PlotlyStudio #PlotlyCommunity
Register here 👉https://luma.com/pwg0e836
#PlotlyStudio #PlotlyCommunity

September 5, 2025 at 1:00 PM
Montreal, we’re bringing the Plotly community together! On Sept 17 (6–8 PM), join us at the Plotly HQ for an evening of hands-on exploration with Python, Plotly Studio, and real Montreal datasets. 😎✨
Register here 👉https://luma.com/pwg0e836
#PlotlyStudio #PlotlyCommunity
Register here 👉https://luma.com/pwg0e836
#PlotlyStudio #PlotlyCommunity
💡 What if anyone could turn data into insights? With Plotly Studio, AI helps you explore, visualize & build interactive dashboards in minutes. Join our Sept 23 webinar to see how: plotly.com/webinars/ris...
#PlotlyStudio #DataScience
#PlotlyStudio #DataScience

August 18, 2025 at 10:01 PM
💡 What if anyone could turn data into insights? With Plotly Studio, AI helps you explore, visualize & build interactive dashboards in minutes. Join our Sept 23 webinar to see how: plotly.com/webinars/ris...
#PlotlyStudio #DataScience
#PlotlyStudio #DataScience
The next era of analytics is here. 🧠⚡ On Sept 23, see how Plotly Studio uses AI to turn data into stunning dashboards & apps in minutes. No limits, no lag — just insight at the speed of thought.
🔗 plotly.com/webinars/ris...
#PlotlyStudio #AI #DataViz
🔗 plotly.com/webinars/ris...
#PlotlyStudio #AI #DataViz

Plotly Presents: The Rise of Vibe Analytics
Discover Plotly Studio, AI-powered analytics that turn your data into interactive dashboards and apps in minutes.
plotly.com
August 15, 2025 at 6:21 PM
The next era of analytics is here. 🧠⚡ On Sept 23, see how Plotly Studio uses AI to turn data into stunning dashboards & apps in minutes. No limits, no lag — just insight at the speed of thought.
🔗 plotly.com/webinars/ris...
#PlotlyStudio #AI #DataViz
🔗 plotly.com/webinars/ris...
#PlotlyStudio #AI #DataViz


🧪 Elements animated by year of discovery.
✨ Built in only 3 minutes from only a dataset and prompt! 🤯
⚙️ All the code and spec files were generated by Plotly Studio.
Try it: plotly.com/studio
#Chemistry #Python #Plotly #PlotlyStudio
🎵 Music: “Canarios” by Gaspar Sanz, performed by Domenic Ravita
✨ Built in only 3 minutes from only a dataset and prompt! 🤯
⚙️ All the code and spec files were generated by Plotly Studio.
Try it: plotly.com/studio
#Chemistry #Python #Plotly #PlotlyStudio
🎵 Music: “Canarios” by Gaspar Sanz, performed by Domenic Ravita
July 26, 2025 at 9:26 PM
🧪 Elements animated by year of discovery.
✨ Built in only 3 minutes from only a dataset and prompt! 🤯
⚙️ All the code and spec files were generated by Plotly Studio.
Try it: plotly.com/studio
#Chemistry #Python #Plotly #PlotlyStudio
🎵 Music: “Canarios” by Gaspar Sanz, performed by Domenic Ravita
✨ Built in only 3 minutes from only a dataset and prompt! 🤯
⚙️ All the code and spec files were generated by Plotly Studio.
Try it: plotly.com/studio
#Chemistry #Python #Plotly #PlotlyStudio
🎵 Music: “Canarios” by Gaspar Sanz, performed by Domenic Ravita
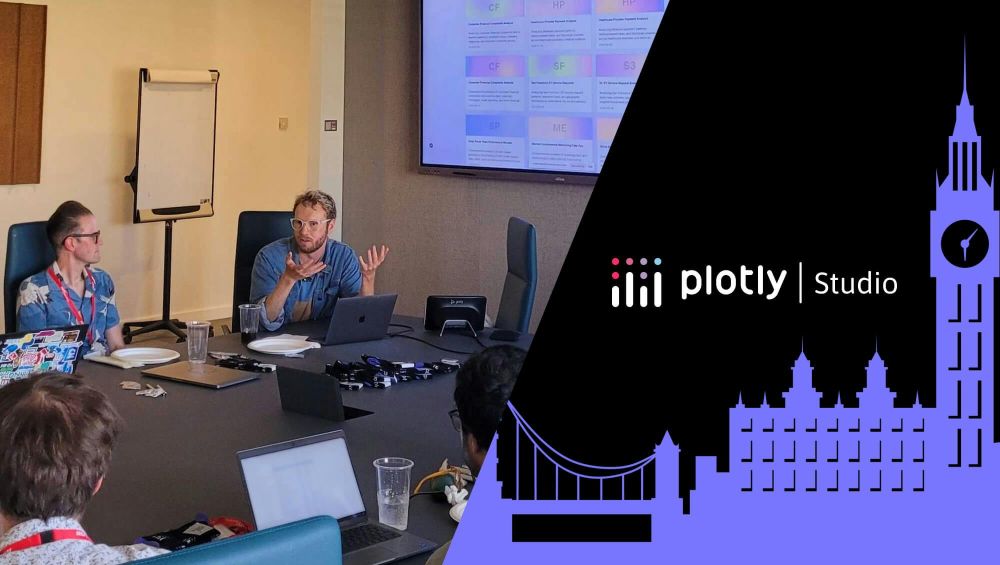
What if building a data app was as easy as uploading a dataset? 💻📊✨
At our London meetup, CPO Chris Parmer shared how Plotly Studio turns raw data into Dash apps in minutes — no code or prompts needed.
Catch the recap: plotly.com/blog/inside-...
#PlotlyStudio
At our London meetup, CPO Chris Parmer shared how Plotly Studio turns raw data into Dash apps in minutes — no code or prompts needed.
Catch the recap: plotly.com/blog/inside-...
#PlotlyStudio
Inside Plotly Studio: London Edition
Chris Parmer shares how Plotly Studio uses AI to generate data apps, the performance and design philosophy behind the product, and why building the right defaults matters for real-world analytics.
plotly.com
July 22, 2025 at 5:25 PM
What if building a data app was as easy as uploading a dataset? 💻📊✨
At our London meetup, CPO Chris Parmer shared how Plotly Studio turns raw data into Dash apps in minutes — no code or prompts needed.
Catch the recap: plotly.com/blog/inside-...
#PlotlyStudio
At our London meetup, CPO Chris Parmer shared how Plotly Studio turns raw data into Dash apps in minutes — no code or prompts needed.
Catch the recap: plotly.com/blog/inside-...
#PlotlyStudio