


National Zoning Atlas
@zoningatlas.bsky.social
The National Zoning Atlas is a collaborative of researchers digitizing, demystifying, & democratizing ~30,000 U.S. zoning codes. Explore our interactive map at zoningatlas.org/atlas.
The results from our slice calculations enable us to accurately measure how much land in a given region prohibits multi-family housing, requires large minimum lot sizes, includes parking requirements, permits ADUs, & more!
Learn more at www.zoningatlas.org/snapshots-me...
Learn more at www.zoningatlas.org/snapshots-me...

How the National Zoning Atlas Makes Zoning Snapshots (Methodology) — National Zoning Atlas
The National Zoning Atlas has developed Zoning Snapshots which summarize zoning conditions in any place published to the NZA. Type in the place name to find a jurisdiction, county, or metro/micropolit...
www.zoningatlas.org
November 14, 2025 at 2:58 PM
The results from our slice calculations enable us to accurately measure how much land in a given region prohibits multi-family housing, requires large minimum lot sizes, includes parking requirements, permits ADUs, & more!
Learn more at www.zoningatlas.org/snapshots-me...
Learn more at www.zoningatlas.org/snapshots-me...
That single lot on Van Ness Avenue has one base district (RC-4) & FIVE overlays. In San Francisco alone, different combinations of base & overlay districts result in 951 individual slices!
New York City has the most of any city in our database at 3,262. 🤯
New York City has the most of any city in our database at 3,262. 🤯
November 14, 2025 at 2:58 PM
That single lot on Van Ness Avenue has one base district (RC-4) & FIVE overlays. In San Francisco alone, different combinations of base & overlay districts result in 951 individual slices!
New York City has the most of any city in our database at 3,262. 🤯
New York City has the most of any city in our database at 3,262. 🤯
To give you an idea of the prevalence of slices, take a look at this image from San Francisco, where each color represents a different slice. In the next image, you can see an example of all the districts that were flattened in one highlighted slice.


November 14, 2025 at 2:58 PM
To give you an idea of the prevalence of slices, take a look at this image from San Francisco, where each color represents a different slice. In the next image, you can see an example of all the districts that were flattened in one highlighted slice.
The output appears like a stained-glass mosaic, where each component, or “slice,” represents a distinct set of zoning rules that apply to the underlying land.
November 14, 2025 at 2:58 PM
The output appears like a stained-glass mosaic, where each component, or “slice,” represents a distinct set of zoning rules that apply to the underlying land.
To generate our slices, we developed a method with our partners at GreenInfo Network to override the regulations in the base districts with those from the overlay districts by flattening all possible layers.
November 14, 2025 at 2:58 PM
To generate our slices, we developed a method with our partners at GreenInfo Network to override the regulations in the base districts with those from the overlay districts by flattening all possible layers.
Slices are the unique geometric combinations of base & overlay zoning districts that serve as the basic building block for all NZA statistics.
November 14, 2025 at 2:58 PM
Slices are the unique geometric combinations of base & overlay zoning districts that serve as the basic building block for all NZA statistics.
Failing to carefully account for this multi-layered regulatory landscape risks producing analytical errors and misrepresenting zoning conditions. “Slices” are the NZA’s solution to this problem.
November 14, 2025 at 2:58 PM
Failing to carefully account for this multi-layered regulatory landscape risks producing analytical errors and misrepresenting zoning conditions. “Slices” are the NZA’s solution to this problem.
Base districts contain the primary rules for the land underneath—like land use & lot density—while overlay districts sit *on top* of base districts & can override some of those primary rules. Jurisdictions introduce overlays to address things like environmental protection & historic preservation.
November 14, 2025 at 2:58 PM
Base districts contain the primary rules for the land underneath—like land use & lot density—while overlay districts sit *on top* of base districts & can override some of those primary rules. Jurisdictions introduce overlays to address things like environmental protection & historic preservation.
Calculating these zoning statistics would be fairly straightforward if zoning codes had clear maps and districts did not overlap. Alas! Many zoning maps include both base districts *and* overlay districts, so two (or more) sets of regulations can apply to the same area.
November 14, 2025 at 2:58 PM
Calculating these zoning statistics would be fairly straightforward if zoning codes had clear maps and districts did not overlap. Alas! Many zoning maps include both base districts *and* overlay districts, so two (or more) sets of regulations can apply to the same area.
The NZA is harmonizing zoning codes so users can compare zoning regulations across jurisdictions. This harmonization process is what allows us to create the statistics that serve as the basis of our Snapshots, reports, Atlas filters, & much more.
November 14, 2025 at 2:58 PM
The NZA is harmonizing zoning codes so users can compare zoning regulations across jurisdictions. This harmonization process is what allows us to create the statistics that serve as the basis of our Snapshots, reports, Atlas filters, & much more.
And that’s not at all! Join us for an official launch event for the Virginia Zoning Atlas, Tuesday 11/12 at 11am ET. 🎉
Register for the webinar ➡️ us06web.zoom.us/webinar/regi...
Register for the webinar ➡️ us06web.zoom.us/webinar/regi...

Welcome! You are invited to join a webinar: Launching the Virginia Zoning Atlas. After registering, you will receive a confirmation email about joining the webinar.
The National Zoning Atlas (NZA), in partnership with HousingForward Virginia, is excited to announce the completion of the Virginia Zoning Atlas—one of twelve states now fully integrated into the NZA ...
us06web.zoom.us
November 6, 2025 at 4:01 PM
And that’s not at all! Join us for an official launch event for the Virginia Zoning Atlas, Tuesday 11/12 at 11am ET. 🎉
Register for the webinar ➡️ us06web.zoom.us/webinar/regi...
Register for the webinar ➡️ us06web.zoom.us/webinar/regi...
For more resources on zoning in Virginia, visit www.zoningatlas.org/virginia.
Virginia Zoning Atlas — National Zoning Atlas
The Virginia Zoning Atlas is a project of the National Zoning Atlas, which aims to digitize, demystify, and democratize information about zoning conditions in more than 30,000 U.S. jurisdictions. The ...
www.zoningatlas.org
November 6, 2025 at 4:01 PM
For more resources on zoning in Virginia, visit www.zoningatlas.org/virginia.
This project was made possible thanks to Virginia Housing, Capital One, & early partners across the Commonwealth including the Mercatus Center at GMU, the Bob & Anna Lou Schaberg Foundation, & the Hampton Roads Community Foundation.
November 6, 2025 at 4:01 PM
This project was made possible thanks to Virginia Housing, Capital One, & early partners across the Commonwealth including the Mercatus Center at GMU, the Bob & Anna Lou Schaberg Foundation, & the Hampton Roads Community Foundation.
We also conducted deep dives into Northern Virginia & the metro areas around Charlottesville, Lynchburg, Richmond, Roanoke, & Virginia Beach. Together, these statewide & regional findings illuminate why restrictive zoning is a principal driver of the Commonwealth’s affordability crisis.


November 6, 2025 at 4:01 PM
We also conducted deep dives into Northern Virginia & the metro areas around Charlottesville, Lynchburg, Richmond, Roanoke, & Virginia Beach. Together, these statewide & regional findings illuminate why restrictive zoning is a principal driver of the Commonwealth’s affordability crisis.
🚗 Finding #5: Parking mandates exist on 93% of residential land. Again, rules like these drive up costs & reinforce car-oriented development patterns.
November 6, 2025 at 4:01 PM
🚗 Finding #5: Parking mandates exist on 93% of residential land. Again, rules like these drive up costs & reinforce car-oriented development patterns.
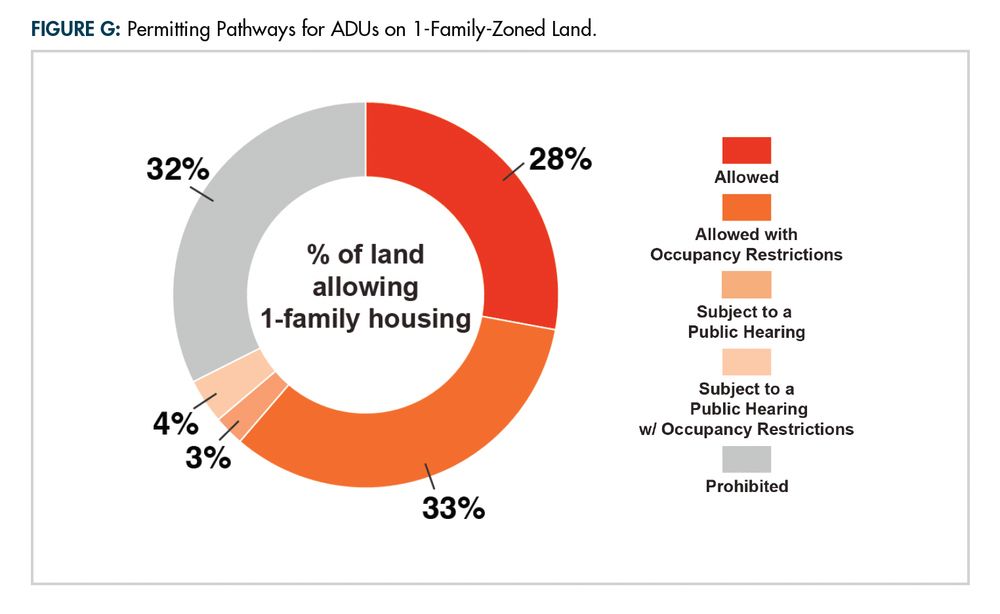
➕ Finding #4: One-third of single-family land bans accessory dwelling units (ADUs) & another third imposes restrictions. These rules limit the ability for ADUs to expand as a viable, alternative housing option.
November 6, 2025 at 4:01 PM
➕ Finding #4: One-third of single-family land bans accessory dwelling units (ADUs) & another third imposes restrictions. These rules limit the ability for ADUs to expand as a viable, alternative housing option.
📏 Finding #3: Minimum lot size mandates are widespread & often large. 99% of single-family land has a minimum lot size of which over half requires at least 40,000 sqft (~one acre). Lot sizes like these increase housing costs & contribute to environmentally destructive sprawl.

November 6, 2025 at 4:01 PM
📏 Finding #3: Minimum lot size mandates are widespread & often large. 99% of single-family land has a minimum lot size of which over half requires at least 40,000 sqft (~one acre). Lot sizes like these increase housing costs & contribute to environmentally destructive sprawl.
🏡 Finding #2: 98% of residential land allows single-family homes by right, but only 5% allows apartments by right, thus limiting access to the most affordable housing types.

November 6, 2025 at 4:01 PM
🏡 Finding #2: 98% of residential land allows single-family homes by right, but only 5% allows apartments by right, thus limiting access to the most affordable housing types.
🏘️ Finding #1: 92% of Virginia jurisdictions (shown in purple) have zoning ordinances—making zoning very influential for the 98% of the population that lives in a jurisdiction with zoning.

November 6, 2025 at 4:01 PM
🏘️ Finding #1: 92% of Virginia jurisdictions (shown in purple) have zoning ordinances—making zoning very influential for the 98% of the population that lives in a jurisdiction with zoning.
Produced in partnership with HousingForward Virginia, this report makes suggestions for the state’s new leaders grounded in 5 key findings:
November 6, 2025 at 4:01 PM
Produced in partnership with HousingForward Virginia, this report makes suggestions for the state’s new leaders grounded in 5 key findings:
Explore these cursed codes on the NZA interactive map at zoningatlas.org/atlas. #HappyHalloween! 🎃
EXPLORE THE ATLAS — National Zoning Atlas
The National Zoning Atlas illuminates critical information about the land use regulations that shape our lives. Explore zoning conditions for the thousands of cities, towns, counties, and other jurisd...
zoningatlas.org
October 31, 2025 at 2:00 PM
Explore these cursed codes on the NZA interactive map at zoningatlas.org/atlas. #HappyHalloween! 🎃
🔪 And finally, an abundance of single-family houses is the least of your worries in Nephi, UT, where at any moment you might find yourself living just 1,000 feet from a “slaughter house.” ☠️

October 31, 2025 at 2:00 PM
🔪 And finally, an abundance of single-family houses is the least of your worries in Nephi, UT, where at any moment you might find yourself living just 1,000 feet from a “slaughter house.” ☠️