


Yuval Simons
@yuvalsim.bsky.social
Assistant professor at the University of Chicago. Studying the population genetics of complex traits (mainly) and interested in using math to understand biology.
Join my lab, where science is fun and traits are complex!
Join my lab, where science is fun and traits are complex!
However, after we scale effect sizes by the heritability per site and account for differences in GWAS power, the genetic architectures of height and FEV1 look identical. The same is true for all other traits as well.

October 24, 2025 at 1:51 AM
However, after we scale effect sizes by the heritability per site and account for differences in GWAS power, the genetic architectures of height and FEV1 look identical. The same is true for all other traits as well.
The same isn’t true of traits that differ in their heritability per site, like height and FEV1.

October 24, 2025 at 1:51 AM
The same isn’t true of traits that differ in their heritability per site, like height and FEV1.
Therefore, two traits that differ in their target size but not in their heritability per site will differ only in the number of variants affecting them, but not in the variants’ joint distribution of frequencies and effect sizes. Just what we see for height and platelet crit.

October 24, 2025 at 1:51 AM
Therefore, two traits that differ in their target size but not in their heritability per site will differ only in the number of variants affecting them, but not in the variants’ joint distribution of frequencies and effect sizes. Just what we see for height and platelet crit.
So why do traits differ in their genetic architecture?
While the distribution of selection coefficients is similar between traits, traits vastly differ in their target size and heritability.
The genetic architecture scales with these two parameters:
While the distribution of selection coefficients is similar between traits, traits vastly differ in their target size and heritability.
The genetic architecture scales with these two parameters:

October 24, 2025 at 1:51 AM
So why do traits differ in their genetic architecture?
While the distribution of selection coefficients is similar between traits, traits vastly differ in their target size and heritability.
The genetic architecture scales with these two parameters:
While the distribution of selection coefficients is similar between traits, traits vastly differ in their target size and heritability.
The genetic architecture scales with these two parameters:
As validation of our inferred distribution of selection coefficients we looked at allele ages:
RELATE infers the GWAS hits for our 95 traits to be younger than matched controls, indicating they are under selection. Our model predicts very well the distribution of allele ages.
RELATE infers the GWAS hits for our 95 traits to be younger than matched controls, indicating they are under selection. Our model predicts very well the distribution of allele ages.

October 24, 2025 at 1:51 AM
As validation of our inferred distribution of selection coefficients we looked at allele ages:
RELATE infers the GWAS hits for our 95 traits to be younger than matched controls, indicating they are under selection. Our model predicts very well the distribution of allele ages.
RELATE infers the GWAS hits for our 95 traits to be younger than matched controls, indicating they are under selection. Our model predicts very well the distribution of allele ages.
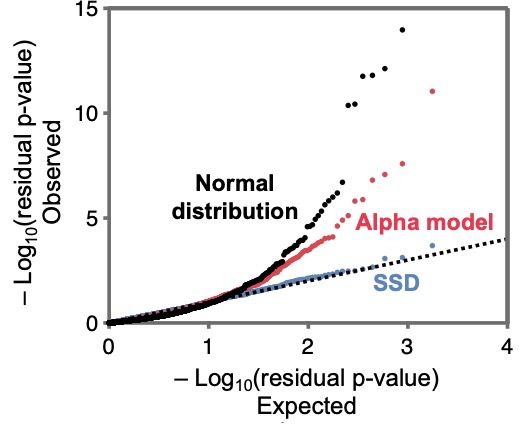
The single shared distribution (or SSD) model fits the data very well and much better than simple heuristic models with a Normal distribution of effect sizes.
October 24, 2025 at 1:51 AM
The single shared distribution (or SSD) model fits the data very well and much better than simple heuristic models with a Normal distribution of effect sizes.
We therefore, suggest a useful approximation where we assume that there is a single shared distribution of selection coefficients among traits.

October 24, 2025 at 1:51 AM
We therefore, suggest a useful approximation where we assume that there is a single shared distribution of selection coefficients among traits.
We infer these 3 components for 95 continuous traits in the UK biobank.
While there are differences in the distribution of selection coefficients between traits, their confidence intervals overlap.
While there are differences in the distribution of selection coefficients between traits, their confidence intervals overlap.

October 24, 2025 at 1:51 AM
We infer these 3 components for 95 continuous traits in the UK biobank.
While there are differences in the distribution of selection coefficients between traits, their confidence intervals overlap.
While there are differences in the distribution of selection coefficients between traits, their confidence intervals overlap.
Our model has three components:
(1) The target size for a trait - the number of sites where a mutation would affect a given trait.
(2) The distribution of selection coefficients at those sites.
(3) The mean heritability per site – the heritability divided by the target size.
(1) The target size for a trait - the number of sites where a mutation would affect a given trait.
(2) The distribution of selection coefficients at those sites.
(3) The mean heritability per site – the heritability divided by the target size.

October 24, 2025 at 1:51 AM
Our model has three components:
(1) The target size for a trait - the number of sites where a mutation would affect a given trait.
(2) The distribution of selection coefficients at those sites.
(3) The mean heritability per site – the heritability divided by the target size.
(1) The target size for a trait - the number of sites where a mutation would affect a given trait.
(2) The distribution of selection coefficients at those sites.
(3) The mean heritability per site – the heritability divided by the target size.
However, after we scale effect sizes by the heritability per site and account for differences in GWAS power, the genetic architectures of height and FEV1 look identical. The same is true for all other traits as well.

October 24, 2025 at 1:40 AM
However, after we scale effect sizes by the heritability per site and account for differences in GWAS power, the genetic architectures of height and FEV1 look identical. The same is true for all other traits as well.
The same isn’t true of traits that differ in their heritability per site, like height and FEV1.

October 24, 2025 at 1:40 AM
The same isn’t true of traits that differ in their heritability per site, like height and FEV1.
Therefore, two traits that differ in their target size but not in their heritability per site will differ only in the number of variants affecting them, but not in the variants’ joint distribution of frequencies and effect sizes. Just what we see for height and platelet crit.

October 24, 2025 at 1:40 AM
Therefore, two traits that differ in their target size but not in their heritability per site will differ only in the number of variants affecting them, but not in the variants’ joint distribution of frequencies and effect sizes. Just what we see for height and platelet crit.
However, in a third system (GB1-IgG binding, Olson, Wu and Sun 2014) our method struggles because of the interplay of mutation effects on both protein binding and folding, suggesting the need to expand our work to consider two (or more) underlying scales of effect.

April 24, 2025 at 6:56 PM
However, in a third system (GB1-IgG binding, Olson, Wu and Sun 2014) our method struggles because of the interplay of mutation effects on both protein binding and folding, suggesting the need to expand our work to consider two (or more) underlying scales of effect.
We see similar results for the PDZ-CRIPT system.

April 24, 2025 at 6:56 PM
We see similar results for the PDZ-CRIPT system.
For FOS-JUN, we see that position that are in close physical distance are highly enriched for specific (non-global) epistatic interactions and, vice versa, that the interactions we identify correspond to positions in close physical contact.

April 24, 2025 at 6:56 PM
For FOS-JUN, we see that position that are in close physical distance are highly enriched for specific (non-global) epistatic interactions and, vice versa, that the interactions we identify correspond to positions in close physical contact.
Lastly, we test for enrichment in low p-values between positions.

April 24, 2025 at 6:56 PM
Lastly, we test for enrichment in low p-values between positions.
Assuming true interactions are rare, the collection of bootstrapped D_{(r,s)} values can be used a null distribution for that value in the original dataset.

April 24, 2025 at 6:56 PM
Assuming true interactions are rare, the collection of bootstrapped D_{(r,s)} values can be used a null distribution for that value in the original dataset.
Next, we bootstrap resample the entire dataset and recalculate D for each pair. We then reorder mutations based on their resampled rank in the WT background. The resampled value for D_{(r,s)} can now involve a different mutation pair that the original value.

April 24, 2025 at 6:56 PM
Next, we bootstrap resample the entire dataset and recalculate D for each pair. We then reorder mutations based on their resampled rank in the WT background. The resampled value for D_{(r,s)} can now involve a different mutation pair that the original value.
First, we calculate our statistic for each pair of mutations D_{i,j}. We then also consider D as a function of the WT rank: if mutation i is the rth largest on the WT background and mutation j the sth largest then D_{(r,s)}=D_{i,j}.

April 24, 2025 at 6:56 PM
First, we calculate our statistic for each pair of mutations D_{i,j}. We then also consider D as a function of the WT rank: if mutation i is the rth largest on the WT background and mutation j the sth largest then D_{(r,s)}=D_{i,j}.
We therefore devise a resampling procedure to obtain p-values, which we call resample and reorder – or R&R.
Let’s break it down:
Let’s break it down:

April 24, 2025 at 6:56 PM
We therefore devise a resampling procedure to obtain p-values, which we call resample and reorder – or R&R.
Let’s break it down:
Let’s break it down:
We define a measure of epistasis between mutations i and j as the sum of the difference in the rank of mutation i on the background of mutation j and the WT background plus the difference in the rank of mutation j on the background of mutation i and the WT background.

April 24, 2025 at 6:56 PM
We define a measure of epistasis between mutations i and j as the sum of the difference in the rank of mutation i on the background of mutation j and the WT background plus the difference in the rank of mutation j on the background of mutation i and the WT background.
The order of the double mutants is highly correlated between most mutational backgrounds. However, this is not true for highly deleterious or beneficial mutations, when the fitness measurement is saturated, as evidenced by the Spearman correlations.

April 24, 2025 at 6:56 PM
The order of the double mutants is highly correlated between most mutational backgrounds. However, this is not true for highly deleterious or beneficial mutations, when the fitness measurement is saturated, as evidenced by the Spearman correlations.
We apply these insights to deep mutational scans (DMSs), in which all double amino acid mutants are generated for a wild-type protein and their fitness is measured as binding to a ligand.

April 24, 2025 at 6:56 PM
We apply these insights to deep mutational scans (DMSs), in which all double amino acid mutants are generated for a wild-type protein and their fitness is measured as binding to a ligand.
Difference in rank order of mutations on different genetic backgrounds can then be used as a measure of epistasis that would be scale-invariant and could therefore be used to tease apart biological sources of epistasis from scale effects.

April 24, 2025 at 6:56 PM
Difference in rank order of mutations on different genetic backgrounds can then be used as a measure of epistasis that would be scale-invariant and could therefore be used to tease apart biological sources of epistasis from scale effects.
Under monotonic transformation of the scale of measurement, the rank order of mutation effects is preserved on different genetic backgrounds.

April 24, 2025 at 6:56 PM
Under monotonic transformation of the scale of measurement, the rank order of mutation effects is preserved on different genetic backgrounds.