


Yohan
@yohan.so
Sharing insights from the intersection of geospatial data science and economics | PhD in Economic Geography from LSE | Data Scientist at ADB. Views are my own.
Newsletter: http://spatialedge.co
Newsletter: http://spatialedge.co
Interested in getting a short overview of the latest geospatial papers and datasets each week?
Subscribe to the Spatial Edge newsletter: yohan.so
Subscribe to the Spatial Edge newsletter: yohan.so

April 29, 2025 at 11:13 AM
Interested in getting a short overview of the latest geospatial papers and datasets each week?
Subscribe to the Spatial Edge newsletter: yohan.so
Subscribe to the Spatial Edge newsletter: yohan.so
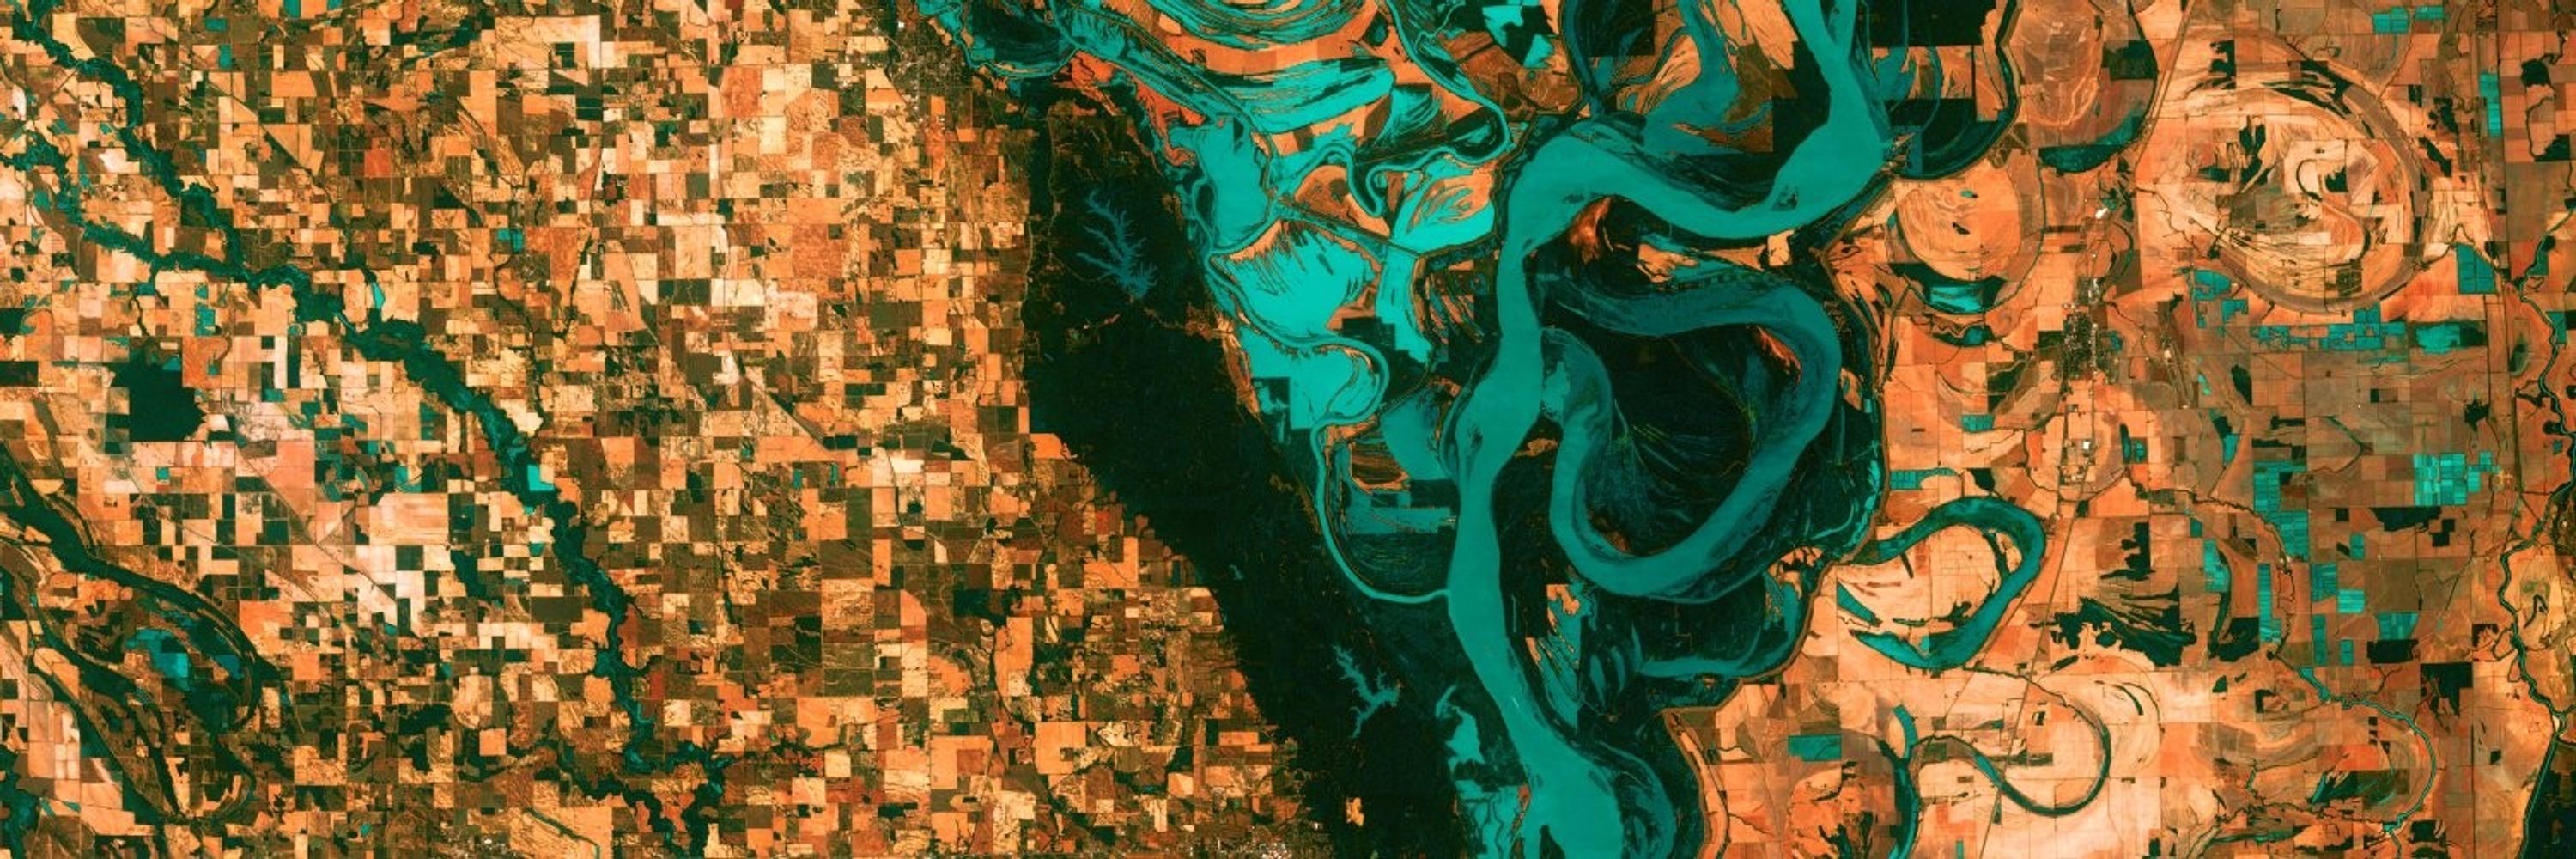
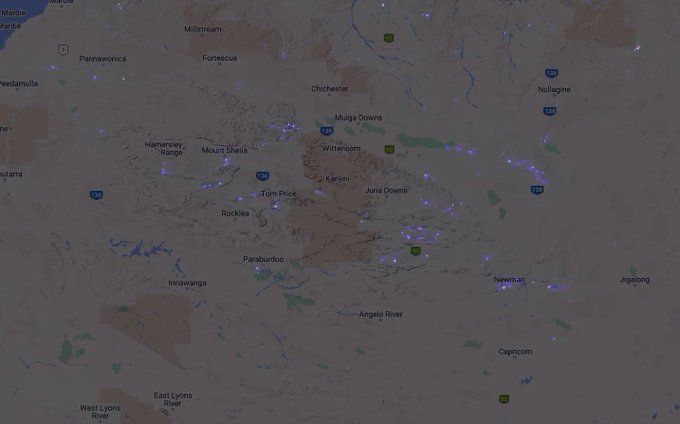
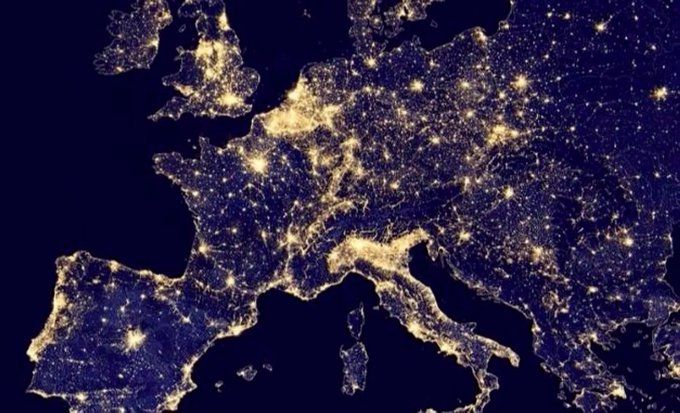
See this image of the Pilbara region in Australia
Here we see:
1. lights generated from mines being lit up at night (i.e. production-based economic activity), AND
2. lights generated by mining staff who are eating out at night (e.g. consumption-based economic activity).
Here we see:
1. lights generated from mines being lit up at night (i.e. production-based economic activity), AND
2. lights generated by mining staff who are eating out at night (e.g. consumption-based economic activity).
April 29, 2025 at 11:13 AM
See this image of the Pilbara region in Australia
Here we see:
1. lights generated from mines being lit up at night (i.e. production-based economic activity), AND
2. lights generated by mining staff who are eating out at night (e.g. consumption-based economic activity).
Here we see:
1. lights generated from mines being lit up at night (i.e. production-based economic activity), AND
2. lights generated by mining staff who are eating out at night (e.g. consumption-based economic activity).
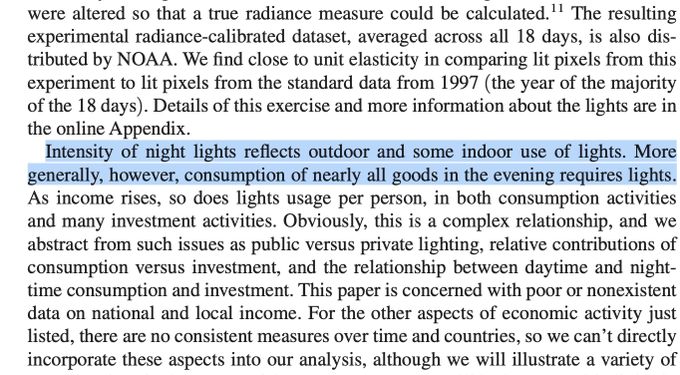
However, we need to be careful about double counting.
E.g. combining production values with income and consumption figures without accounting for overlaps could distort things.
Henderson et al., essentially view nightlights as a measure of nighttime consumption:
E.g. combining production values with income and consumption figures without accounting for overlaps could distort things.
Henderson et al., essentially view nightlights as a measure of nighttime consumption:
April 29, 2025 at 11:13 AM
However, we need to be careful about double counting.
E.g. combining production values with income and consumption figures without accounting for overlaps could distort things.
Henderson et al., essentially view nightlights as a measure of nighttime consumption:
E.g. combining production values with income and consumption figures without accounting for overlaps could distort things.
Henderson et al., essentially view nightlights as a measure of nighttime consumption:
1. Economic Activity
It’s vague to say nightlights capture ‘economic activity’.
What 𝙚𝙭𝙖𝙘𝙩𝙡𝙮 do we mean by economic activity?
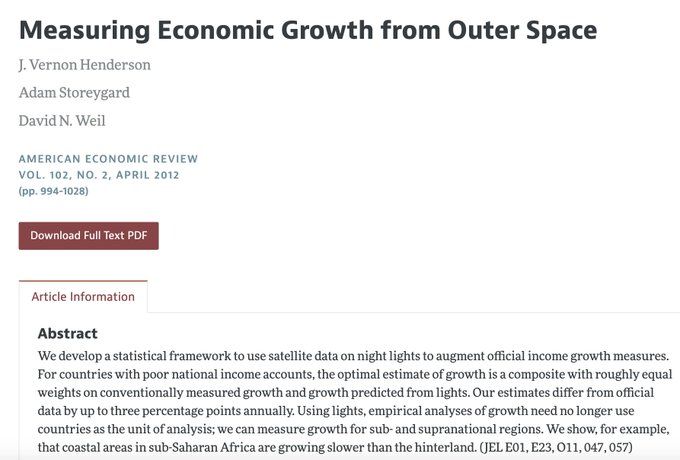
The most popular paper on nightlights and economic activity is Henderson et al. (2012).
It uses nightlights as a proxy for real GDP growth.
It’s vague to say nightlights capture ‘economic activity’.
What 𝙚𝙭𝙖𝙘𝙩𝙡𝙮 do we mean by economic activity?
The most popular paper on nightlights and economic activity is Henderson et al. (2012).
It uses nightlights as a proxy for real GDP growth.
April 29, 2025 at 11:13 AM
1. Economic Activity
It’s vague to say nightlights capture ‘economic activity’.
What 𝙚𝙭𝙖𝙘𝙩𝙡𝙮 do we mean by economic activity?
The most popular paper on nightlights and economic activity is Henderson et al. (2012).
It uses nightlights as a proxy for real GDP growth.
It’s vague to say nightlights capture ‘economic activity’.
What 𝙚𝙭𝙖𝙘𝙩𝙡𝙮 do we mean by economic activity?
The most popular paper on nightlights and economic activity is Henderson et al. (2012).
It uses nightlights as a proxy for real GDP growth.
If you're using nightlights you need to know about two things:
1. What 𝙩𝙮𝙥𝙚 of economic activity it captures, and
2. 𝙎𝙥𝙖𝙩𝙞𝙖𝙡 𝙢𝙞𝙨𝙢𝙖𝙩𝙘𝙝𝙚𝙨
Here's the breakdown (in simple terms):
1. What 𝙩𝙮𝙥𝙚 of economic activity it captures, and
2. 𝙎𝙥𝙖𝙩𝙞𝙖𝙡 𝙢𝙞𝙨𝙢𝙖𝙩𝙘𝙝𝙚𝙨
Here's the breakdown (in simple terms):
April 29, 2025 at 11:13 AM
If you're using nightlights you need to know about two things:
1. What 𝙩𝙮𝙥𝙚 of economic activity it captures, and
2. 𝙎𝙥𝙖𝙩𝙞𝙖𝙡 𝙢𝙞𝙨𝙢𝙖𝙩𝙘𝙝𝙚𝙨
Here's the breakdown (in simple terms):
1. What 𝙩𝙮𝙥𝙚 of economic activity it captures, and
2. 𝙎𝙥𝙖𝙩𝙞𝙖𝙡 𝙢𝙞𝙨𝙢𝙖𝙩𝙘𝙝𝙚𝙨
Here's the breakdown (in simple terms):
Interested in getting a short overview of the latest geospatial papers and datasets each week?
Subscribe to the Spatial Edge newsletter: yohan.so
Subscribe to the Spatial Edge newsletter: yohan.so
April 28, 2025 at 11:29 AM
Interested in getting a short overview of the latest geospatial papers and datasets each week?
Subscribe to the Spatial Edge newsletter: yohan.so
Subscribe to the Spatial Edge newsletter: yohan.so
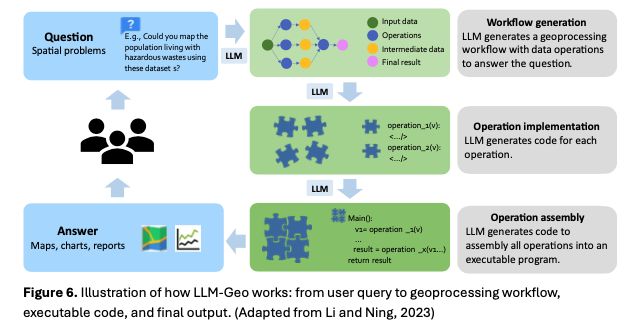
• 𝗟𝗟𝗠-𝗖𝗮𝘁: Makes maps iteratively and improves them based on its own visual critique.
• 𝗚𝗜𝗦 𝗖𝗼𝗽𝗶𝗹𝗼𝘁: Helps QGIS users do analysis more efficiently.
• 𝗚𝗜𝗦 𝗖𝗼𝗽𝗶𝗹𝗼𝘁: Helps QGIS users do analysis more efficiently.
April 28, 2025 at 11:29 AM
• 𝗟𝗟𝗠-𝗖𝗮𝘁: Makes maps iteratively and improves them based on its own visual critique.
• 𝗚𝗜𝗦 𝗖𝗼𝗽𝗶𝗹𝗼𝘁: Helps QGIS users do analysis more efficiently.
• 𝗚𝗜𝗦 𝗖𝗼𝗽𝗶𝗹𝗼𝘁: Helps QGIS users do analysis more efficiently.
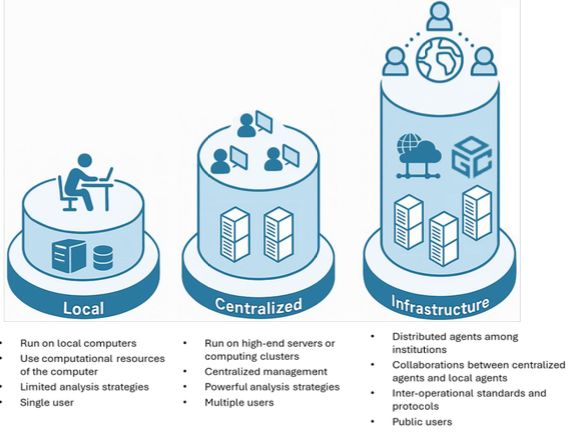
𝗦𝗰𝗮𝗹𝗲𝘀 𝗼𝗳 𝗢𝗽𝗲𝗿𝗮𝘁𝗶𝗼𝗻
There are three technical scales:
1. Local: Runs on a single machine
2. Centralized: Uses cloud computing to handle larger tasks.
3. Infrastructure-scale: Distributed systems for massive analysis, possibly run by governments or research institutions.
There are three technical scales:
1. Local: Runs on a single machine
2. Centralized: Uses cloud computing to handle larger tasks.
3. Infrastructure-scale: Distributed systems for massive analysis, possibly run by governments or research institutions.
April 28, 2025 at 11:29 AM
𝗦𝗰𝗮𝗹𝗲𝘀 𝗼𝗳 𝗢𝗽𝗲𝗿𝗮𝘁𝗶𝗼𝗻
There are three technical scales:
1. Local: Runs on a single machine
2. Centralized: Uses cloud computing to handle larger tasks.
3. Infrastructure-scale: Distributed systems for massive analysis, possibly run by governments or research institutions.
There are three technical scales:
1. Local: Runs on a single machine
2. Centralized: Uses cloud computing to handle larger tasks.
3. Infrastructure-scale: Distributed systems for massive analysis, possibly run by governments or research institutions.
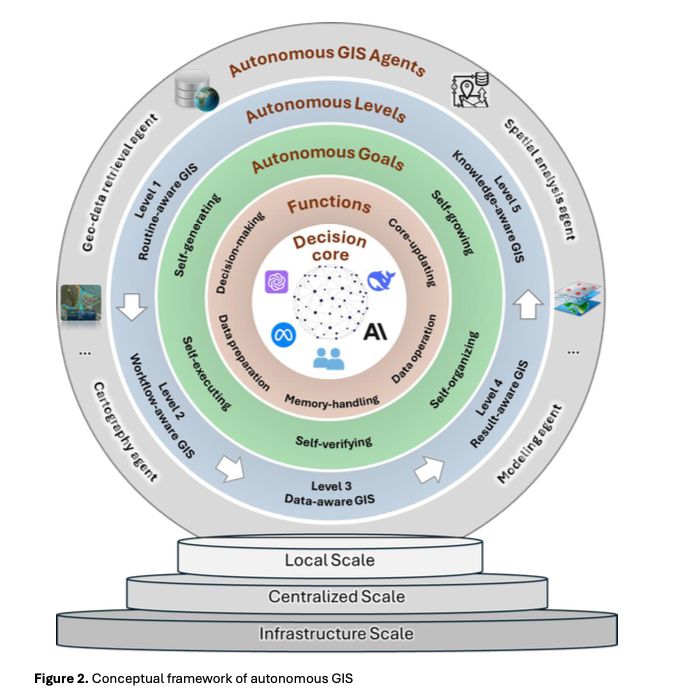
There are 5 goals for autonomous GIS:
𝟭. 𝗦𝗲𝗹𝗳-𝗴𝗲𝗻𝗲𝗿𝗮𝘁𝗶𝗻𝗴 – It creates ideas, workflows, code, and insights on its own.
𝟮. 𝗦𝗲𝗹𝗳-𝗲𝘅𝗲𝗰𝘂𝘁𝗶𝗻𝗴 – It can run the tasks (e.g., calculating distances, drawing maps).
𝟭. 𝗦𝗲𝗹𝗳-𝗴𝗲𝗻𝗲𝗿𝗮𝘁𝗶𝗻𝗴 – It creates ideas, workflows, code, and insights on its own.
𝟮. 𝗦𝗲𝗹𝗳-𝗲𝘅𝗲𝗰𝘂𝘁𝗶𝗻𝗴 – It can run the tasks (e.g., calculating distances, drawing maps).
April 28, 2025 at 11:29 AM
There are 5 goals for autonomous GIS:
𝟭. 𝗦𝗲𝗹𝗳-𝗴𝗲𝗻𝗲𝗿𝗮𝘁𝗶𝗻𝗴 – It creates ideas, workflows, code, and insights on its own.
𝟮. 𝗦𝗲𝗹𝗳-𝗲𝘅𝗲𝗰𝘂𝘁𝗶𝗻𝗴 – It can run the tasks (e.g., calculating distances, drawing maps).
𝟭. 𝗦𝗲𝗹𝗳-𝗴𝗲𝗻𝗲𝗿𝗮𝘁𝗶𝗻𝗴 – It creates ideas, workflows, code, and insights on its own.
𝟮. 𝗦𝗲𝗹𝗳-𝗲𝘅𝗲𝗰𝘂𝘁𝗶𝗻𝗴 – It can run the tasks (e.g., calculating distances, drawing maps).


Interested in getting a short overview of the latest geospatial papers and datasets each week?
Subscribe to the Spatial Edge newsletter: yohan.so
Subscribe to the Spatial Edge newsletter: yohan.so
April 25, 2025 at 11:24 AM
Interested in getting a short overview of the latest geospatial papers and datasets each week?
Subscribe to the Spatial Edge newsletter: yohan.so
Subscribe to the Spatial Edge newsletter: yohan.so
7. GPS data
Finally, you can also purchase raw GPS data from mobile phones.
This is available from companies such as:
• Huq
• Factori
• Veraset
• Quadrant
• Foursquare
Finally, you can also purchase raw GPS data from mobile phones.
This is available from companies such as:
• Huq
• Factori
• Veraset
• Quadrant
• Foursquare

April 25, 2025 at 11:24 AM
7. GPS data
Finally, you can also purchase raw GPS data from mobile phones.
This is available from companies such as:
• Huq
• Factori
• Veraset
• Quadrant
• Foursquare
Finally, you can also purchase raw GPS data from mobile phones.
This is available from companies such as:
• Huq
• Factori
• Veraset
• Quadrant
• Foursquare
6. Here's Traffic Data
They provide real-time data on:
• traffic flows (i.e. speed and congestion)
• incidents (e.g. road closures)
This is also a paid dataset.
Link: here.com/platform/tra...
They provide real-time data on:
• traffic flows (i.e. speed and congestion)
• incidents (e.g. road closures)
This is also a paid dataset.
Link: here.com/platform/tra...

April 25, 2025 at 11:24 AM
6. Here's Traffic Data
They provide real-time data on:
• traffic flows (i.e. speed and congestion)
• incidents (e.g. road closures)
This is also a paid dataset.
Link: here.com/platform/tra...
They provide real-time data on:
• traffic flows (i.e. speed and congestion)
• incidents (e.g. road closures)
This is also a paid dataset.
Link: here.com/platform/tra...
5. @mapbox.com 's Traffic Data
This covers live data for 30 billion road segments across the world.
They also provide 'typical' traffic data.
This is also a paid product.
Link: mapbox.com/traffic-data
This covers live data for 30 billion road segments across the world.
They also provide 'typical' traffic data.
This is also a paid product.
Link: mapbox.com/traffic-data

April 25, 2025 at 11:24 AM
5. @mapbox.com 's Traffic Data
This covers live data for 30 billion road segments across the world.
They also provide 'typical' traffic data.
This is also a paid product.
Link: mapbox.com/traffic-data
This covers live data for 30 billion road segments across the world.
They also provide 'typical' traffic data.
This is also a paid product.
Link: mapbox.com/traffic-data
4. TomTom's Traffic Stats
This a paid product that provides granular data on traffic.
It's available via API or web portal.
You can get limited access through the 30-day free trial of the Move platform.
Link: tomtom.com/products/tra...
This a paid product that provides granular data on traffic.
It's available via API or web portal.
You can get limited access through the 30-day free trial of the Move platform.
Link: tomtom.com/products/tra...

April 25, 2025 at 11:24 AM
4. TomTom's Traffic Stats
This a paid product that provides granular data on traffic.
It's available via API or web portal.
You can get limited access through the 30-day free trial of the Move platform.
Link: tomtom.com/products/tra...
This a paid product that provides granular data on traffic.
It's available via API or web portal.
You can get limited access through the 30-day free trial of the Move platform.
Link: tomtom.com/products/tra...
3. Meta's Movement Distribution data
This shows shows the range of movement of people away from the area where they live on a daily basis.
It's useful for measuring transportation, tourism, and displacement.
This data is updated monthly and is available globally.
Link: buff.ly/dxmAEPm
This shows shows the range of movement of people away from the area where they live on a daily basis.
It's useful for measuring transportation, tourism, and displacement.
This data is updated monthly and is available globally.
Link: buff.ly/dxmAEPm

April 25, 2025 at 11:24 AM
3. Meta's Movement Distribution data
This shows shows the range of movement of people away from the area where they live on a daily basis.
It's useful for measuring transportation, tourism, and displacement.
This data is updated monthly and is available globally.
Link: buff.ly/dxmAEPm
This shows shows the range of movement of people away from the area where they live on a daily basis.
It's useful for measuring transportation, tourism, and displacement.
This data is updated monthly and is available globally.
Link: buff.ly/dxmAEPm
2. UTD19
This is the largest open-source traffic dataset.
It covers 40 cities (mainly in Europe), but its getting a bit out of date now.
This is the largest open-source traffic dataset.
It covers 40 cities (mainly in Europe), but its getting a bit out of date now.

April 25, 2025 at 11:24 AM
2. UTD19
This is the largest open-source traffic dataset.
It covers 40 cities (mainly in Europe), but its getting a bit out of date now.
This is the largest open-source traffic dataset.
It covers 40 cities (mainly in Europe), but its getting a bit out of date now.
1. Google's Traffic Layer
Google's Maps API allows you to access traffic data.
Link: developers.google.com/maps/documen...
Google's Maps API allows you to access traffic data.
Link: developers.google.com/maps/documen...

April 25, 2025 at 11:24 AM
1. Google's Traffic Layer
Google's Maps API allows you to access traffic data.
Link: developers.google.com/maps/documen...
Google's Maps API allows you to access traffic data.
Link: developers.google.com/maps/documen...
By far, the data I'm asked most about is related to traffic and mobility.
It's for good reason.
This data is insanely hard to come by.
So I've compiled a comprehensive list of datasets.
These cover both paid and free options:
It's for good reason.
This data is insanely hard to come by.
So I've compiled a comprehensive list of datasets.
These cover both paid and free options:

April 25, 2025 at 11:24 AM
By far, the data I'm asked most about is related to traffic and mobility.
It's for good reason.
This data is insanely hard to come by.
So I've compiled a comprehensive list of datasets.
These cover both paid and free options:
It's for good reason.
This data is insanely hard to come by.
So I've compiled a comprehensive list of datasets.
These cover both paid and free options:
Interested in getting a short overview of the latest geospatial papers and datasets each week?
Subscribe to the Spatial Edge newsletter: yohan.so
Subscribe to the Spatial Edge newsletter: yohan.so
April 24, 2025 at 11:17 AM
Interested in getting a short overview of the latest geospatial papers and datasets each week?
Subscribe to the Spatial Edge newsletter: yohan.so
Subscribe to the Spatial Edge newsletter: yohan.so
7. Land use
We can use land-use data to measure things like:
• urban sprawl
• deforestation
• depletion of water
• growth of agriculture
My favourite two are:
• Google's Dynamic World
• ESRI's Living Atlas
Links:
• developers.google.com/earth-engine...
• livingatlas.arcgis.com/en/home/
We can use land-use data to measure things like:
• urban sprawl
• deforestation
• depletion of water
• growth of agriculture
My favourite two are:
• Google's Dynamic World
• ESRI's Living Atlas
Links:
• developers.google.com/earth-engine...
• livingatlas.arcgis.com/en/home/

April 24, 2025 at 11:17 AM
7. Land use
We can use land-use data to measure things like:
• urban sprawl
• deforestation
• depletion of water
• growth of agriculture
My favourite two are:
• Google's Dynamic World
• ESRI's Living Atlas
Links:
• developers.google.com/earth-engine...
• livingatlas.arcgis.com/en/home/
We can use land-use data to measure things like:
• urban sprawl
• deforestation
• depletion of water
• growth of agriculture
My favourite two are:
• Google's Dynamic World
• ESRI's Living Atlas
Links:
• developers.google.com/earth-engine...
• livingatlas.arcgis.com/en/home/
6. Climate projections
I've previously used climate projection data for temperature, precipitation and wind.
These provide 𝙙𝙖𝙞𝙡𝙮 geospatial forecasts until 31 Dec 2100.
They use Global Circulation Models (GCMs) for various scenarios.
Link: data.isimip.org/datasets/24c...
I've previously used climate projection data for temperature, precipitation and wind.
These provide 𝙙𝙖𝙞𝙡𝙮 geospatial forecasts until 31 Dec 2100.
They use Global Circulation Models (GCMs) for various scenarios.
Link: data.isimip.org/datasets/24c...

April 24, 2025 at 11:17 AM
6. Climate projections
I've previously used climate projection data for temperature, precipitation and wind.
These provide 𝙙𝙖𝙞𝙡𝙮 geospatial forecasts until 31 Dec 2100.
They use Global Circulation Models (GCMs) for various scenarios.
Link: data.isimip.org/datasets/24c...
I've previously used climate projection data for temperature, precipitation and wind.
These provide 𝙙𝙖𝙞𝙡𝙮 geospatial forecasts until 31 Dec 2100.
They use Global Circulation Models (GCMs) for various scenarios.
Link: data.isimip.org/datasets/24c...
5. Flooding
I've had experience with 3 flooding datasets:
• Fathom
• JBA Flood maps
• The Global Flood Database
N.b. the first 2 are commercial datasets.
Link: developers.google.com/earth-engine...
I've had experience with 3 flooding datasets:
• Fathom
• JBA Flood maps
• The Global Flood Database
N.b. the first 2 are commercial datasets.
Link: developers.google.com/earth-engine...

April 24, 2025 at 11:17 AM
5. Flooding
I've had experience with 3 flooding datasets:
• Fathom
• JBA Flood maps
• The Global Flood Database
N.b. the first 2 are commercial datasets.
Link: developers.google.com/earth-engine...
I've had experience with 3 flooding datasets:
• Fathom
• JBA Flood maps
• The Global Flood Database
N.b. the first 2 are commercial datasets.
Link: developers.google.com/earth-engine...
4. Temperature and precipitation
There are many datasets that provide temperature data like MOD11A1 and GCOM-C.
But my go-to resource is ERA5's Climate Reanalysis Dataset.
It provides daily global data on:
• wind
• temp
• precipitation
Link: developers.google.com/earth-engine...
There are many datasets that provide temperature data like MOD11A1 and GCOM-C.
But my go-to resource is ERA5's Climate Reanalysis Dataset.
It provides daily global data on:
• wind
• temp
• precipitation
Link: developers.google.com/earth-engine...

April 24, 2025 at 11:17 AM
4. Temperature and precipitation
There are many datasets that provide temperature data like MOD11A1 and GCOM-C.
But my go-to resource is ERA5's Climate Reanalysis Dataset.
It provides daily global data on:
• wind
• temp
• precipitation
Link: developers.google.com/earth-engine...
There are many datasets that provide temperature data like MOD11A1 and GCOM-C.
But my go-to resource is ERA5's Climate Reanalysis Dataset.
It provides daily global data on:
• wind
• temp
• precipitation
Link: developers.google.com/earth-engine...