


Andrew Urquhart
@wolfeagle1989.bsky.social
PhD in Space Physics. Hobbyist SARS-CoV-2 lineage hunter. I will block trolls, misinformers, and disinformers at my personal discretion.
Gandhi, The Lancet Infectious Diseases (2024), www.thelancet.com/journals/lan... summarizes the situation well. See the screenshot with this post or its alt text. 6/8

July 6, 2025 at 1:14 AM
Gandhi, The Lancet Infectious Diseases (2024), www.thelancet.com/journals/lan... summarizes the situation well. See the screenshot with this post or its alt text. 6/8
I put together a chart of XFG.2 as a fraction of samples from the NYU Langone Health and NYC Public Health labs in New York City. Note that the last data submitted was on June 6, and combined those labs so far have submitted only 2 samples collected on or after June 1.

June 17, 2025 at 3:46 PM
I put together a chart of XFG.2 as a fraction of samples from the NYU Langone Health and NYC Public Health labs in New York City. Note that the last data submitted was on June 6, and combined those labs so far have submitted only 2 samples collected on or after June 1.
Newsweek headline “Why Are So Many Children Getting Long COVID?” www.newsweek.com/why-are-so-m...
I’m old enough to remember when the general public was assured that COVID wouldn’t harm children. Apparently that assurance was false.
I’m old enough to remember when the general public was assured that COVID wouldn’t harm children. Apparently that assurance was false.


June 10, 2025 at 9:34 PM
Newsweek headline “Why Are So Many Children Getting Long COVID?” www.newsweek.com/why-are-so-m...
I’m old enough to remember when the general public was assured that COVID wouldn’t harm children. Apparently that assurance was false.
I’m old enough to remember when the general public was assured that COVID wouldn’t harm children. Apparently that assurance was false.
However, after multiple reinfections, a 30% Long COVID rate may be low especially after multiple infections. Kuang et al www150.statcan.gc.ca/n1/pub/75-00... reports 37% Long COVID after 3 or more infections. Carazo et al www.inspq.qc.ca/sites/defaul... finds near 50% after 4 or more infections. 2/3


June 2, 2025 at 12:29 PM
However, after multiple reinfections, a 30% Long COVID rate may be low especially after multiple infections. Kuang et al www150.statcan.gc.ca/n1/pub/75-00... reports 37% Long COVID after 3 or more infections. Carazo et al www.inspq.qc.ca/sites/defaul... finds near 50% after 4 or more infections. 2/3
As NB.1.8.1 “Nimbus” and XFG rise, people need to realize the risk of COVID-induced organ damage in all ages. This graphic is from Ewing et al, “Review of organ damage from COVID and Long COVID: a disease with a spectrum of pathology”, Medical Review (2024), www.degruyterbrill.com/document/doi....

May 31, 2025 at 5:49 PM
As NB.1.8.1 “Nimbus” and XFG rise, people need to realize the risk of COVID-induced organ damage in all ages. This graphic is from Ewing et al, “Review of organ damage from COVID and Long COVID: a disease with a spectrum of pathology”, Medical Review (2024), www.degruyterbrill.com/document/doi....
As NB.1.8.1 “Nimbus” and XFG rise, despite the gaslighting propaganda yes children can be impacted especially by post-acute illness. This graphic is from Gross et al, “Long COVID in Young Children, School-Aged Children, and Teens”, JAMA Pediatrics (2025), jamanetwork.com/journals/jam....

May 31, 2025 at 4:56 AM
As NB.1.8.1 “Nimbus” and XFG rise, despite the gaslighting propaganda yes children can be impacted especially by post-acute illness. This graphic is from Gross et al, “Long COVID in Young Children, School-Aged Children, and Teens”, JAMA Pediatrics (2025), jamanetwork.com/journals/jam....
A side note: Ben Murrell has new growth advantage forecasts as shown here in this screenshot from today of github.com/MurrellGroup.... XFG and NB.1.8.1 have similar growth advantages with XFJ and XFC trailing but not too far behind.

May 23, 2025 at 5:04 PM
A side note: Ben Murrell has new growth advantage forecasts as shown here in this screenshot from today of github.com/MurrellGroup.... XFG and NB.1.8.1 have similar growth advantages with XFJ and XFC trailing but not too far behind.
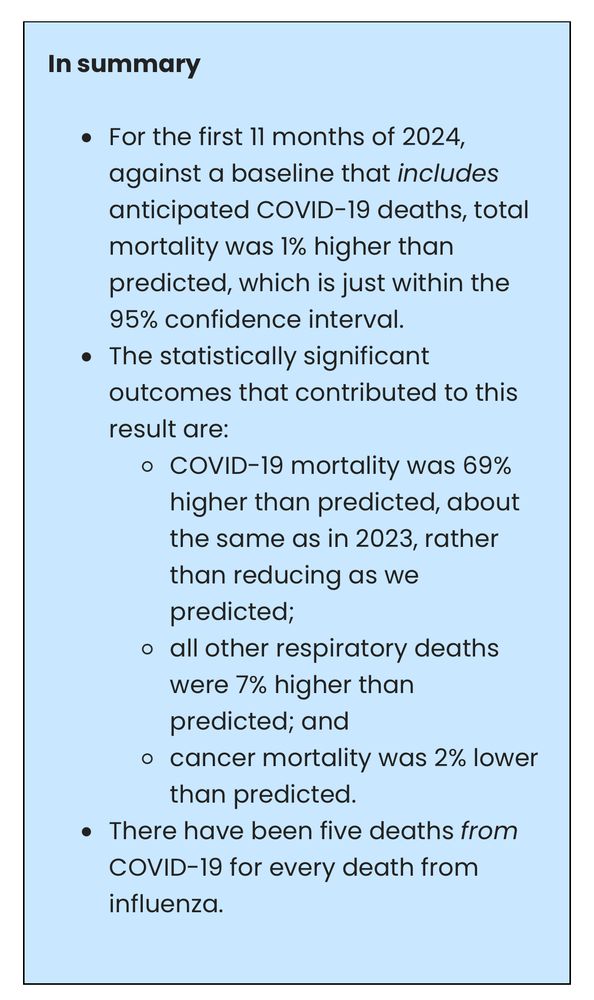
I went digging for new actuarial data on COVID-19, and I found this recent post from March 20, 2025. I think this applies specifically to Australia, but patterns may be similar elsewhere. www.actuaries.digital/2025/03/20/c...
March 28, 2025 at 3:24 AM
I went digging for new actuarial data on COVID-19, and I found this recent post from March 20, 2025. I think this applies specifically to Australia, but patterns may be similar elsewhere. www.actuaries.digital/2025/03/20/c...
LP.8.1 non-synonymous mutation differences from mid-2024 major lineages KP.2 and KP.3 with Bloom and Neher relative fitness estimates calculated for Clade 24A (JN.1). 1/6

March 23, 2025 at 4:52 PM
LP.8.1 non-synonymous mutation differences from mid-2024 major lineages KP.2 and KP.3 with Bloom and Neher relative fitness estimates calculated for Clade 24A (JN.1). 1/6
Rates of many Long COVID symptoms increase with increasing numbers of reinfections: Qin et al, “Long COVID facts and findings: a large-scale online survey in 74,075 Chinese participants”, The Lancet Regional Health Western Pacific, www.thelancet.com/journals/lan... 15/33

March 14, 2025 at 6:19 PM
Rates of many Long COVID symptoms increase with increasing numbers of reinfections: Qin et al, “Long COVID facts and findings: a large-scale online survey in 74,075 Chinese participants”, The Lancet Regional Health Western Pacific, www.thelancet.com/journals/lan... 15/33
Figure 5 of Bowe et al, “Acute and postacute sequelae associated with SARS-CoV-2 reinfection”, Nature Medicine, www.nature.com/articles/s41..., also burdens in text under heading “Cumulative risk and burden of one, two and three or more SARS-CoV-2 infections.” 14/33

March 14, 2025 at 6:18 PM
Figure 5 of Bowe et al, “Acute and postacute sequelae associated with SARS-CoV-2 reinfection”, Nature Medicine, www.nature.com/articles/s41..., also burdens in text under heading “Cumulative risk and burden of one, two and three or more SARS-CoV-2 infections.” 14/33
Chart 2 in Kuang et al, “Experiences of Canadians with long-term symptoms following COVID-19”, Insights on Canadian Society, www150.statcan.gc.ca/n1/pub/75-00... 13/33
March 14, 2025 at 6:18 PM
Chart 2 in Kuang et al, “Experiences of Canadians with long-term symptoms following COVID-19”, Insights on Canadian Society, www150.statcan.gc.ca/n1/pub/75-00... 13/33
Figure 7 in Carazo et al, “Affection Post-COVID-19 Chez le Personnel de la Santé du Québec: Fréquence, Evolution et Facteurs de Risque” (2024), www.inspq.qc.ca/publications..., www.inspq.qc.ca/sites/defaul... 12/33
March 14, 2025 at 6:17 PM
Figure 7 in Carazo et al, “Affection Post-COVID-19 Chez le Personnel de la Santé du Québec: Fréquence, Evolution et Facteurs de Risque” (2024), www.inspq.qc.ca/publications..., www.inspq.qc.ca/sites/defaul... 12/33
Screenshots of WasteWaterScan.org SARS-CoV-2 levels in the US Midwest today and yesterday. The US Midwest now shows lower.
Someone commented that the Missouri numbers may have been influenced by one Missouri site reporting high numbers with other sites missing. 1/2
Someone commented that the Missouri numbers may have been influenced by one Missouri site reporting high numbers with other sites missing. 1/2


December 20, 2024 at 6:04 PM
Screenshots of WasteWaterScan.org SARS-CoV-2 levels in the US Midwest today and yesterday. The US Midwest now shows lower.
Someone commented that the Missouri numbers may have been influenced by one Missouri site reporting high numbers with other sites missing. 1/2
Someone commented that the Missouri numbers may have been influenced by one Missouri site reporting high numbers with other sites missing. 1/2
Someone reminded me that Biobot is still reporting on COVID wastewater levels, so here’s a screenshot of their most recent report from biobot.io/risk-reports.... Probably due to differences in reporting stations, Biobot doesn’t show the strong increase in the US Midwest.

December 19, 2024 at 7:21 PM
Someone reminded me that Biobot is still reporting on COVID wastewater levels, so here’s a screenshot of their most recent report from biobot.io/risk-reports.... Probably due to differences in reporting stations, Biobot doesn’t show the strong increase in the US Midwest.
US West SARS-CoV-2 wastewater levels over the last 24 months ending December 19, 2024. 5/5

December 19, 2024 at 5:48 PM
US West SARS-CoV-2 wastewater levels over the last 24 months ending December 19, 2024. 5/5
US South SARS-CoV-2 wastewater levels over the last 24 months ending December 19, 2024. 4/5

December 19, 2024 at 5:47 PM
US South SARS-CoV-2 wastewater levels over the last 24 months ending December 19, 2024. 4/5
US Northeast SARS-CoV-2 wastewater levels over the last 24 months ending December 19, 2024. 3/5

December 19, 2024 at 5:46 PM
US Northeast SARS-CoV-2 wastewater levels over the last 24 months ending December 19, 2024. 3/5
US Midwest SARS-CoV-2 wastewater levels over the last 24 months ending December 19, 2024. 2/5

December 19, 2024 at 5:45 PM
US Midwest SARS-CoV-2 wastewater levels over the last 24 months ending December 19, 2024. 2/5
I’m seeing some debate over COVID levels in the US are high or low, so here’s a series of US nationwide and regional SARS-CoV-2 wastewater chart screenshots I just took from data.wastewaterscan.org. First, the US National chart. 1/5

December 19, 2024 at 5:43 PM
I’m seeing some debate over COVID levels in the US are high or low, so here’s a series of US nationwide and regional SARS-CoV-2 wastewater chart screenshots I just took from data.wastewaterscan.org. First, the US National chart. 1/5