


Wim Thiery
@wimthiery.bsky.social
Climate scientist modelling extreme events in a changing climate, Associate Professor @vubrussel.bsky.social. Previously research fellow @kuleuvenuniversity.bsky.social and @ethz.ch. Website: https://sites.google.com/site/wimthiery/
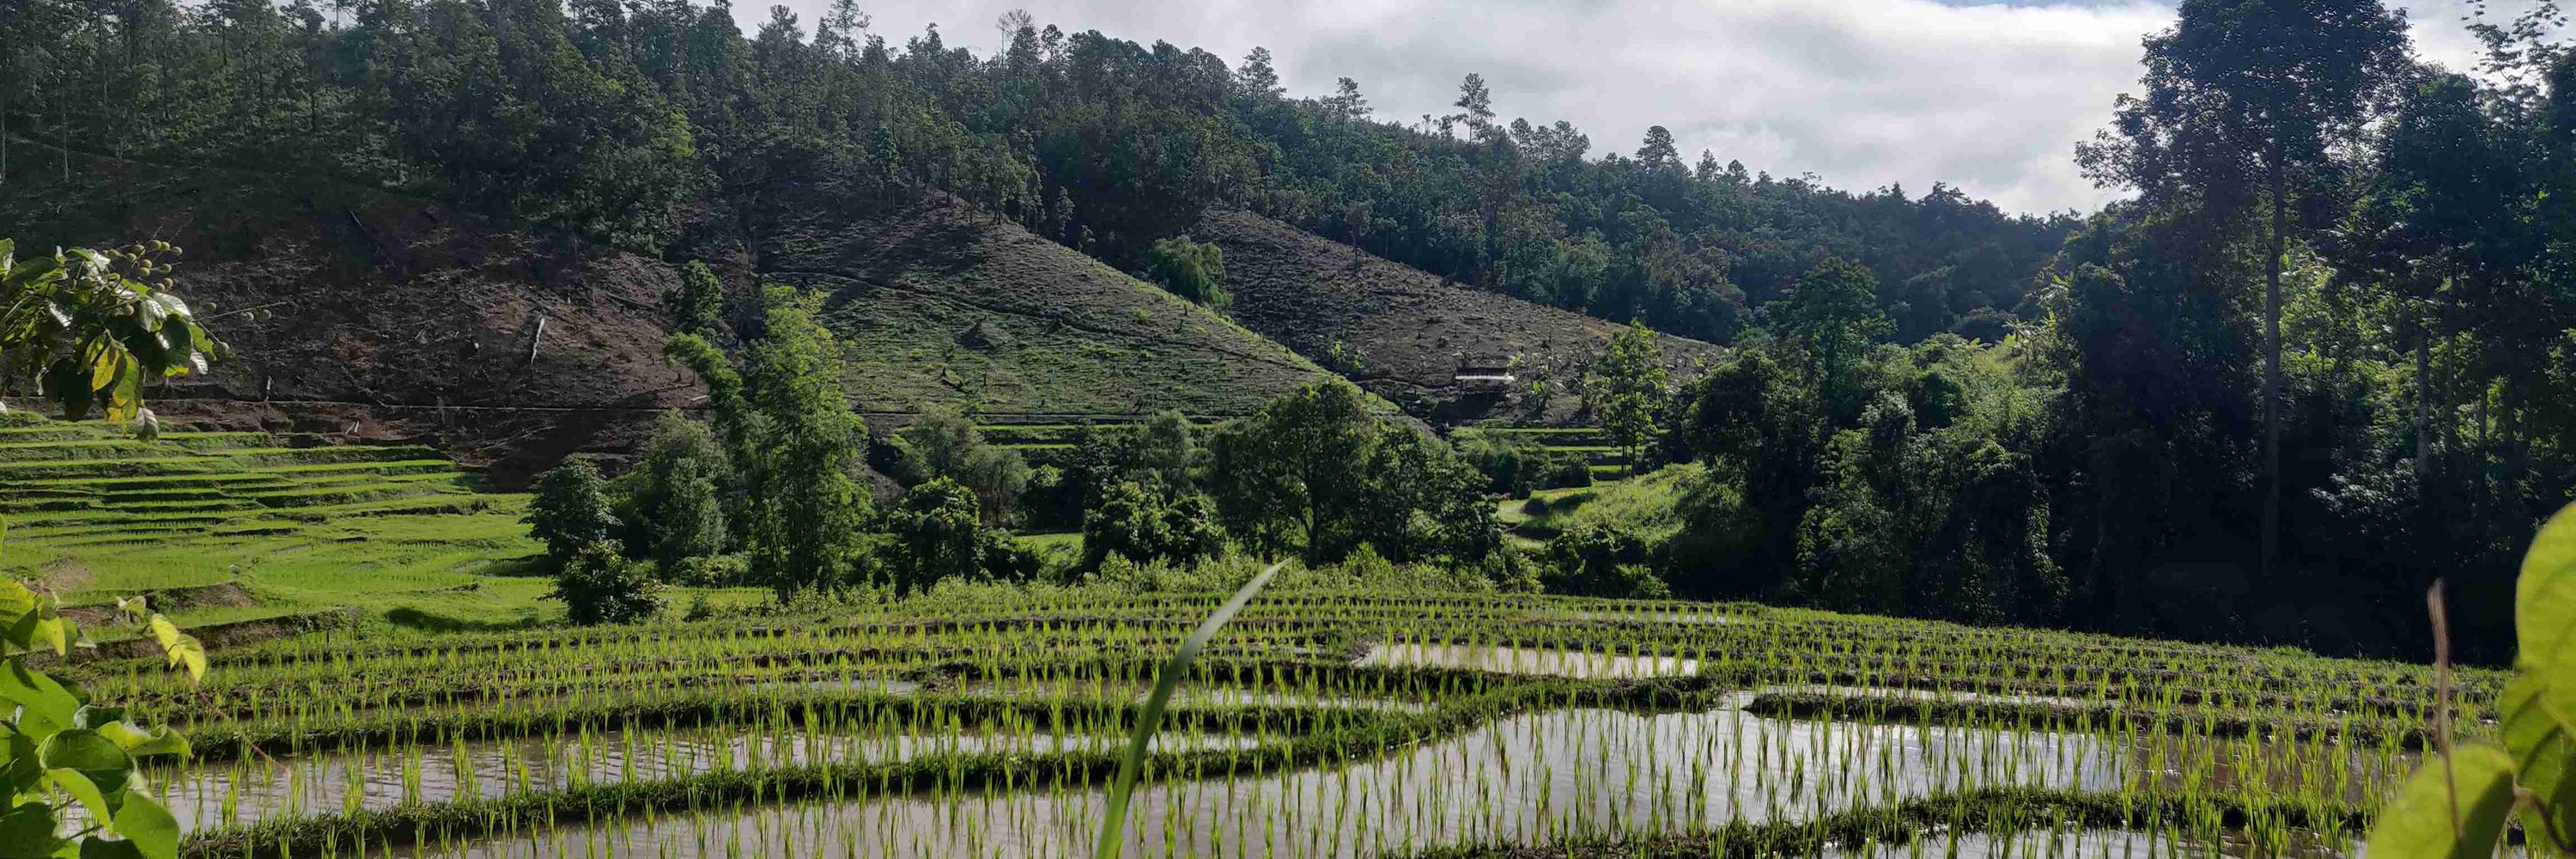
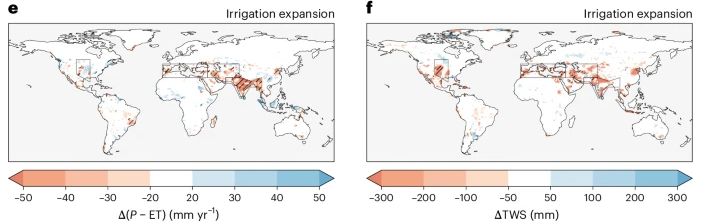
For example, irrigation expansion more then doubled the trend in water loss to the atmosphere (P-E) in South Asia after 1960. As a consequence, the local terrestrial water storage (TWS) depletes over time following irrigation expansion.
November 6, 2025 at 9:38 AM
For example, irrigation expansion more then doubled the trend in water loss to the atmosphere (P-E) in South Asia after 1960. As a consequence, the local terrestrial water storage (TWS) depletes over time following irrigation expansion.
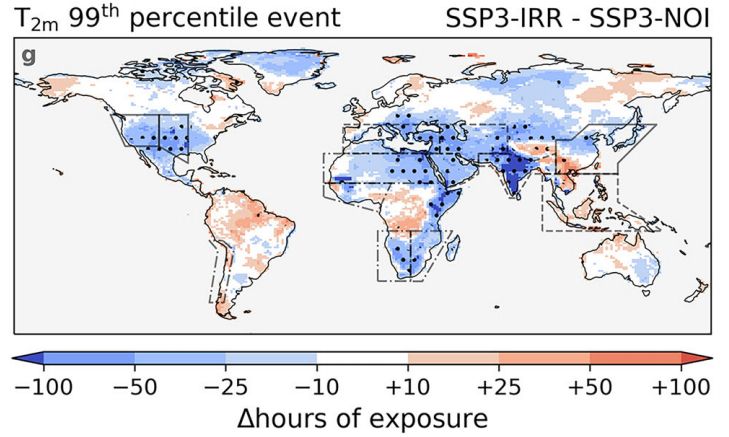
In contract, moist-heat extreme event frequency increases substantially due to irrigation (by ≥1600 h yr−1 under SSP3-7.0 in tropics), and irrigation amplifies the hours of exposure (by ≥100 h yr−1 in South Asia), raising the risk of moist-heat-related illnesses & mortality for exposed communities

October 31, 2025 at 8:46 AM
In contract, moist-heat extreme event frequency increases substantially due to irrigation (by ≥1600 h yr−1 under SSP3-7.0 in tropics), and irrigation amplifies the hours of exposure (by ≥100 h yr−1 in South Asia), raising the risk of moist-heat-related illnesses & mortality for exposed communities
Irrigation is projected to reduce the occurrence of dry-heat stress under both scenarios, but cannot reverse the warming trend due to greenhouse gas emissions
October 31, 2025 at 8:46 AM
Irrigation is projected to reduce the occurrence of dry-heat stress under both scenarios, but cannot reverse the warming trend due to greenhouse gas emissions
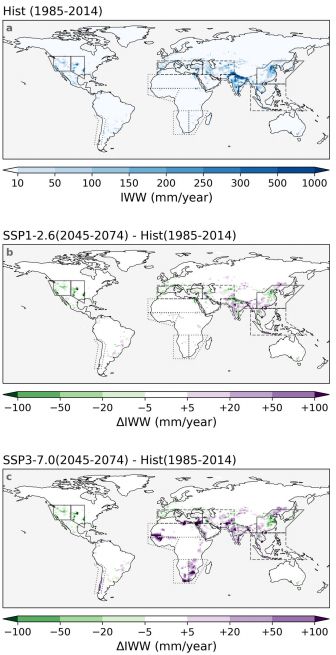
We project that annual irrigation water withdrawal decreases under SSP1-2.6 (from ~2100 to ~1700 km3 yr−1) but increases under SSP3-7.0 (to ~2400 km3 yr−1), with some new irrigation hot spots emerging, especially in Africa

October 31, 2025 at 8:46 AM
We project that annual irrigation water withdrawal decreases under SSP1-2.6 (from ~2100 to ~1700 km3 yr−1) but increases under SSP3-7.0 (to ~2400 km3 yr−1), with some new irrigation hot spots emerging, especially in Africa
Irrigation is an important historical climate forcing, but so far no study explored its future climatic impacts considering possible changes in both extent and efficiency.
We develop irrigation efficiency scenarios along the SSPs, implement these in CESM, and generate projections for 2015–2074.
We develop irrigation efficiency scenarios along the SSPs, implement these in CESM, and generate projections for 2015–2074.

October 31, 2025 at 8:46 AM
Irrigation is an important historical climate forcing, but so far no study explored its future climatic impacts considering possible changes in both extent and efficiency.
We develop irrigation efficiency scenarios along the SSPs, implement these in CESM, and generate projections for 2015–2074.
We develop irrigation efficiency scenarios along the SSPs, implement these in CESM, and generate projections for 2015–2074.
Lopende projectoproep voor interuniversitair wetenschappelijke onderzoek in Vlaanderen wordt geannuleerd als gevolg van besparingen Vlaamse regering.

September 29, 2025 at 6:50 AM
Lopende projectoproep voor interuniversitair wetenschappelijke onderzoek in Vlaanderen wordt geannuleerd als gevolg van besparingen Vlaamse regering.
In our new study led by Delphine Ramon in @ioppublishing.bsky.social, we project exposure to dangerous heat stress around Lake Victoria under a high-end scenario. By end of century, up to 122 million people may experience dangerous heat stress for more than 5% of the year doi.org/10.1088/1748...

September 26, 2025 at 9:20 PM
In our new study led by Delphine Ramon in @ioppublishing.bsky.social, we project exposure to dangerous heat stress around Lake Victoria under a high-end scenario. By end of century, up to 122 million people may experience dangerous heat stress for more than 5% of the year doi.org/10.1088/1748...
Open access article by Quilcaille et al., 2025 now out in print: www.nature.com/nature/volum...

September 18, 2025 at 1:02 PM
Open access article by Quilcaille et al., 2025 now out in print: www.nature.com/nature/volum...
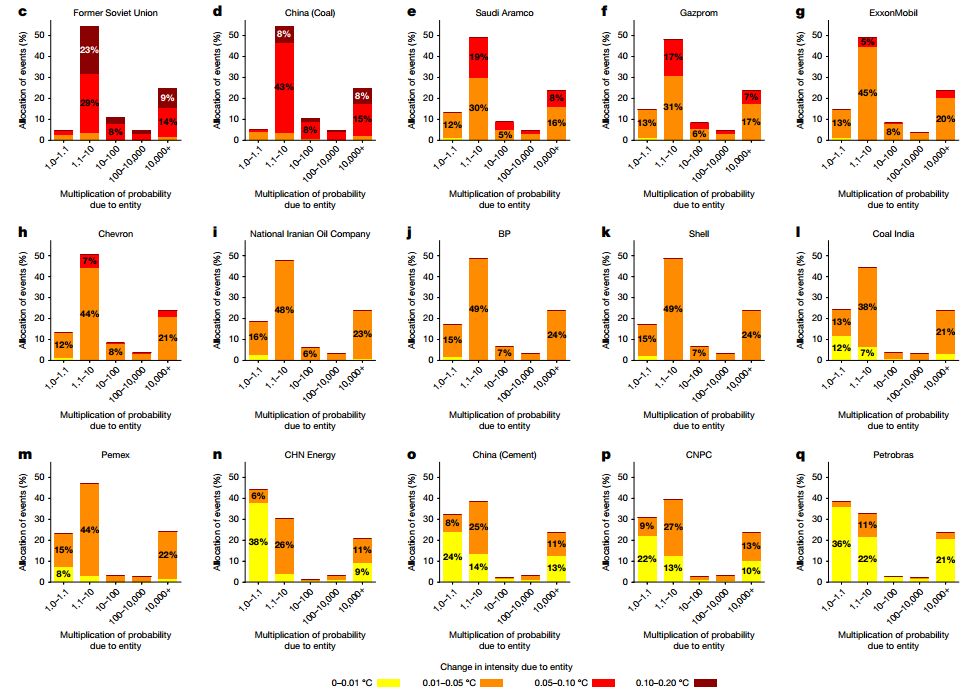
Each of the carbon majors has a discernible influence on these impactful heatwaves. With reference to 1850–1900, climate change has increased the median intensity of heatwaves by 1.68 °C over 2010–2019, of which 0.47 °C is traced back to the 14 top carbon majors and 0.38 °C to the 166 others.
September 10, 2025 at 6:54 PM
Each of the carbon majors has a discernible influence on these impactful heatwaves. With reference to 1850–1900, climate change has increased the median intensity of heatwaves by 1.68 °C over 2010–2019, of which 0.47 °C is traced back to the 14 top carbon majors and 0.38 °C to the 166 others.
In a next step, we employ the carbonmajors.org database to quantify the contribution of each of the 180 carbon majors to (i) global mean temperature, and (ii) the probability and intensity of each of the 213 heatwaves.

September 10, 2025 at 6:54 PM
In a next step, we employ the carbonmajors.org database to quantify the contribution of each of the 180 carbon majors to (i) global mean temperature, and (ii) the probability and intensity of each of the 213 heatwaves.
The imprint of climate change rapidly rises over time: according to the median probability ratio, it made heatwaves around 20 times more likely between 2000 and 2009... and around 200 times more likely between 2010 and 2019.

September 10, 2025 at 6:54 PM
The imprint of climate change rapidly rises over time: according to the median probability ratio, it made heatwaves around 20 times more likely between 2000 and 2009... and around 200 times more likely between 2010 and 2019.
We use a well-established extreme event attribution method from www.worldweatherattribution.org to compute the change in frequency & intensity of each of these heatwaves. Man-made climate change made each of them worse, & for a quarter of them, the probability increased by at least a factor 10 000.

September 10, 2025 at 6:54 PM
We use a well-established extreme event attribution method from www.worldweatherattribution.org to compute the change in frequency & intensity of each of these heatwaves. Man-made climate change made each of them worse, & for a quarter of them, the probability increased by at least a factor 10 000.
"De klimaatopwarming aan de wortel aanpakken, is kortom dé manier om de levenskwaliteit in de steden te blijven garanderen. Net daarom scharen heel wat burgemeesters zich wél achter het akkoord van Parijs uit 2015." Zij weten dat dit de beste bescherming is voor de bevolking in hun steden
July 2, 2025 at 3:24 PM
"De klimaatopwarming aan de wortel aanpakken, is kortom dé manier om de levenskwaliteit in de steden te blijven garanderen. Net daarom scharen heel wat burgemeesters zich wél achter het akkoord van Parijs uit 2015." Zij weten dat dit de beste bescherming is voor de bevolking in hun steden
In the absence of global climate mitigation, we project a regime shift to a world dominated by compound hazards or impacts. In our new paper by Gabriele Messori, we find that compound hazard occurrences will become the norm in many regions under RCP6.0 agupubs.onlinelibrary.wiley.com/doi/10.1029/...

June 13, 2025 at 10:16 PM
In the absence of global climate mitigation, we project a regime shift to a world dominated by compound hazards or impacts. In our new paper by Gabriele Messori, we find that compound hazard occurrences will become the norm in many regions under RCP6.0 agupubs.onlinelibrary.wiley.com/doi/10.1029/...
A news article in @nature.com provides more information about the study:
www.nature.com/articles/d41...
24/n
www.nature.com/articles/d41...
24/n

May 12, 2025 at 10:54 AM
A news article in @nature.com provides more information about the study:
www.nature.com/articles/d41...
24/n
www.nature.com/articles/d41...
24/n
Working with @savethechildren.org on the 'Born Into The Climate Crisis 2' report has been a wonderful experience. And the front cover inspired by @edhawkins.org warming stripes clearly show that what is at stake today is the safety of current (young) generations, not just future ones. 18/n

May 12, 2025 at 10:54 AM
Working with @savethechildren.org on the 'Born Into The Climate Crisis 2' report has been a wonderful experience. And the front cover inspired by @edhawkins.org warming stripes clearly show that what is at stake today is the safety of current (young) generations, not just future ones. 18/n
The @savethechildren.org report builds on our scientific article and explicitly includes vulnerability. The report provides compelling text, visuals, and testimonies and calls for ambitious climate action at COP30. 17/n
resourcecentre.savethechildren.net/document/bor...
resourcecentre.savethechildren.net/document/bor...

May 12, 2025 at 10:54 AM
The @savethechildren.org report builds on our scientific article and explicitly includes vulnerability. The report provides compelling text, visuals, and testimonies and calls for ambitious climate action at COP30. 17/n
resourcecentre.savethechildren.net/document/bor...
resourcecentre.savethechildren.net/document/bor...
This highlights two critical inequalities linked to impacts of climate change: the intergenerational inequality and the socioeconomic inequality. 16/n

May 12, 2025 at 10:54 AM
This highlights two critical inequalities linked to impacts of climate change: the intergenerational inequality and the socioeconomic inequality. 16/n
We introduce climate change into the age pyramid, and find that in each birth cohort and under current policies, the 20% most deprived run significantly higher risk of unprecedented lifetime heatwave exposure compared to the 20% least deprived. 15/n

May 12, 2025 at 10:54 AM
We introduce climate change into the age pyramid, and find that in each birth cohort and under current policies, the 20% most deprived run significantly higher risk of unprecedented lifetime heatwave exposure compared to the 20% least deprived. 15/n
Finally, you may remember this type of graph from high school. This is the age pyramid, it displays the age structure of a population. 14/n

May 12, 2025 at 10:54 AM
Finally, you may remember this type of graph from high school. This is the age pyramid, it displays the age structure of a population. 14/n
Millions of children will be spared form unprecedented lifetime exposure to heatwaves, crop failures, river floods, tropical cyclones, wildfires, and droughts if climate action ramps up and global warming is limited to 1.5°C. And these are the numbers for just one single birth year! 13/n

May 12, 2025 at 10:54 AM
Millions of children will be spared form unprecedented lifetime exposure to heatwaves, crop failures, river floods, tropical cyclones, wildfires, and droughts if climate action ramps up and global warming is limited to 1.5°C. And these are the numbers for just one single birth year! 13/n
Young children run the highest risk of facing unprecedented lifetime exposure to heatwaves (93% of children born in 2020 under 3.5°C), followed by crop failures (~30%) and river floods (~15%). This implies that one single person can face this risk for *multiple* climate extremes. 12/n

May 12, 2025 at 10:54 AM
Young children run the highest risk of facing unprecedented lifetime exposure to heatwaves (93% of children born in 2020 under 3.5°C), followed by crop failures (~30%) and river floods (~15%). This implies that one single person can face this risk for *multiple* climate extremes. 12/n
Heatwaves are just one of many extreme weather and climate events that escalate with global warming. Therefore, we performed this analysis for a total of 6 climate extremes. 11/n

May 12, 2025 at 10:54 AM
Heatwaves are just one of many extreme weather and climate events that escalate with global warming. Therefore, we performed this analysis for a total of 6 climate extremes. 11/n
Spatially, children in (sub-)tropical climates are relatively worse off under a Paris-compatible warming pathway. Under higher warming pathways, this spatial pattern disappears as nearly all children everywhere face unprecedented lifetime heatwave exposure. 10/n

May 12, 2025 at 10:54 AM
Spatially, children in (sub-)tropical climates are relatively worse off under a Paris-compatible warming pathway. Under higher warming pathways, this spatial pattern disappears as nearly all children everywhere face unprecedented lifetime heatwave exposure. 10/n
We find that 37% of children born in 2020 can be protected from unprecedented lifetime exposure to extreme heatwaves if global warming is kept to 1.5°C above pre-industrial instead of the 2.7°C expected form current climate policies. 9/n

May 12, 2025 at 10:54 AM
We find that 37% of children born in 2020 can be protected from unprecedented lifetime exposure to extreme heatwaves if global warming is kept to 1.5°C above pre-industrial instead of the 2.7°C expected form current climate policies. 9/n