

World Inequality Lab
@wid.world
Illuminating the debate through data-driven research #inequalitydata✨
Hosting the World Inequality Database🌐 https://wid.world/
https://inequalitylab.world/en/
Hosting the World Inequality Database🌐 https://wid.world/
https://inequalitylab.world/en/
[4/5] European coal mines are mostly domestically owned, while over 30% of owners in Sub-Saharan Africa are based in other regions, often unidentifiable.

November 11, 2025 at 10:28 AM
[4/5] European coal mines are mostly domestically owned, while over 30% of owners in Sub-Saharan Africa are based in other regions, often unidentifiable.
[3/5] Ownership of fossil fuel investments reflects global wealth inequality and shows new forms of colonial-style extraction.

November 11, 2025 at 10:28 AM
[3/5] Ownership of fossil fuel investments reflects global wealth inequality and shows new forms of colonial-style extraction.
[2/5] Despite global climate pledges, global capital flowing into fossil fuel projects still amounts to approximately USD 1.1 trillion - about one third of total energy investments.

November 11, 2025 at 10:28 AM
[2/5] Despite global climate pledges, global capital flowing into fossil fuel projects still amounts to approximately USD 1.1 trillion - about one third of total energy investments.
🟢 Planned new oil, gas, and coal extraction alone could exhaust the 1.7°C carbon budget — This is one of the key findings presented in *Chapter 1.2 of the 2025 #ClimateInequality Report* outlining the scale of ongoing investments projects.
Read more in this thread [1/5]🧵
Read more in this thread [1/5]🧵

November 11, 2025 at 10:28 AM
🟢 Planned new oil, gas, and coal extraction alone could exhaust the 1.7°C carbon budget — This is one of the key findings presented in *Chapter 1.2 of the 2025 #ClimateInequality Report* outlining the scale of ongoing investments projects.
Read more in this thread [1/5]🧵
Read more in this thread [1/5]🧵
Because fossil fuel companies often have complex transnational corporate structures, it’s hard to know who really owns them. This lack of transparency also makes it difficult to enforce effective regulation.
[5/6]
[5/6]

November 3, 2025 at 11:14 AM
Because fossil fuel companies often have complex transnational corporate structures, it’s hard to know who really owns them. This lack of transparency also makes it difficult to enforce effective regulation.
[5/6]
[5/6]
Decarbonizing at home, burning fuel abroad?
Ownership of fossil fuel investments reflects global wealth inequality and shows new forms of colonial-style extraction.
[4/6]
Ownership of fossil fuel investments reflects global wealth inequality and shows new forms of colonial-style extraction.
[4/6]

November 3, 2025 at 11:14 AM
Decarbonizing at home, burning fuel abroad?
Ownership of fossil fuel investments reflects global wealth inequality and shows new forms of colonial-style extraction.
[4/6]
Ownership of fossil fuel investments reflects global wealth inequality and shows new forms of colonial-style extraction.
[4/6]
Despite global climate pledges, global capital flowing into fossil fuel projects still amounts to approximately USD 1.1 trillion - about one third of total energy investments.
[3/6]
[3/6]
November 3, 2025 at 11:14 AM
Despite global climate pledges, global capital flowing into fossil fuel projects still amounts to approximately USD 1.1 trillion - about one third of total energy investments.
[3/6]
[3/6]
🟢Wealthy individuals fuel the climate crisis through their investments even more than through their consumption and lifestyles — This is one of the key findings presented in *Chapter 1 of the 2025 #ClimateInequality Report*.
Read more in this thread [1/6]🧵
Read more in this thread [1/6]🧵

November 3, 2025 at 11:14 AM
🟢Wealthy individuals fuel the climate crisis through their investments even more than through their consumption and lifestyles — This is one of the key findings presented in *Chapter 1 of the 2025 #ClimateInequality Report*.
Read more in this thread [1/6]🧵
Read more in this thread [1/6]🧵
🔭 Projections of private & public wealth inequality under different ownership scenarios for climate-related investments. ⚠️The top 1% could see their share of world wealth jump from 38% to 46% by 2050 if they own tomorrow’s low-carbon assets.
#ClimateInequality Report 2025
#ClimateInequality Report 2025

October 29, 2025 at 7:51 AM
🔭 Projections of private & public wealth inequality under different ownership scenarios for climate-related investments. ⚠️The top 1% could see their share of world wealth jump from 38% to 46% by 2050 if they own tomorrow’s low-carbon assets.
#ClimateInequality Report 2025
#ClimateInequality Report 2025
📊 New estimates on the emissions of global wealth groups — using a private ownership-based approach that links emissions from productive assets directly to the owners of firms, not just consumers.
#ClimateInequality Report 2025 #inequalitydata
#ClimateInequality Report 2025 #inequalitydata

October 29, 2025 at 7:51 AM
📊 New estimates on the emissions of global wealth groups — using a private ownership-based approach that links emissions from productive assets directly to the owners of firms, not just consumers.
#ClimateInequality Report 2025 #inequalitydata
#ClimateInequality Report 2025 #inequalitydata
Want to #TaxTheRich? Try the 2025 version of the Global #WealthTax Simulator 🎛️
✔️Select any region/country or the world as a whole
✔️Input your preferred tax rates
✔️Adjust depreciation or tax evasion parameters
✔️See how much revenue you'd raise
▶️ wid.world/world-wealth...
We tested with France 👇🇫🇷
✔️Select any region/country or the world as a whole
✔️Input your preferred tax rates
✔️Adjust depreciation or tax evasion parameters
✔️See how much revenue you'd raise
▶️ wid.world/world-wealth...
We tested with France 👇🇫🇷
August 19, 2025 at 7:56 AM
Want to #TaxTheRich? Try the 2025 version of the Global #WealthTax Simulator 🎛️
✔️Select any region/country or the world as a whole
✔️Input your preferred tax rates
✔️Adjust depreciation or tax evasion parameters
✔️See how much revenue you'd raise
▶️ wid.world/world-wealth...
We tested with France 👇🇫🇷
✔️Select any region/country or the world as a whole
✔️Input your preferred tax rates
✔️Adjust depreciation or tax evasion parameters
✔️See how much revenue you'd raise
▶️ wid.world/world-wealth...
We tested with France 👇🇫🇷
We've updated wpid.world to cover recent trends in political polarization around the world! 🌍
Among striking results, the 2024 U.S. election saw educational divides that are unprecedented in modern history 👇
explore.wpid.world/intime/educ/vo
Among striking results, the 2024 U.S. election saw educational divides that are unprecedented in modern history 👇
explore.wpid.world/intime/educ/vo

August 6, 2025 at 7:47 AM
We've updated wpid.world to cover recent trends in political polarization around the world! 🌍
Among striking results, the 2024 U.S. election saw educational divides that are unprecedented in modern history 👇
explore.wpid.world/intime/educ/vo
Among striking results, the 2024 U.S. election saw educational divides that are unprecedented in modern history 👇
explore.wpid.world/intime/educ/vo
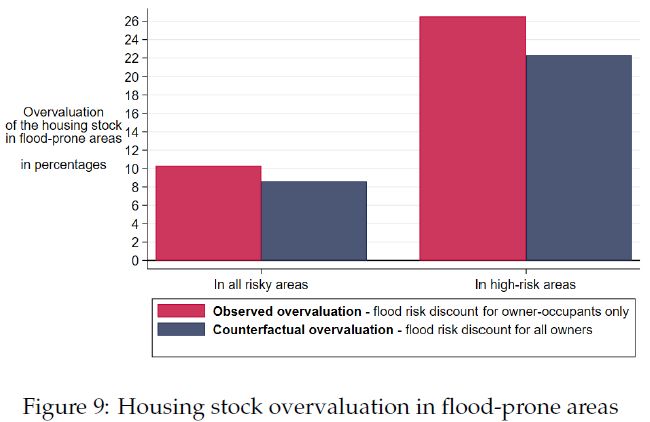
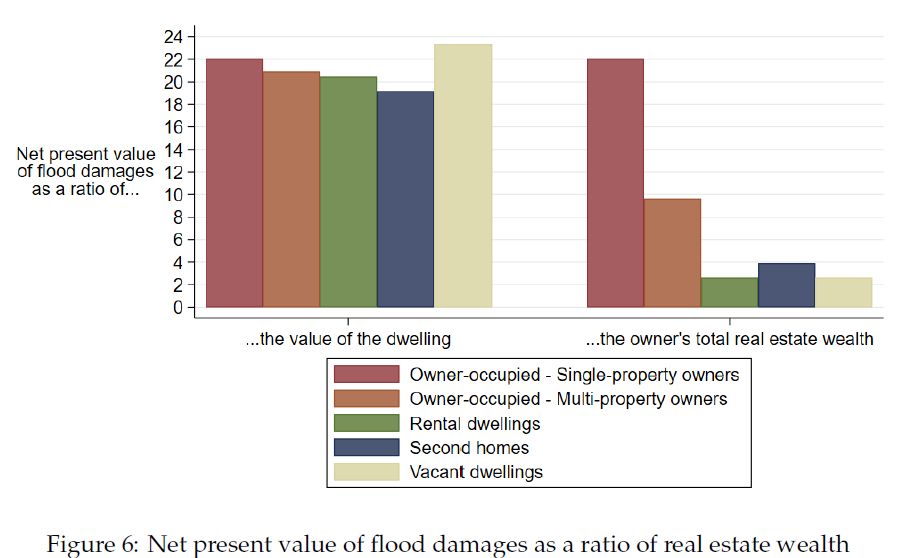
Unlike owner-occupants, owners of rental, second, and vacant homes don’t factor natural disaster risks into prices.
Absentee landlords own about half of all homes in flood-risk areas.
Overvaluation in flood zones would drop at least 15% if these properties were priced like owner-occupied ones.
[5/6]
Absentee landlords own about half of all homes in flood-risk areas.
Overvaluation in flood zones would drop at least 15% if these properties were priced like owner-occupied ones.
[5/6]
July 17, 2025 at 6:51 AM
Unlike owner-occupants, owners of rental, second, and vacant homes don’t factor natural disaster risks into prices.
Absentee landlords own about half of all homes in flood-risk areas.
Overvaluation in flood zones would drop at least 15% if these properties were priced like owner-occupied ones.
[5/6]
Absentee landlords own about half of all homes in flood-risk areas.
Overvaluation in flood zones would drop at least 15% if these properties were priced like owner-occupied ones.
[5/6]
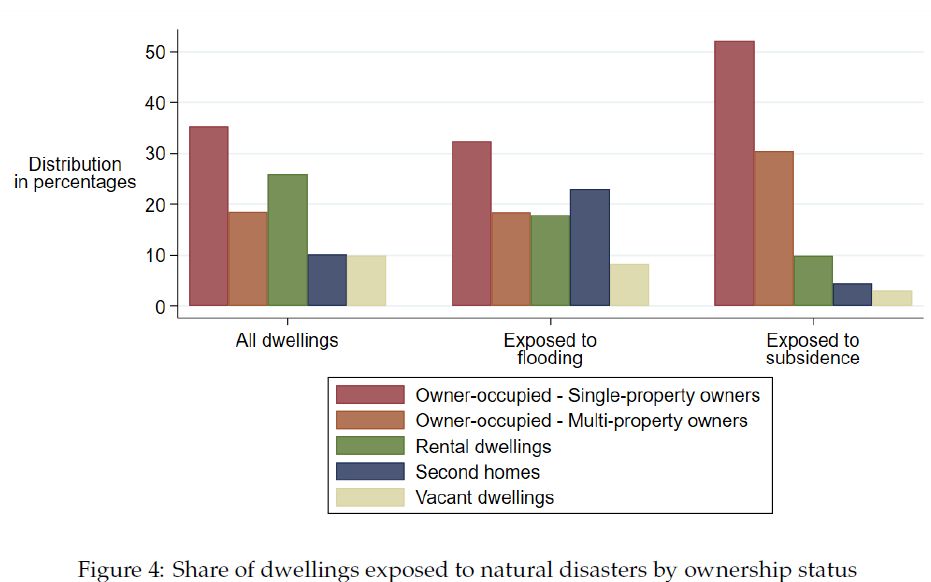
🔸Owner-occupied homes owned by middle income households are more exposed to subsidence.
🔹Second homes often owned by wealthy and diversified households are particularly exposed to flooding.
[3/6]
🔹Second homes often owned by wealthy and diversified households are particularly exposed to flooding.
[3/6]
July 17, 2025 at 6:51 AM
🔸Owner-occupied homes owned by middle income households are more exposed to subsidence.
🔹Second homes often owned by wealthy and diversified households are particularly exposed to flooding.
[3/6]
🔹Second homes often owned by wealthy and diversified households are particularly exposed to flooding.
[3/6]
Single-property owners are highly vulnerable with flood damages representing on average 20% of their total real estate wealth.
Owners of rental, second, or vacant properties are the least vulnerable households, flood damages amounting to just about 3% of their real estate wealth.
[2/6]
Owners of rental, second, or vacant properties are the least vulnerable households, flood damages amounting to just about 3% of their real estate wealth.
[2/6]
July 17, 2025 at 6:51 AM
Single-property owners are highly vulnerable with flood damages representing on average 20% of their total real estate wealth.
Owners of rental, second, or vacant properties are the least vulnerable households, flood damages amounting to just about 3% of their real estate wealth.
[2/6]
Owners of rental, second, or vacant properties are the least vulnerable households, flood damages amounting to just about 3% of their real estate wealth.
[2/6]
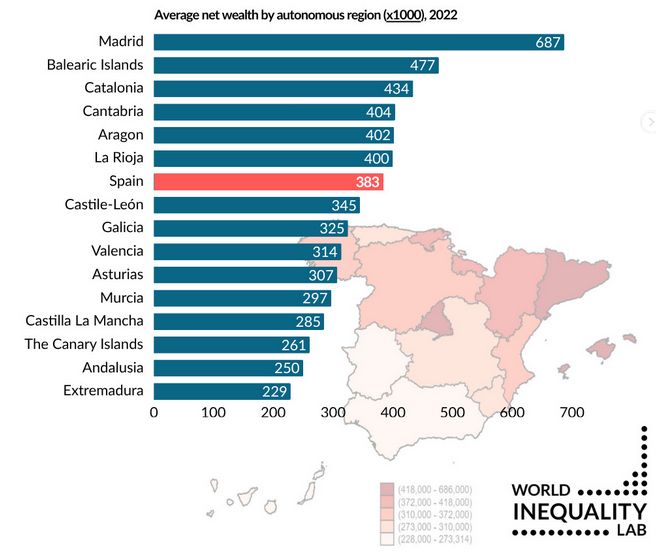
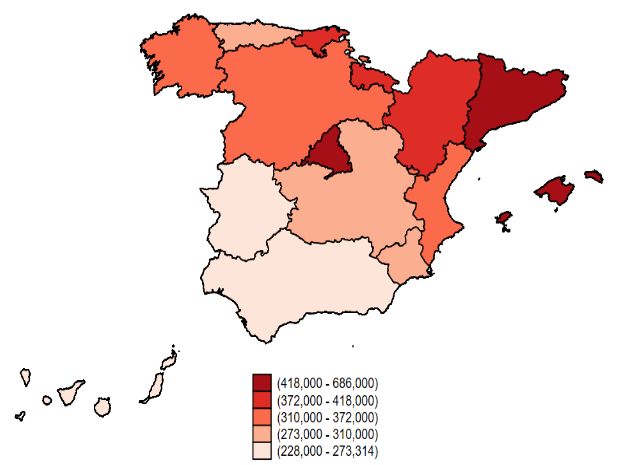
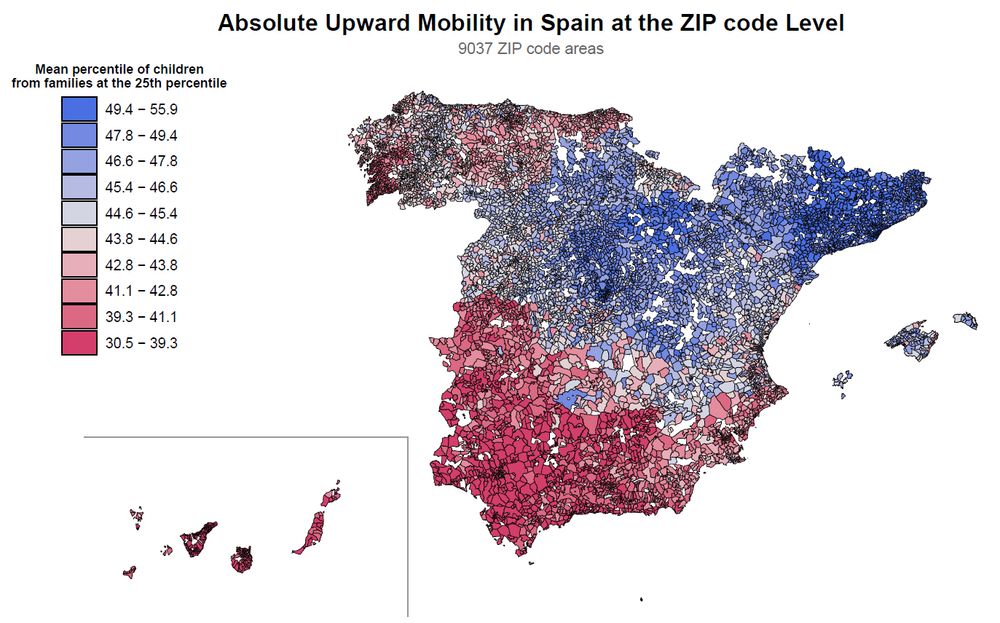
In Spain, there is a clear North/South wealth divide.
Madrid stands out for having the highest average wealth levels (€687,000 per household), ≈ 80% > national average.
[5/5]
Madrid stands out for having the highest average wealth levels (€687,000 per household), ≈ 80% > national average.
[5/5]
June 26, 2025 at 10:49 AM
In Spain, there is a clear North/South wealth divide.
Madrid stands out for having the highest average wealth levels (€687,000 per household), ≈ 80% > national average.
[5/5]
Madrid stands out for having the highest average wealth levels (€687,000 per household), ≈ 80% > national average.
[5/5]
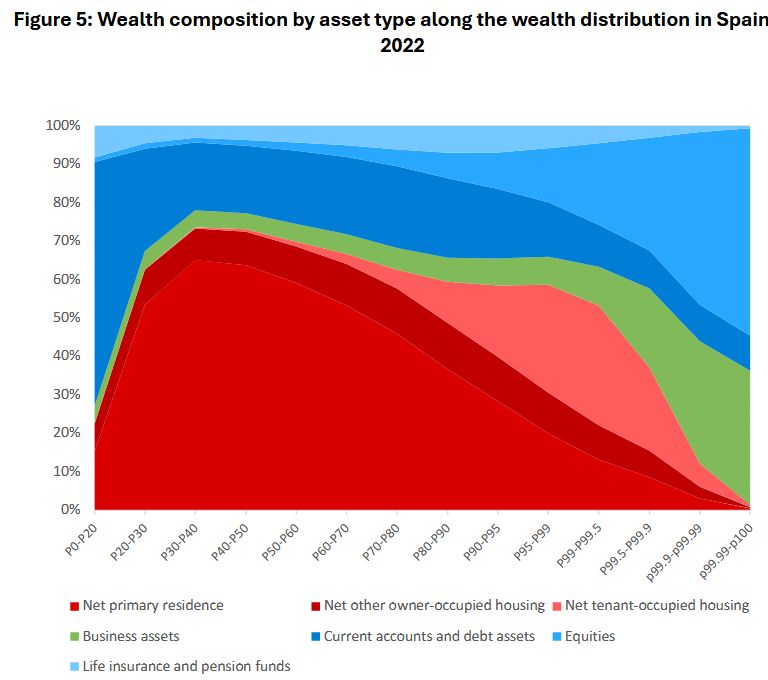
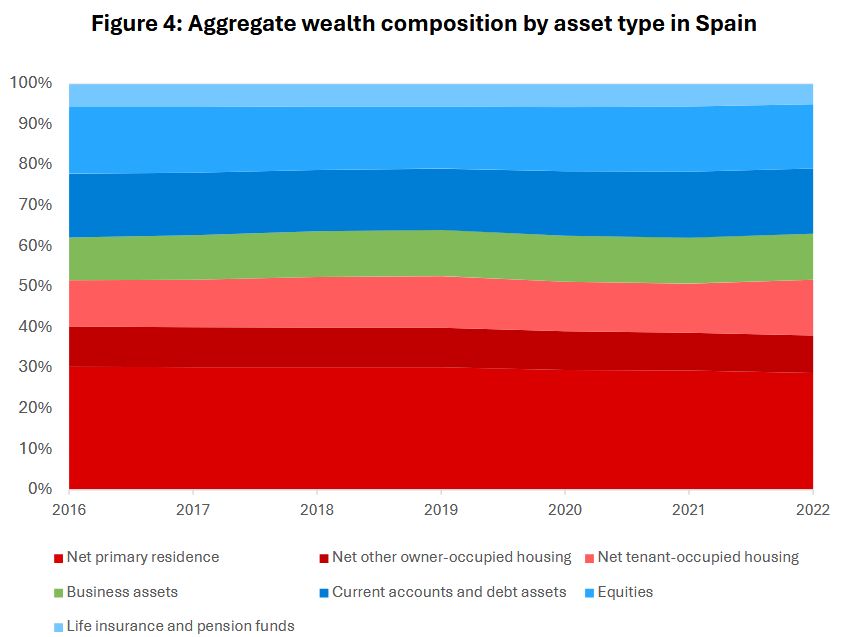
The asset portfolio changes a lot depending on the wealth level of households:
🔹For the bottom 20%, current accounts are the most relevant asset, ≈ 60% of their portfolio.
🔹For the top 10%, investment properties, business assets, and especially equities and investment funds are more important.
[4/5]
🔹For the bottom 20%, current accounts are the most relevant asset, ≈ 60% of their portfolio.
🔹For the top 10%, investment properties, business assets, and especially equities and investment funds are more important.
[4/5]
June 26, 2025 at 10:49 AM
The asset portfolio changes a lot depending on the wealth level of households:
🔹For the bottom 20%, current accounts are the most relevant asset, ≈ 60% of their portfolio.
🔹For the top 10%, investment properties, business assets, and especially equities and investment funds are more important.
[4/5]
🔹For the bottom 20%, current accounts are the most relevant asset, ≈ 60% of their portfolio.
🔹For the top 10%, investment properties, business assets, and especially equities and investment funds are more important.
[4/5]
Real estate assets dominate household wealth across most of Spain, accounting for just over 50% of the total.
Primary residences alone account for over 30%.
[3/5]
Primary residences alone account for over 30%.
[3/5]
June 26, 2025 at 10:49 AM
Real estate assets dominate household wealth across most of Spain, accounting for just over 50% of the total.
Primary residences alone account for over 30%.
[3/5]
Primary residences alone account for over 30%.
[3/5]
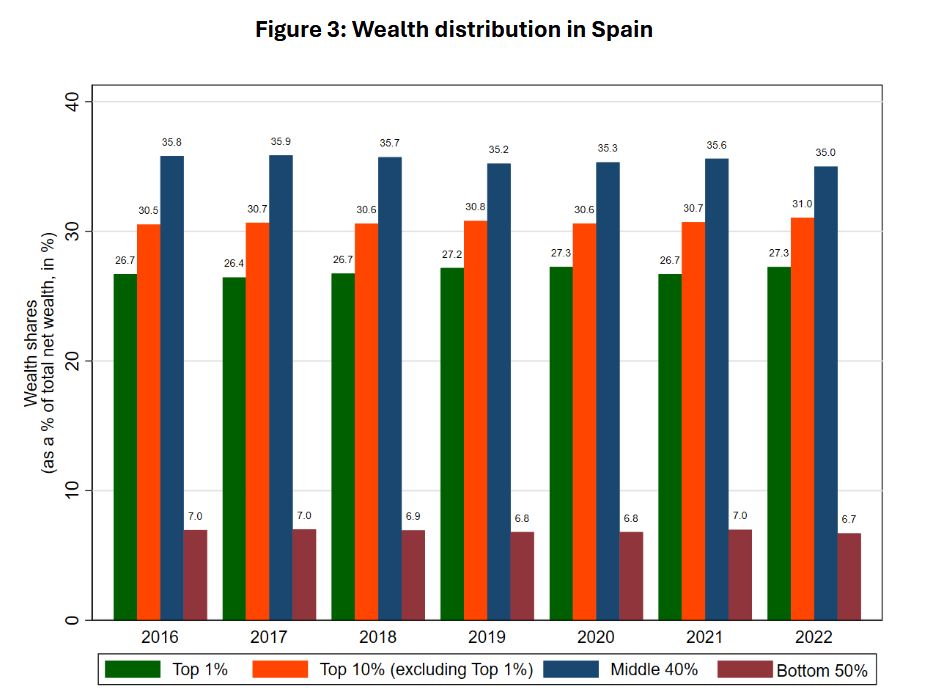
In Spain, like everywhere in the world, wealth distribution is much more unequal than income.
The top 1% accumulates a quarter of the wealth; the top 10%, 60%.
This is more or less in line with neighboring countries.
[3/5]
The top 1% accumulates a quarter of the wealth; the top 10%, 60%.
This is more or less in line with neighboring countries.
[3/5]
June 26, 2025 at 10:49 AM
In Spain, like everywhere in the world, wealth distribution is much more unequal than income.
The top 1% accumulates a quarter of the wealth; the top 10%, 60%.
This is more or less in line with neighboring countries.
[3/5]
The top 1% accumulates a quarter of the wealth; the top 10%, 60%.
This is more or less in line with neighboring countries.
[3/5]
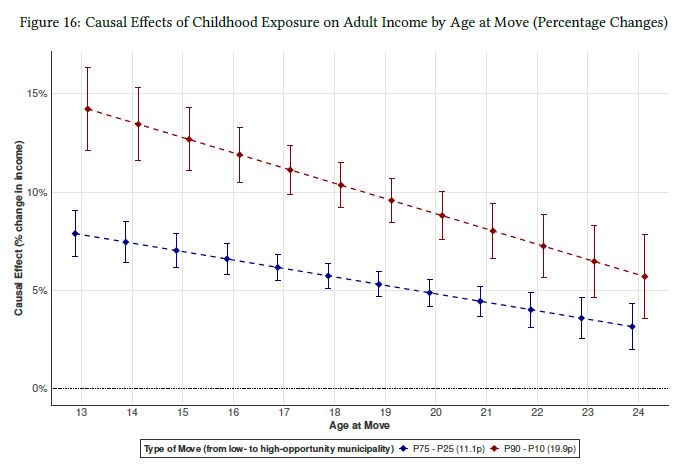
Children who move at age 13 with their families from a low-opportunity to a high-opportunity area experience a causal effect of around 14% on their adulthood income compared to similar children who do not move.
[6/7]
[6/7]
June 18, 2025 at 2:10 PM
Children who move at age 13 with their families from a low-opportunity to a high-opportunity area experience a causal effect of around 14% on their adulthood income compared to similar children who do not move.
[6/7]
[6/7]
Causal effects of growing up in a better neighborhood explain almost 60% of the geographic variation in upward mobility rates.
[5/7]
[5/7]
June 18, 2025 at 2:10 PM
Causal effects of growing up in a better neighborhood explain almost 60% of the geographic variation in upward mobility rates.
[5/7]
[5/7]
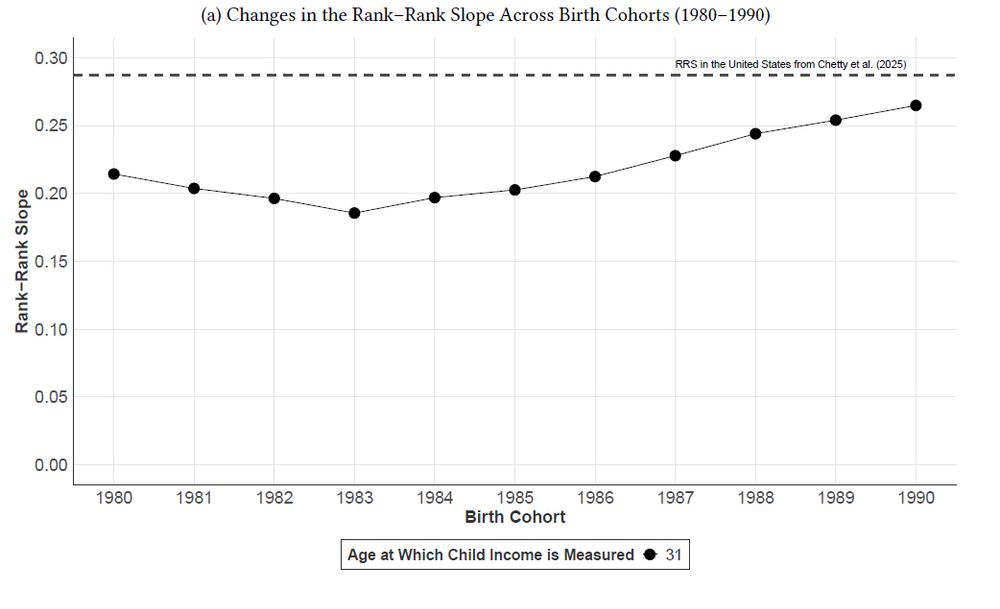
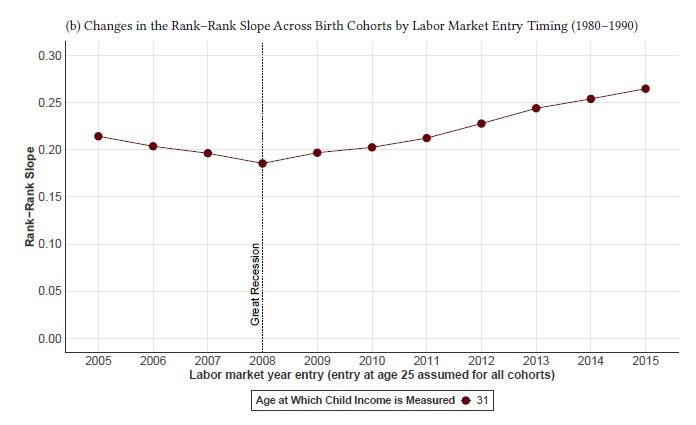
Intergenerational mobility has declined between people born in the early 1980s and those born in the early 1990s.
The 2008 economic crisis hit young people from poorer families especially hard when they entered the job market.
[4/7]
The 2008 economic crisis hit young people from poorer families especially hard when they entered the job market.
[4/7]
June 18, 2025 at 2:10 PM
Intergenerational mobility has declined between people born in the early 1980s and those born in the early 1990s.
The 2008 economic crisis hit young people from poorer families especially hard when they entered the job market.
[4/7]
The 2008 economic crisis hit young people from poorer families especially hard when they entered the job market.
[4/7]
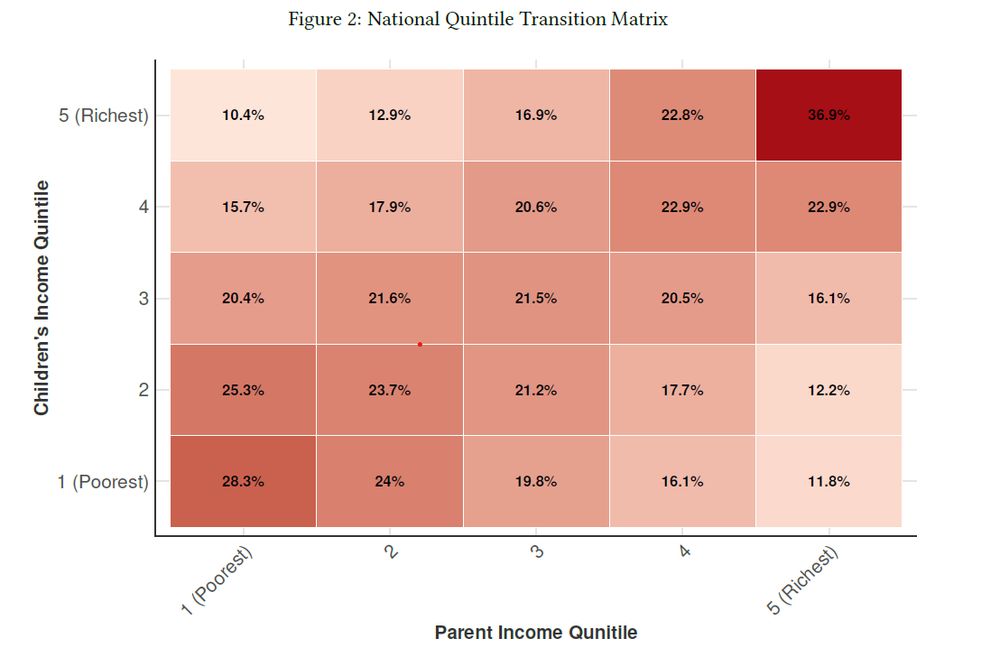
Spain ranks in the lower-middle range in international comparisons of intergenerational mobility.
In Spain, only 10% of children from the bottom 20% reach the top 20%, while over 60% of those born in the top 20% remain in the top half.
It’s slightly better than the US, but not as good as Sweden.
3/7
In Spain, only 10% of children from the bottom 20% reach the top 20%, while over 60% of those born in the top 20% remain in the top half.
It’s slightly better than the US, but not as good as Sweden.
3/7
June 18, 2025 at 2:10 PM
Spain ranks in the lower-middle range in international comparisons of intergenerational mobility.
In Spain, only 10% of children from the bottom 20% reach the top 20%, while over 60% of those born in the top 20% remain in the top half.
It’s slightly better than the US, but not as good as Sweden.
3/7
In Spain, only 10% of children from the bottom 20% reach the top 20%, while over 60% of those born in the top 20% remain in the top half.
It’s slightly better than the US, but not as good as Sweden.
3/7
Débat de l'Egalite passionnant avec Arnaud Orain, @thomaspiketty.bsky.social & @lucaschancel.bsky.social pour finir la saison 2024-25.
Rdv à la rentrée pour + de rencontres autour d'un livre 📚
Rejoignez notre liste pour recevoir les invit' ✍️ wid.world/subscribe-to...
@ehess.fr @pse.bsky.social
Rdv à la rentrée pour + de rencontres autour d'un livre 📚
Rejoignez notre liste pour recevoir les invit' ✍️ wid.world/subscribe-to...
@ehess.fr @pse.bsky.social
June 17, 2025 at 8:23 AM
Débat de l'Egalite passionnant avec Arnaud Orain, @thomaspiketty.bsky.social & @lucaschancel.bsky.social pour finir la saison 2024-25.
Rdv à la rentrée pour + de rencontres autour d'un livre 📚
Rejoignez notre liste pour recevoir les invit' ✍️ wid.world/subscribe-to...
@ehess.fr @pse.bsky.social
Rdv à la rentrée pour + de rencontres autour d'un livre 📚
Rejoignez notre liste pour recevoir les invit' ✍️ wid.world/subscribe-to...
@ehess.fr @pse.bsky.social
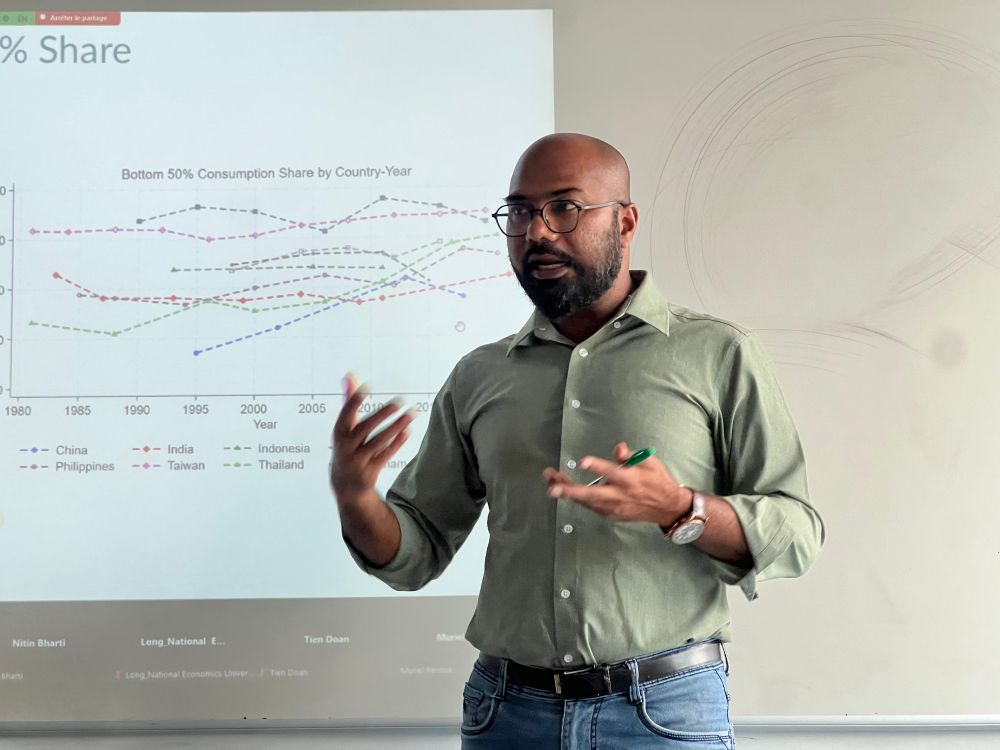
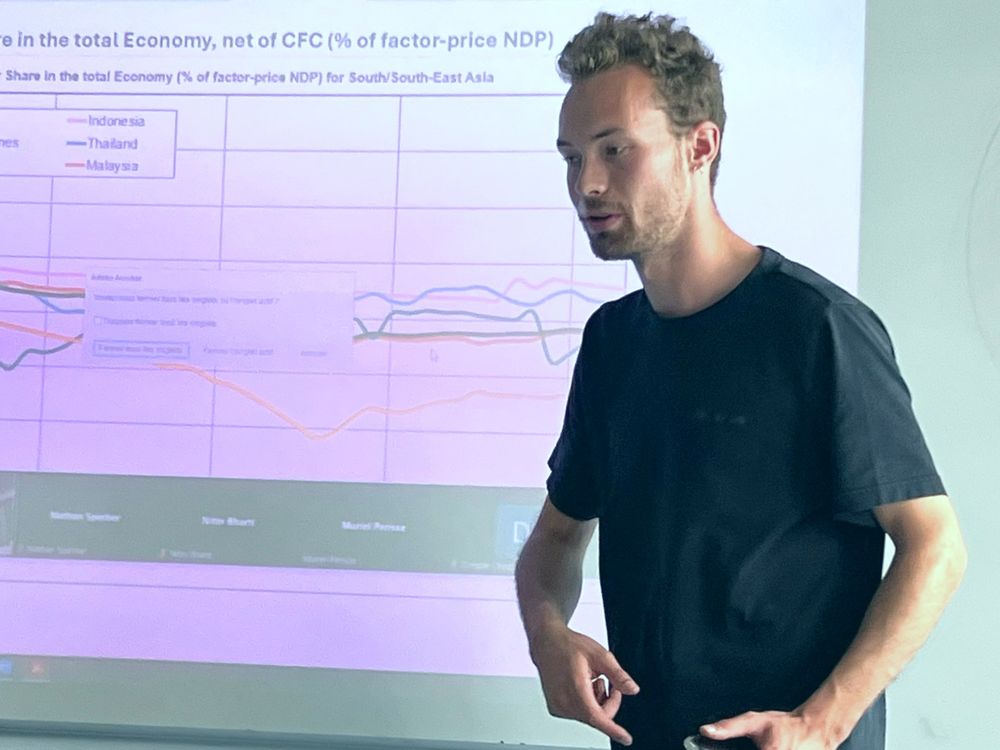
Researchers from around the world gathered in Paris to share the latest findings on inequality and labour income in Southeast Asia.
🔍Regional overviews + country insights on 🇮🇳 🇨🇳 🇵🇭 🇻🇳 🇹🇭 🇲🇾 - with inputs from WIL fellows @nitin-k-bharti.bsky.social @markjmn.bsky.social & @jonasdietrich.bsky.social.
🔍Regional overviews + country insights on 🇮🇳 🇨🇳 🇵🇭 🇻🇳 🇹🇭 🇲🇾 - with inputs from WIL fellows @nitin-k-bharti.bsky.social @markjmn.bsky.social & @jonasdietrich.bsky.social.
June 12, 2025 at 11:35 AM
Researchers from around the world gathered in Paris to share the latest findings on inequality and labour income in Southeast Asia.
🔍Regional overviews + country insights on 🇮🇳 🇨🇳 🇵🇭 🇻🇳 🇹🇭 🇲🇾 - with inputs from WIL fellows @nitin-k-bharti.bsky.social @markjmn.bsky.social & @jonasdietrich.bsky.social.
🔍Regional overviews + country insights on 🇮🇳 🇨🇳 🇵🇭 🇻🇳 🇹🇭 🇲🇾 - with inputs from WIL fellows @nitin-k-bharti.bsky.social @markjmn.bsky.social & @jonasdietrich.bsky.social.