


VoxelNYC
@voxelnyc.substack.com
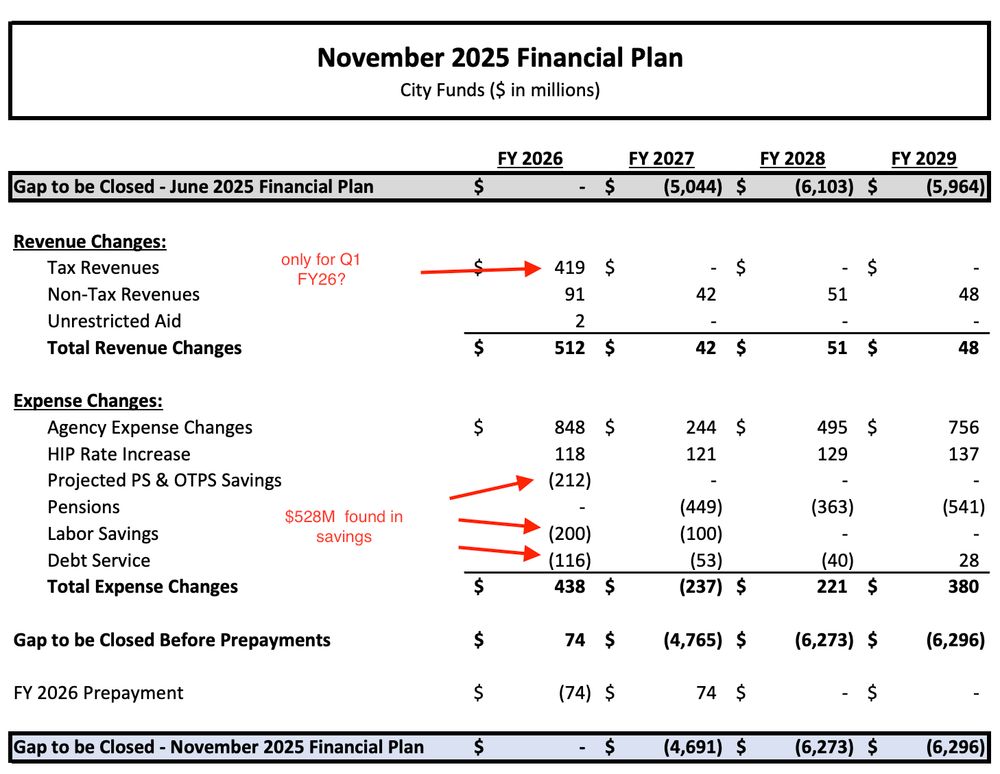
Is it just simple extrapolation? $419M in the period from July - Oct 2025 portends $1.676B in the period from July 2025 - July 2026?
November 18, 2025 at 5:11 PM
Is it just simple extrapolation? $419M in the period from July - Oct 2025 portends $1.676B in the period from July 2025 - July 2026?
OMB says that this modification is supported by $419M in "stronger than expected" tax revenue since July, and $528M in savings.
The law says the NYC budget must be balanced (spending == revenue). So how does $947M in revenue + savings square with a $2.3B increase?
The law says the NYC budget must be balanced (spending == revenue). So how does $947M in revenue + savings square with a $2.3B increase?
November 18, 2025 at 5:11 PM
OMB says that this modification is supported by $419M in "stronger than expected" tax revenue since July, and $528M in savings.
The law says the NYC budget must be balanced (spending == revenue). So how does $947M in revenue + savings square with a $2.3B increase?
The law says the NYC budget must be balanced (spending == revenue). So how does $947M in revenue + savings square with a $2.3B increase?
That's why the Council's response yesterday was basically "yup, our forecast was accurate".
November 18, 2025 at 4:18 PM
That's why the Council's response yesterday was basically "yup, our forecast was accurate".
I say 'deliberately' because for the last 3 years, it's been the same script: an obviously wrong forecast of revenue in June to set up a spectacle in November when the Mayor announces good budget news after finding an extra few hundred billion dollars in the couch cushions
November 18, 2025 at 4:18 PM
I say 'deliberately' because for the last 3 years, it's been the same script: an obviously wrong forecast of revenue in June to set up a spectacle in November when the Mayor announces good budget news after finding an extra few hundred billion dollars in the couch cushions
The reality is that the Mayor deliberately under-estimated tax revenues back in June when the budget was approved. A few months go by, the tax receipts are bEtTeR tHaN eXpEcTeD, and the Mayor can use the November Plan as an opportunity to apportion the extra money and claim a win
November 18, 2025 at 4:18 PM
The reality is that the Mayor deliberately under-estimated tax revenues back in June when the budget was approved. A few months go by, the tax receipts are bEtTeR tHaN eXpEcTeD, and the Mayor can use the November Plan as an opportunity to apportion the extra money and claim a win
Council's messaging: "As forecasted by the Council, New York City’s economy continues to see steady growth. The Council’s revenue projections have been consistently substantiated by the mayoral administration’s financial plans, which is once again the case in this November Plan"
November 18, 2025 at 4:18 PM
Council's messaging: "As forecasted by the Council, New York City’s economy continues to see steady growth. The Council’s revenue projections have been consistently substantiated by the mayoral administration’s financial plans, which is once again the case in this November Plan"
Mayor's messaging: "Today's announcement follows Mayor Adams' long history of strong fiscal management, including delivering an on-time, balanced, and fiscally-responsible $115.9 billion Adopted Budget earlier this year, which built on the FY 2026 Executive Budget, often called the Best Budget Ever"
November 18, 2025 at 4:18 PM
Mayor's messaging: "Today's announcement follows Mayor Adams' long history of strong fiscal management, including delivering an on-time, balanced, and fiscally-responsible $115.9 billion Adopted Budget earlier this year, which built on the FY 2026 Executive Budget, often called the Best Budget Ever"
Example: yesterday the Mayor released the "November Plan", which among other things is a mid-year check on tax revenues to make sure the budget agreed to with the Council in June is grounded in fiscal reality
November 18, 2025 at 4:18 PM
Example: yesterday the Mayor released the "November Plan", which among other things is a mid-year check on tax revenues to make sure the budget agreed to with the Council in June is grounded in fiscal reality
The VoxelNYC project is about making this public data more immediately usable. The current gap is a barrier to public oversight. If it's going to take this much work to just match a spreadsheet against a published report, OMB needs to create more (and better!) documentation.
November 14, 2025 at 5:01 PM
The VoxelNYC project is about making this public data more immediately usable. The current gap is a barrier to public oversight. If it's going to take this much work to just match a spreadsheet against a published report, OMB needs to create more (and better!) documentation.
Those "Change From..." columns are just simple deltas.
Looks like we're in good shape. This simple roll-up of the budget line-items from the Open NYC data source appears to match the Agency Summary table in the Expense Budget PDF.
Success!
Looks like we're in good shape. This simple roll-up of the budget line-items from the Open NYC data source appears to match the Agency Summary table in the Expense Budget PDF.
Success!


November 14, 2025 at 5:01 PM
Those "Change From..." columns are just simple deltas.
Looks like we're in good shape. This simple roll-up of the budget line-items from the Open NYC data source appears to match the Agency Summary table in the Expense Budget PDF.
Success!
Looks like we're in good shape. This simple roll-up of the budget line-items from the Open NYC data source appears to match the Agency Summary table in the Expense Budget PDF.
Success!
I made a table showing how these columns relate between the two sources.
Note that the Expense Budget PDF has these "Change From..." columns that don't have an analog in the columns from Open NYC data. We'll have to calculate those ones ourselves
Note that the Expense Budget PDF has these "Change From..." columns that don't have an analog in the columns from Open NYC data. We'll have to calculate those ones ourselves

November 14, 2025 at 5:01 PM
I made a table showing how these columns relate between the two sources.
Note that the Expense Budget PDF has these "Change From..." columns that don't have an analog in the columns from Open NYC data. We'll have to calculate those ones ourselves
Note that the Expense Budget PDF has these "Change From..." columns that don't have an analog in the columns from Open NYC data. We'll have to calculate those ones ourselves
In the FY26 Expense Budget PDF, "Adopted Budget Amount" means the budget that was adopted.
"Financial Plan Amount" means the budget that was adopted for FY26
"Financial Plan Amount" means the budget that was adopted for FY26
November 14, 2025 at 5:01 PM
In the FY26 Expense Budget PDF, "Adopted Budget Amount" means the budget that was adopted.
"Financial Plan Amount" means the budget that was adopted for FY26
"Financial Plan Amount" means the budget that was adopted for FY26
The next step is to figure out how the columns from the Open NYC data map to the columns in the PDF.
While there is taxonomical overlap (adopted & modified) in the column names, the PDF table columns refer to previous fiscal years. But we've just filtered to the current FY...
While there is taxonomical overlap (adopted & modified) in the column names, the PDF table columns refer to previous fiscal years. But we've just filtered to the current FY...


November 14, 2025 at 5:01 PM
The next step is to figure out how the columns from the Open NYC data map to the columns in the PDF.
While there is taxonomical overlap (adopted & modified) in the column names, the PDF table columns refer to previous fiscal years. But we've just filtered to the current FY...
While there is taxonomical overlap (adopted & modified) in the column names, the PDF table columns refer to previous fiscal years. But we've just filtered to the current FY...
This means there is a lot of historical data in the spreadsheet. Since we are trying to recreate a table from the FY26 Adopted Budget PDF, our first step is to filter the data to the latest publication date of the latest fiscal year
November 14, 2025 at 5:01 PM
This means there is a lot of historical data in the spreadsheet. Since we are trying to recreate a table from the FY26 Adopted Budget PDF, our first step is to filter the data to the latest publication date of the latest fiscal year
The publication dates for each fiscal year align roughly with the milestones of the budget cycle (a series of proposals, reviews, and responses between the Mayor and the City Council):
January: Preliminary Budget
April: Executive Budget
June: Approved Budget
January: Preliminary Budget
April: Executive Budget
June: Approved Budget

November 14, 2025 at 5:01 PM
The publication dates for each fiscal year align roughly with the milestones of the budget cycle (a series of proposals, reviews, and responses between the Mayor and the City Council):
January: Preliminary Budget
April: Executive Budget
June: Approved Budget
January: Preliminary Budget
April: Executive Budget
June: Approved Budget
The dataset has columns for `fiscal_year` and `publication_date`, implying that the dataset contains more than just the current fiscal year's budget data.
We can see there are 3 budgets per fiscal year, each having 30-40K rows.
We can see there are 3 budgets per fiscal year, each having 30-40K rows.


November 14, 2025 at 5:01 PM
The dataset has columns for `fiscal_year` and `publication_date`, implying that the dataset contains more than just the current fiscal year's budget data.
We can see there are 3 budgets per fiscal year, each having 30-40K rows.
We can see there are 3 budgets per fiscal year, each having 30-40K rows.
This implies that the tables in the official PDF can be recreated with the spreadsheet. Let's test this out by reconstructing the table that summarizes authorized Expense spending for FY 2026 by agency.

November 14, 2025 at 5:01 PM
This implies that the tables in the official PDF can be recreated with the spreadsheet. Let's test this out by reconstructing the table that summarizes authorized Expense spending for FY 2026 by agency.
Let's take the Expense Budget as an example. The Expense Budget exists in two forms:
1) a 1000-page PDF
2) a spreadsheet with 1,000,000 rows
Ostensibly, the spreadsheet is raw data product that is used to create the PDF
1) a 1000-page PDF
2) a spreadsheet with 1,000,000 rows
Ostensibly, the spreadsheet is raw data product that is used to create the PDF

November 14, 2025 at 5:01 PM
Let's take the Expense Budget as an example. The Expense Budget exists in two forms:
1) a 1000-page PDF
2) a spreadsheet with 1,000,000 rows
Ostensibly, the spreadsheet is raw data product that is used to create the PDF
1) a 1000-page PDF
2) a spreadsheet with 1,000,000 rows
Ostensibly, the spreadsheet is raw data product that is used to create the PDF