


T.Y. Lim
@tylim.bsky.social
#DrugsAndBugs Postdoc at CCDD HSPH, PhD @mitsloan.bsky.social, formerly @YaleEnvironment. Complex systems & simulation modelling for public health. Standard disclaimers apply. @limtseyang in the other (worse) place.
Addendum - image in third post messed up, here's a clean version!
November 20, 2024 at 6:29 PM
Addendum - image in third post messed up, here's a clean version!
Thanks to our collaborators at MGB, Tufts Medical Center, and @countyofla.bsky.social Dept of Public Health for sharing data for this work!
@yhgrad.bsky.social @jameshay.bsky.social
End/
@yhgrad.bsky.social @jameshay.bsky.social
End/
November 20, 2024 at 4:31 PM
Thanks to our collaborators at MGB, Tufts Medical Center, and @countyofla.bsky.social Dept of Public Health for sharing data for this work!
@yhgrad.bsky.social @jameshay.bsky.social
End/
@yhgrad.bsky.social @jameshay.bsky.social
End/
Overall our work shows analysis of Ct values can complement traditional incidence metrics and surveillance, using already-collected PCR data to help monitor epidemics – extra important if testing resources are limited or absent other public health surveillance
11/
11/
November 20, 2024 at 4:31 PM
Overall our work shows analysis of Ct values can complement traditional incidence metrics and surveillance, using already-collected PCR data to help monitor epidemics – extra important if testing resources are limited or absent other public health surveillance
11/
11/
It’s worth reiterating that these are extremely simple models – they run in minutes, can be updated frequently, and are well within the computational capabilities and expertise of any local public health agency
10/
10/
November 20, 2024 at 4:31 PM
It’s worth reiterating that these are extremely simple models – they run in minutes, can be updated frequently, and are well within the computational capabilities and expertise of any local public health agency
10/
10/
Crucially, nowcasting models are robust to limited daily sample sizes – an inherent limitation of count-based methods
Dropping Ct outliers in each day’s data improves performance, but accounting for population immunity or symptom status does not; all models face clear bias-variance tradeoffs
9/
Dropping Ct outliers in each day’s data improves performance, but accounting for population immunity or symptom status does not; all models face clear bias-variance tradeoffs
9/
November 20, 2024 at 4:31 PM
Crucially, nowcasting models are robust to limited daily sample sizes – an inherent limitation of count-based methods
Dropping Ct outliers in each day’s data improves performance, but accounting for population immunity or symptom status does not; all models face clear bias-variance tradeoffs
9/
Dropping Ct outliers in each day’s data improves performance, but accounting for population immunity or symptom status does not; all models face clear bias-variance tradeoffs
9/
Our simulations showed that several factors confound nowcasting model accuracy – notably, random inter-individual variation in viral kinetics, and non-random sampling delays (from infection to testing)
8/
8/
November 20, 2024 at 4:31 PM
Our simulations showed that several factors confound nowcasting model accuracy – notably, random inter-individual variation in viral kinetics, and non-random sampling delays (from infection to testing)
8/
8/
Interestingly, while our two datasets reflect very different ways of detecting infections (hospital admissions testing vs. community testing) and showed different relationships between Ct values and epidemic growth rates, both datasets were useful in predicting epidemic growth rates over time
7/
7/
November 20, 2024 at 4:31 PM
Interestingly, while our two datasets reflect very different ways of detecting infections (hospital admissions testing vs. community testing) and showed different relationships between Ct values and epidemic growth rates, both datasets were useful in predicting epidemic growth rates over time
7/
7/
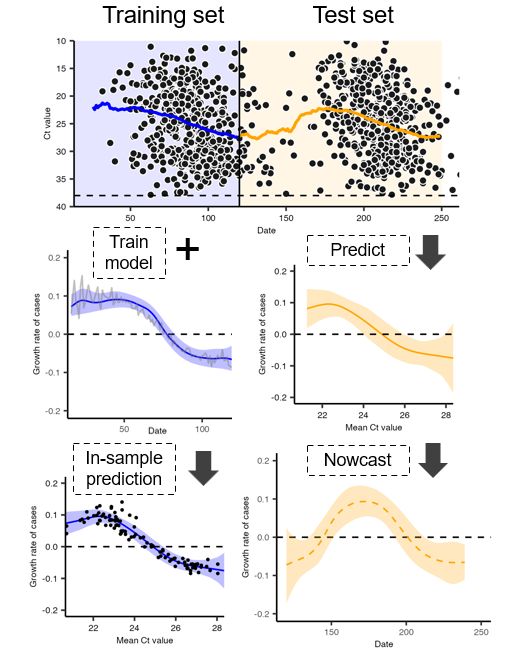
Simple cubic spline regression models using daily reported Ct value distributions can nowcast epidemic [log] growth rates over two-week time horizons to reasonable accuracy (RMSE ~0.04 – for context, growth rates vary from approx. +/- 0.2)
6/
6/

November 20, 2024 at 4:31 PM
Simple cubic spline regression models using daily reported Ct value distributions can nowcast epidemic [log] growth rates over two-week time horizons to reasonable accuracy (RMSE ~0.04 – for context, growth rates vary from approx. +/- 0.2)
6/
6/
But how well does this work in practice? Here, we did one of the largest tests to date of how well Ct values can nowcast epidemic growth rates (rate of change in cases) under various conditions, using both simulated data and large real-world datasets from Massachusetts and Los Angeles County, USA
5/
5/
November 20, 2024 at 4:31 PM
But how well does this work in practice? Here, we did one of the largest tests to date of how well Ct values can nowcast epidemic growth rates (rate of change in cases) under various conditions, using both simulated data and large real-world datasets from Massachusetts and Los Angeles County, USA
5/
5/
These orthogonal indicators, which don’t rely on counting cases (e.g., wastewater viral load), are important for building a complete and accurate picture of an outbreak
4/
4/
November 20, 2024 at 4:31 PM
These orthogonal indicators, which don’t rely on counting cases (e.g., wastewater viral load), are important for building a complete and accurate picture of an outbreak
4/
4/
So in theory, viral loads / Ct values from routine or surveillance testing could tell us if outbreaks are growing or shrinking, separate from trends in case counts – providing early warning and an alternative source of information
3/
3/

November 20, 2024 at 4:31 PM
So in theory, viral loads / Ct values from routine or surveillance testing could tell us if outbreaks are growing or shrinking, separate from trends in case counts – providing early warning and an alternative source of information
3/
3/
RT-qPCR tests for viral pathogens like SARS-CoV-2 indirectly measure viral loads through cycle threshold (Ct) values. Previous work (doi.org/10.1126/scie...) found that population-level viral load distributions relate to epidemic trajectories
2/
2/

Estimating epidemiologic dynamics from cross-sectional viral load distributions
Cycle threshold values from PCR testing depend on epidemic dynamics and can be used to monitor SARS-CoV-2 and other outbreaks.
doi.org
November 20, 2024 at 4:31 PM
RT-qPCR tests for viral pathogens like SARS-CoV-2 indirectly measure viral loads through cycle threshold (Ct) values. Previous work (doi.org/10.1126/scie...) found that population-level viral load distributions relate to epidemic trajectories
2/
2/