


Tom Forth
@tomforth.co.uk
Same as @thomasforth on X. Gone back to Twitter for now. Quality filter, locations in bios, and polls pls. Leeds, Yorkshire, UK.
Also includes a graph, for I am known for such things, on how Almere, the Netherlands' most successful new city has overtaken Lelystad, the Netherlands' most mocked new city in population since they were built on land reclaimed from the sea.

October 24, 2025 at 12:33 AM
Also includes a graph, for I am known for such things, on how Almere, the Netherlands' most successful new city has overtaken Lelystad, the Netherlands' most mocked new city in population since they were built on land reclaimed from the sea.
Includes a map I drew (actually traced) by hand (well in Inkscape) and styled myself (actually got Luke to help me). But it's a good map. I tried to get ChatGPT to draw it for me, but it was rubbish. So I did it with humans.

October 24, 2025 at 12:32 AM
Includes a map I drew (actually traced) by hand (well in Inkscape) and styled myself (actually got Luke to help me). But it's a good map. I tried to get ChatGPT to draw it for me, but it was rubbish. So I did it with humans.
Yeah, I'm 100% keeping the "estimate" tag on my data.

August 18, 2025 at 9:00 PM
Yeah, I'm 100% keeping the "estimate" tag on my data.
They have definitely done something odd given that the number of journeys from Leeds to Birmingham New Street is precisely the same as the number of journeys from Birmingham New Street to Leeds. That's consistent across all the data and it can't be the result of using only ticket sale data.

August 18, 2025 at 8:44 PM
They have definitely done something odd given that the number of journeys from Leeds to Birmingham New Street is precisely the same as the number of journeys from Birmingham New Street to Leeds. That's consistent across all the data and it can't be the result of using only ticket sale data.
Perhaps worth adding that between Liverpool and Birmingham, where the trains are long, electric, more comfortable, cheaper, the ridership is much higher. Over three times as high if we believe the data. Despite Liverpool's substantially smaller population. I think it's the very bad trains to blame.


August 18, 2025 at 6:40 PM
Perhaps worth adding that between Liverpool and Birmingham, where the trains are long, electric, more comfortable, cheaper, the ridership is much higher. Over three times as high if we believe the data. Despite Liverpool's substantially smaller population. I think it's the very bad trains to blame.
Not much (the split is usually in Derby I think) is the official answer. But as I hint in the piece itself, I am a bit sceptical about the whole dataset and the railway industry in Britain are pretty bad at this type of stuff.

August 18, 2025 at 3:15 PM
Not much (the split is usually in Derby I think) is the official answer. But as I hint in the piece itself, I am a bit sceptical about the whole dataset and the railway industry in Britain are pretty bad at this type of stuff.
This is mostly an excuse to share a worked example of this passenger flows data tool I built. It calculates the rail passengers flows between any two circles of any size in GB, and the GVA and the populations of those circles too. tomforth.co.uk/passengerflo...

August 18, 2025 at 2:31 PM
This is mostly an excuse to share a worked example of this passenger flows data tool I built. It calculates the rail passengers flows between any two circles of any size in GB, and the GVA and the populations of those circles too. tomforth.co.uk/passengerflo...
Philadelphia and Baltimore are in many ways an even better match of cities, but the US trains are so much faster, cheaper, and better than the British ones that it felt like an unfair comparison. Plus I couldn't get the US ridership data.


August 18, 2025 at 2:27 PM
Philadelphia and Baltimore are in many ways an even better match of cities, but the US trains are so much faster, cheaper, and better than the British ones that it felt like an unfair comparison. Plus I couldn't get the US ridership data.
Milwaukee & Chicago are a similar sized pair of cities a similar distance apart to Leeds & Manchester. The trains are half as frequent, but frequency doesn't seem to matter nearly as much as the trains being bigger, nicer, and cheaper. So US ridership is over twice as high. tomforth.co.uk/traindata/


August 18, 2025 at 2:25 PM
Milwaukee & Chicago are a similar sized pair of cities a similar distance apart to Leeds & Manchester. The trains are half as frequent, but frequency doesn't seem to matter nearly as much as the trains being bigger, nicer, and cheaper. So US ridership is over twice as high. tomforth.co.uk/traindata/
So Chicago is 9.4m people. That is precisely the same as the Chicago Metropolitan Statistical Area (MSA) in US statistics and I assume it's the same for all of the US cities.

August 14, 2025 at 3:35 PM
So Chicago is 9.4m people. That is precisely the same as the Chicago Metropolitan Statistical Area (MSA) in US statistics and I assume it's the same for all of the US cities.
Recent work by The Resolution Foundation covered in the FT modelled that removing Manchester and Birmingham's underperformance would grow the UK economy by 0.1%. I think we should expect 100x that! 7% growth above trend if we emulate France. 14% if we can emulate the Netherlands.

August 13, 2025 at 11:29 PM
Recent work by The Resolution Foundation covered in the FT modelled that removing Manchester and Birmingham's underperformance would grow the UK economy by 0.1%. I think we should expect 100x that! 7% growth above trend if we emulate France. 14% if we can emulate the Netherlands.
In most of the world, bigger cities have stronger economies. It happens in France, the USA, the Netherlands, Belgium, and on, and on. But not in Britain. In Britain, the bigger a city gets the weaker its economy is, except for London. This costs us dearly.


August 13, 2025 at 11:25 PM
In most of the world, bigger cities have stronger economies. It happens in France, the USA, the Netherlands, Belgium, and on, and on. But not in Britain. In Britain, the bigger a city gets the weaker its economy is, except for London. This costs us dearly.
Here's that calculation. And the piece I calculated it for. tomforth.co.uk/whynorthengl...

August 10, 2025 at 11:23 AM
Here's that calculation. And the piece I calculated it for. tomforth.co.uk/whynorthengl...
And here's a piece I wrote about it later in 2016 looking specifically at Birmingham. I used The West Midlands as a comparable geography to London there, which I think is right. www.tomforth.co.uk/inclusivegro...

July 23, 2025 at 10:03 PM
And here's a piece I wrote about it later in 2016 looking specifically at Birmingham. I used The West Midlands as a comparable geography to London there, which I think is right. www.tomforth.co.uk/inclusivegro...
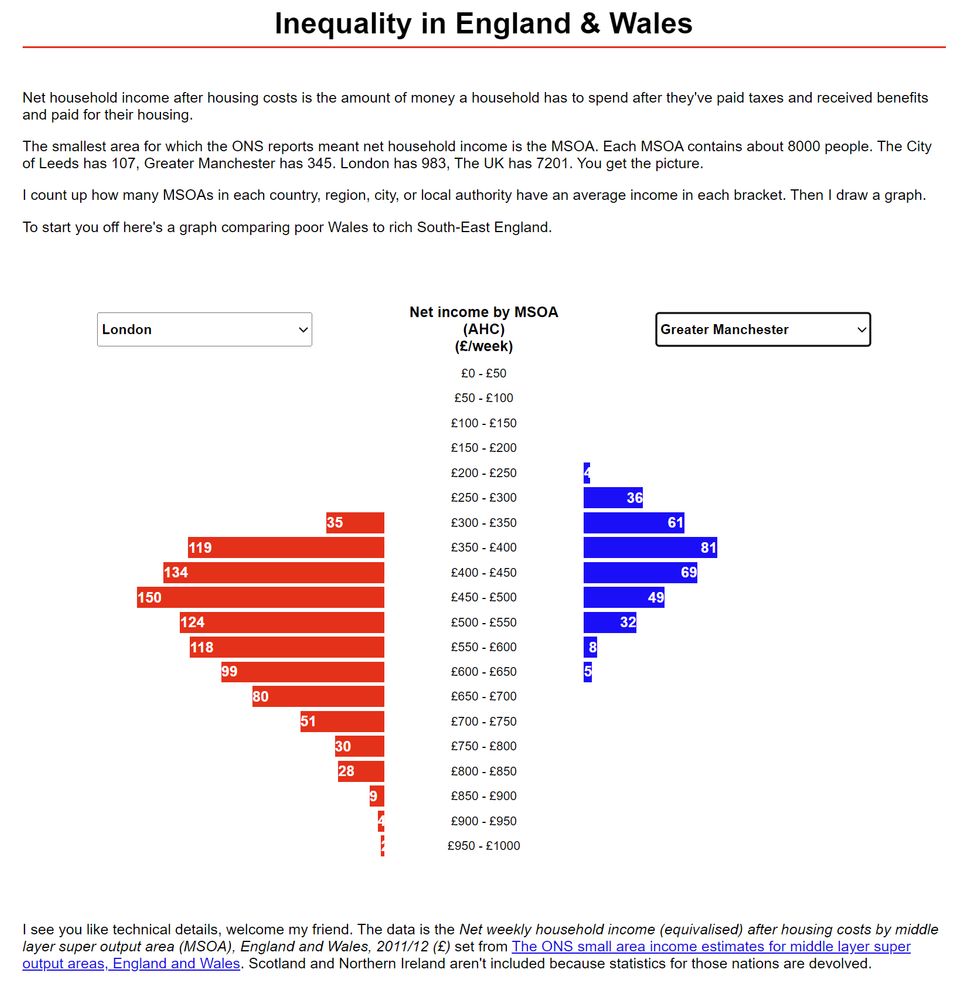
The tool I built back in May 2016 lets you compare lots more geographies if you like. Data is from 2011/12, so really could do with updating, but I don't have the time to do much of that any more. www.tomforth.co.uk/incomebymsoa/
July 23, 2025 at 9:57 PM
The tool I built back in May 2016 lets you compare lots more geographies if you like. Data is from 2011/12, so really could do with updating, but I don't have the time to do much of that any more. www.tomforth.co.uk/incomebymsoa/
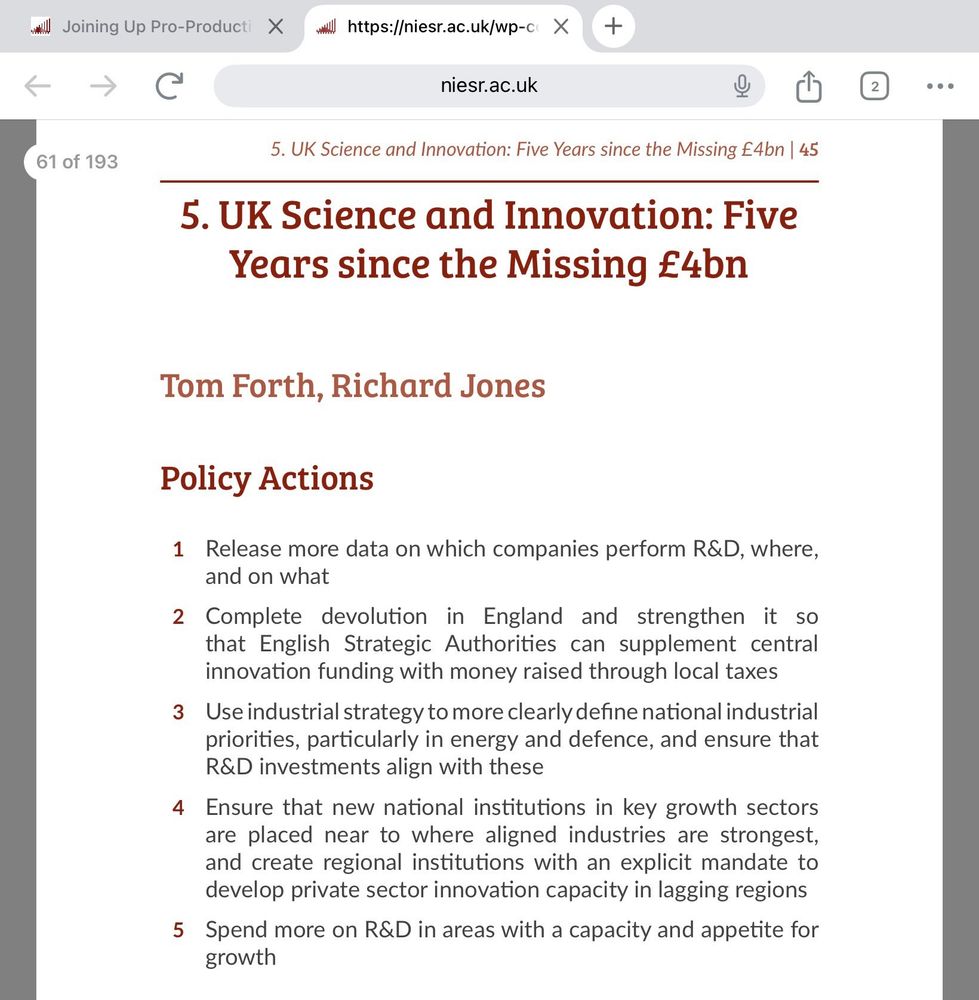
Let the record further show that we wrote these suggestions. Nothing about skills, not really anything about joined up thinking, not that aligned with the essay collection's summary. I would say that I, along with @gilesyb.bsky.social, was among a small core of sceptics at the meetings.
July 9, 2025 at 5:48 PM
Let the record further show that we wrote these suggestions. Nothing about skills, not really anything about joined up thinking, not that aligned with the essay collection's summary. I would say that I, along with @gilesyb.bsky.social, was among a small core of sceptics at the meetings.
Wrote a paper. Read the paper. Seems okay. You can read it too. The pub is now much fuller than my reading on X. niesr.ac.uk/publications...

July 9, 2025 at 5:45 PM
Wrote a paper. Read the paper. Seems okay. You can read it too. The pub is now much fuller than my reading on X. niesr.ac.uk/publications...
@jacktindale.bsky.social thinking of u.

May 15, 2025 at 12:12 PM
@jacktindale.bsky.social thinking of u.
Hi @samuelmarclowe.bsky.social -- I've seen this graph by "Bank of America Global Research" apparently. So not complete jokers. But the data,..... looks a bit jokery to me. Does the UK *really* have non tariff barriers so much higher than France?! What do you think?

April 4, 2025 at 7:46 AM
Hi @samuelmarclowe.bsky.social -- I've seen this graph by "Bank of America Global Research" apparently. So not complete jokers. But the data,..... looks a bit jokery to me. Does the UK *really* have non tariff barriers so much higher than France?! What do you think?
Includes this nice picture of the building where I think any such library should be. Unsurprisingly, I think location is a key part of any decision.

March 20, 2025 at 2:32 AM
Includes this nice picture of the building where I think any such library should be. Unsurprisingly, I think location is a key part of any decision.
1/ Go to Nomisweb.
2/ Select ASHE > workplace > annual pay > full-time > median > regions.
3/ Go to ONS, get CPIH deflator. Adjust for inflation.
4/ Set starting year at 100 for all regions.
5/ Draw graph (with bad X axis). Label Scotland. Polite "WTF?!" as the title.
.
.
Have a nice weekend.
2/ Select ASHE > workplace > annual pay > full-time > median > regions.
3/ Go to ONS, get CPIH deflator. Adjust for inflation.
4/ Set starting year at 100 for all regions.
5/ Draw graph (with bad X axis). Label Scotland. Polite "WTF?!" as the title.
.
.
Have a nice weekend.


March 7, 2025 at 6:37 PM
1/ Go to Nomisweb.
2/ Select ASHE > workplace > annual pay > full-time > median > regions.
3/ Go to ONS, get CPIH deflator. Adjust for inflation.
4/ Set starting year at 100 for all regions.
5/ Draw graph (with bad X axis). Label Scotland. Polite "WTF?!" as the title.
.
.
Have a nice weekend.
2/ Select ASHE > workplace > annual pay > full-time > median > regions.
3/ Go to ONS, get CPIH deflator. Adjust for inflation.
4/ Set starting year at 100 for all regions.
5/ Draw graph (with bad X axis). Label Scotland. Polite "WTF?!" as the title.
.
.
Have a nice weekend.
Thanks for this. It prompted me to update my data on where the Lords live and I fear it's actually even more skewed towards the South East. Here's the residence of those that attended in the last month. :/

February 10, 2025 at 10:26 AM
Thanks for this. It prompted me to update my data on where the Lords live and I fear it's actually even more skewed towards the South East. Here's the residence of those that attended in the last month. :/
Friends fear he's been snooping around.


February 6, 2025 at 11:12 PM
Friends fear he's been snooping around.
🎒↗️🐈 -- we at The Data City are announcing a big partnership with Oxford Economics to help power the future of economic forecasting around the world. We're here at their Global Economic Outlook Conference 2025 to hear about how some traditional economic measures are losing power.


February 5, 2025 at 10:27 AM
🎒↗️🐈 -- we at The Data City are announcing a big partnership with Oxford Economics to help power the future of economic forecasting around the world. We're here at their Global Economic Outlook Conference 2025 to hear about how some traditional economic measures are losing power.