


Tim Osborn
@timosbornclim.bsky.social
Climate variability and change | Professor of Climate Science & Director of Climatic Research Unit | UEA | Views expressed here are my own, not UEA's
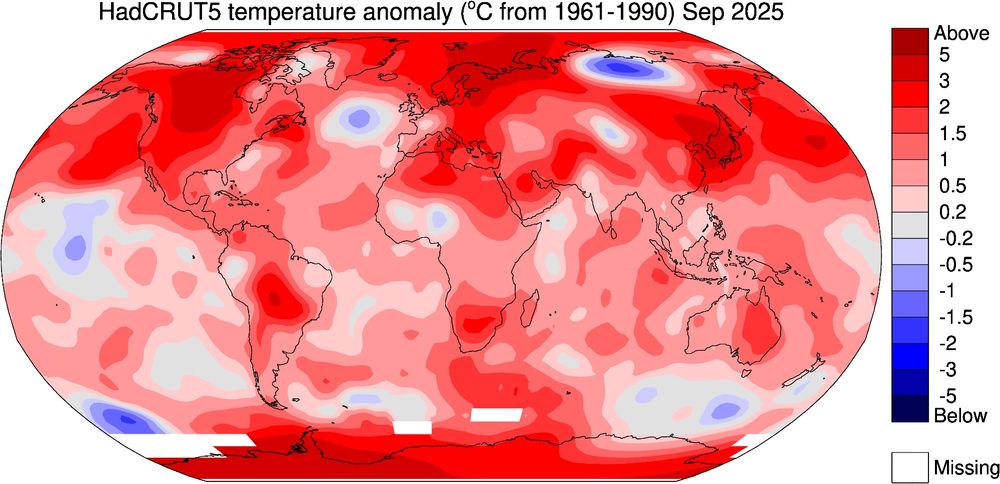
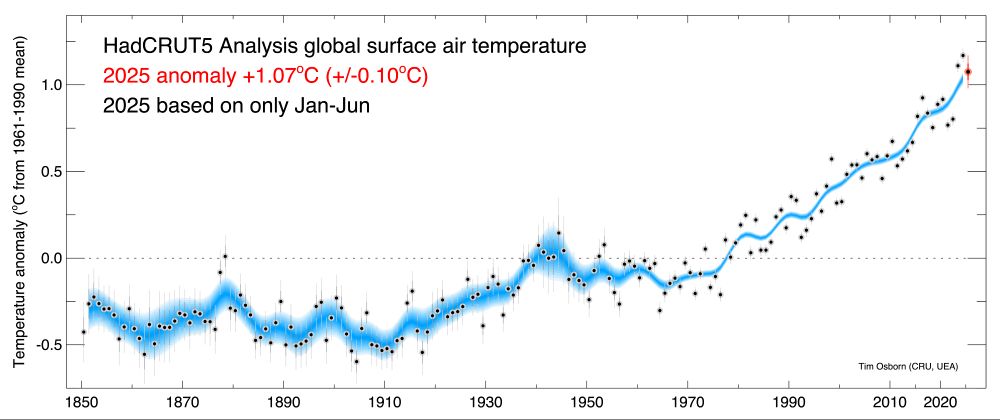
HadCRUT5 global temperature dataset now updated to Sep 2025.
As usual, data can be downloaded from CRU/UEA website: crudata.uea.ac.uk/cru/data/tem...
And from Met Office/hadobs website: www.metoffice.gov.uk/hadobs/hadcr...
@climateuea.bsky.social @colinmorice.bsky.social
As usual, data can be downloaded from CRU/UEA website: crudata.uea.ac.uk/cru/data/tem...
And from Met Office/hadobs website: www.metoffice.gov.uk/hadobs/hadcr...
@climateuea.bsky.social @colinmorice.bsky.social

November 3, 2025 at 1:25 PM
HadCRUT5 global temperature dataset now updated to Sep 2025.
As usual, data can be downloaded from CRU/UEA website: crudata.uea.ac.uk/cru/data/tem...
And from Met Office/hadobs website: www.metoffice.gov.uk/hadobs/hadcr...
@climateuea.bsky.social @colinmorice.bsky.social
As usual, data can be downloaded from CRU/UEA website: crudata.uea.ac.uk/cru/data/tem...
And from Met Office/hadobs website: www.metoffice.gov.uk/hadobs/hadcr...
@climateuea.bsky.social @colinmorice.bsky.social
Climate stripes by longitude? Here's mine from 2004.

October 1, 2025 at 4:18 PM
Climate stripes by longitude? Here's mine from 2004.
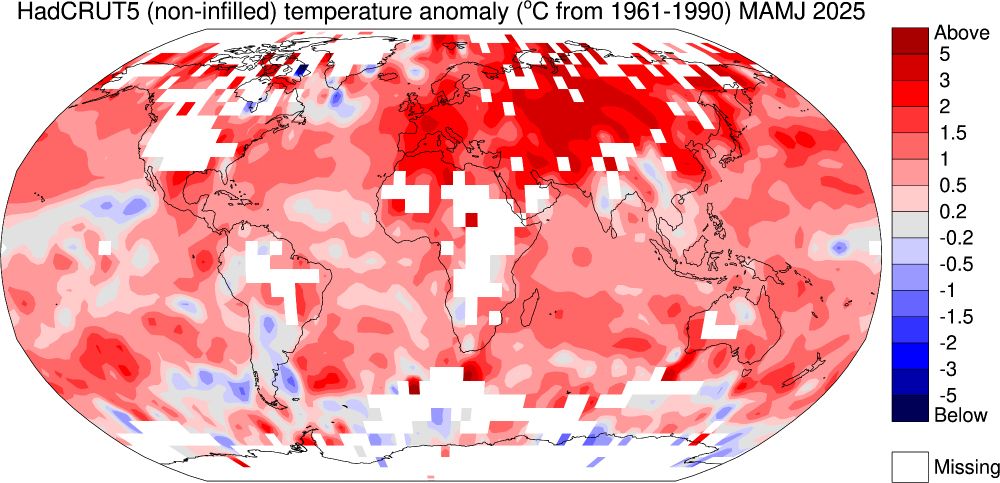
For regular monthly updates to CRUTEM (and hence to HadCRUT) we rely on monthly data provided by National Met Services via the WMO's CLIMAT system. Unusually, the USA data didn't yet make it into the CLIMAT data feed for Mar-Jun 2025. Note the USA-sized gap in the non-infilled version of HadCRUT:
September 22, 2025 at 9:51 PM
For regular monthly updates to CRUTEM (and hence to HadCRUT) we rely on monthly data provided by National Met Services via the WMO's CLIMAT system. Unusually, the USA data didn't yet make it into the CLIMAT data feed for Mar-Jun 2025. Note the USA-sized gap in the non-infilled version of HadCRUT:
Thanks! If you zoom in on the PDF version you can see how I drew the different levels of shading 👇
September 22, 2025 at 6:13 PM
Thanks! If you zoom in on the PDF version you can see how I drew the different levels of shading 👇
And some visualisations are available here:
crudata.uea.ac.uk/~timo/diag/t...
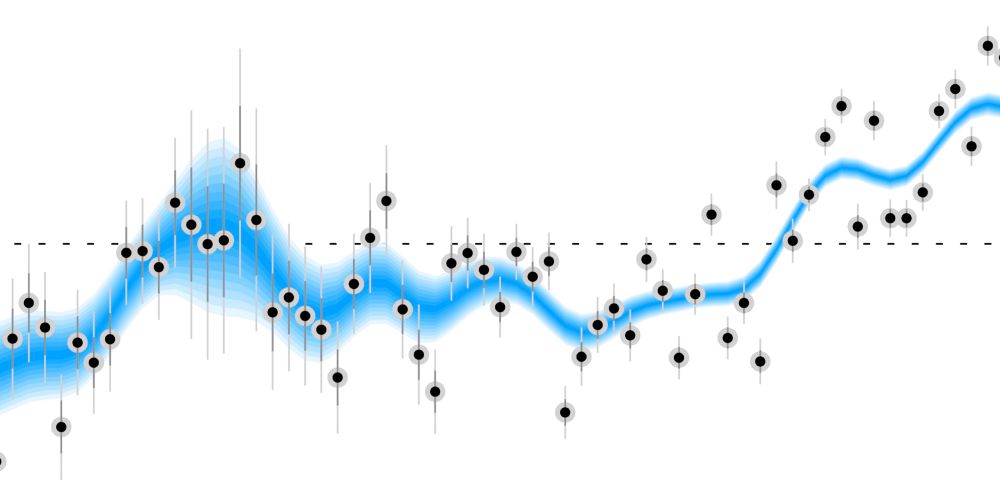
including 12-month running means of global land+marine (HadCRUT) and global land (CRUTEM) temperature anomalies
crudata.uea.ac.uk/~timo/diag/t...
including 12-month running means of global land+marine (HadCRUT) and global land (CRUTEM) temperature anomalies


September 22, 2025 at 5:10 PM
And some visualisations are available here:
crudata.uea.ac.uk/~timo/diag/t...
including 12-month running means of global land+marine (HadCRUT) and global land (CRUTEM) temperature anomalies
crudata.uea.ac.uk/~timo/diag/t...
including 12-month running means of global land+marine (HadCRUT) and global land (CRUTEM) temperature anomalies
The update to Chinese station data makes a notable difference to the global land temperature data by making data for recent years more consistent with the historical data in the CRUTEM station database (which for China uses the mean of min & max temperature to represent the daily mean temperature)

September 22, 2025 at 5:10 PM
The update to Chinese station data makes a notable difference to the global land temperature data by making data for recent years more consistent with the historical data in the CRUTEM station database (which for China uses the mean of min & max temperature to represent the daily mean temperature)
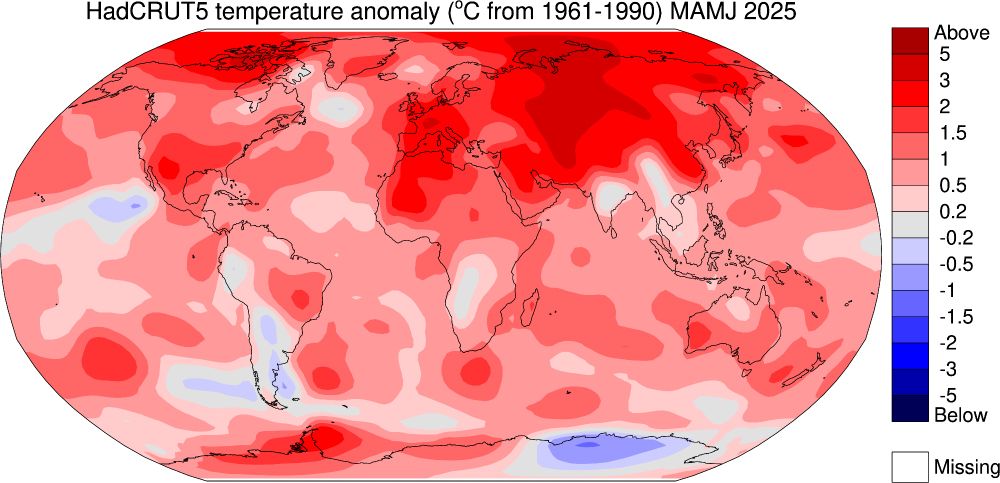
After a brief (ahem) hiatus, the HadCRUT5 global temperature dataset has now been updated to June 2025 by @metoffice.gov.uk @climateuea.bsky.social and @ncas-uk.bsky.social
September 22, 2025 at 5:10 PM
After a brief (ahem) hiatus, the HadCRUT5 global temperature dataset has now been updated to June 2025 by @metoffice.gov.uk @climateuea.bsky.social and @ncas-uk.bsky.social
There’s still time to visit “A Field Hospital for Eco-Anxiety”, open till 28 Sep. It’s an installation at National Trust’s Dunham Massey, put together by “Not here to be liked” including input from UEA / CRU PhD student Erik Hartin.
@nationaltrust.org.uk @climateuea.bsky.social @ueaenv.bsky.social
@nationaltrust.org.uk @climateuea.bsky.social @ueaenv.bsky.social

September 11, 2025 at 4:00 PM
There’s still time to visit “A Field Hospital for Eco-Anxiety”, open till 28 Sep. It’s an installation at National Trust’s Dunham Massey, put together by “Not here to be liked” including input from UEA / CRU PhD student Erik Hartin.
@nationaltrust.org.uk @climateuea.bsky.social @ueaenv.bsky.social
@nationaltrust.org.uk @climateuea.bsky.social @ueaenv.bsky.social
John has a knack for finding the heart of the issue and expressing it in understandable terms.

September 11, 2025 at 1:31 PM
John has a knack for finding the heart of the issue and expressing it in understandable terms.
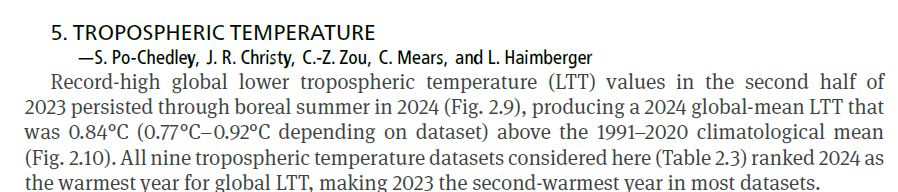
UAH *does* agree that 2024 was the hottest year on record. Here's is the excerpt on tropospheric temperature (co-author John Christy from the UAH team). Perhaps your eye is being drawn to the slightly lower temperatures so far in 2025?
August 15, 2025 at 10:35 AM
UAH *does* agree that 2024 was the hottest year on record. Here's is the excerpt on tropospheric temperature (co-author John Christy from the UAH team). Perhaps your eye is being drawn to the slightly lower temperatures so far in 2025?
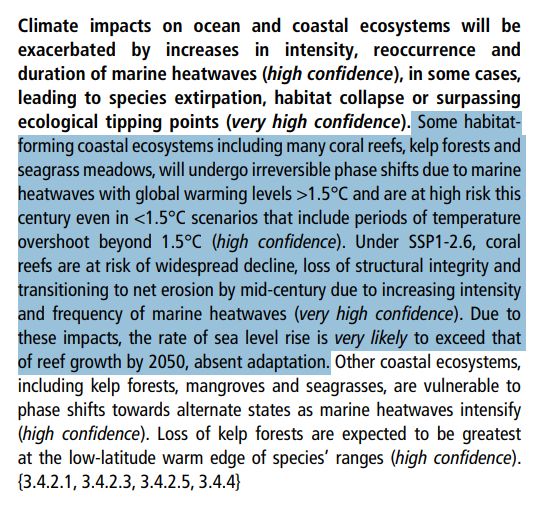
To conclude: climate warming poses a serious threat to coral reefs (as highlighted in IPCC AR6 WG2, text here). Record-breaking one-year declines are alarming and a central part of how the impact plays out, but longer-term records provide essential context and shouldn’t be omitted.
August 15, 2025 at 10:13 AM
To conclude: climate warming poses a serious threat to coral reefs (as highlighted in IPCC AR6 WG2, text here). Record-breaking one-year declines are alarming and a central part of how the impact plays out, but longer-term records provide essential context and shouldn’t be omitted.
Southern GBR: 31% one-year decline: “which drove regional coral cover [now at 26.9%] below the long-term average of 29.3%”

August 15, 2025 at 10:13 AM
Southern GBR: 31% one-year decline: “which drove regional coral cover [now at 26.9%] below the long-term average of 29.3%”
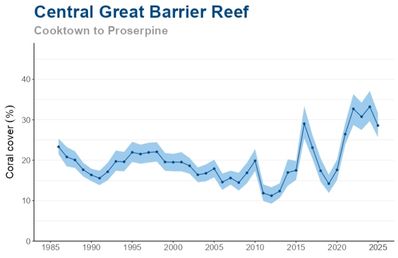
Central GBR: 14% one-year decline: “however, it [hard cover cover at 28.6%] is still above the long-term average of 19.8%”
August 15, 2025 at 10:13 AM
Central GBR: 14% one-year decline: “however, it [hard cover cover at 28.6%] is still above the long-term average of 19.8%”
Northern GBR: 25% one-year decline. “Despite this, coral cover [at 30%] remains above the long-term average of 26.6%.”

August 15, 2025 at 10:13 AM
Northern GBR: 25% one-year decline. “Despite this, coral cover [at 30%] remains above the long-term average of 26.6%.”
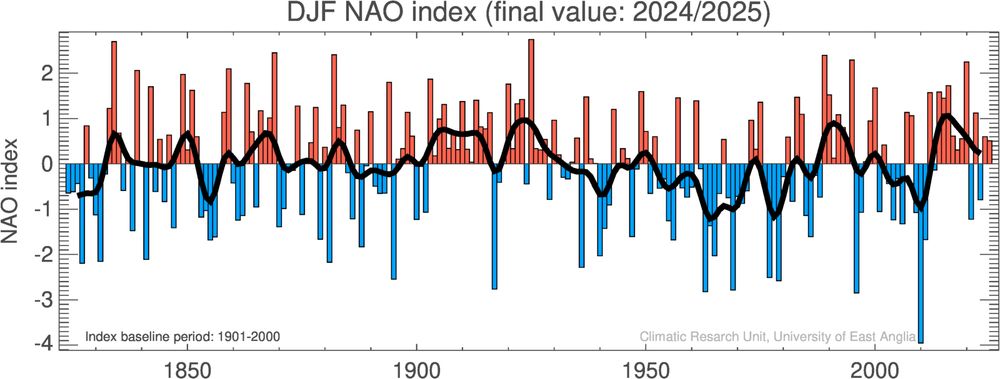
The "Jones" Gibraltar-Iceland NAO index now updated to June 2025. Data and viz here: crudata.uea.ac.uk/cru/data/nao/ @climateuea.bsky.social @ueaenv.bsky.social
August 14, 2025 at 9:55 AM
The "Jones" Gibraltar-Iceland NAO index now updated to June 2025. Data and viz here: crudata.uea.ac.uk/cru/data/nao/ @climateuea.bsky.social @ueaenv.bsky.social
Delighted to announce that Ben Santer is now an Honorary Professor @ueaenv.bsky.social & the Climatic Research Unit (CRU).
Ben is returning to his "academic home": he did his PhD in CRU before his stellar career developing "fingerprint" methods to identify human & natural effects on climate.
Ben is returning to his "academic home": he did his PhD in CRU before his stellar career developing "fingerprint" methods to identify human & natural effects on climate.

July 21, 2025 at 4:19 PM
Delighted to announce that Ben Santer is now an Honorary Professor @ueaenv.bsky.social & the Climatic Research Unit (CRU).
Ben is returning to his "academic home": he did his PhD in CRU before his stellar career developing "fingerprint" methods to identify human & natural effects on climate.
Ben is returning to his "academic home": he did his PhD in CRU before his stellar career developing "fingerprint" methods to identify human & natural effects on climate.
As always, @micefearboggis.bsky.social ‘s footnotes are worth reading diagrammonkey.wordpress.com/2025/05/04/n...
May 4, 2025 at 8:09 PM
As always, @micefearboggis.bsky.social ‘s footnotes are worth reading diagrammonkey.wordpress.com/2025/05/04/n...
The dry spring is showing up in low riverflows in the north of England, and parts of south and east England too.
My animation of the EA's weekly summaries from www.gov.uk/government/p...
My animation of the EA's weekly summaries from www.gov.uk/government/p...
May 2, 2025 at 3:40 PM
The dry spring is showing up in low riverflows in the north of England, and parts of south and east England too.
My animation of the EA's weekly summaries from www.gov.uk/government/p...
My animation of the EA's weekly summaries from www.gov.uk/government/p...
Norfolk-style dual carriageway

April 27, 2025 at 3:02 PM
Norfolk-style dual carriageway
UEA campus enjoying some sunshine

March 26, 2025 at 12:23 PM
UEA campus enjoying some sunshine
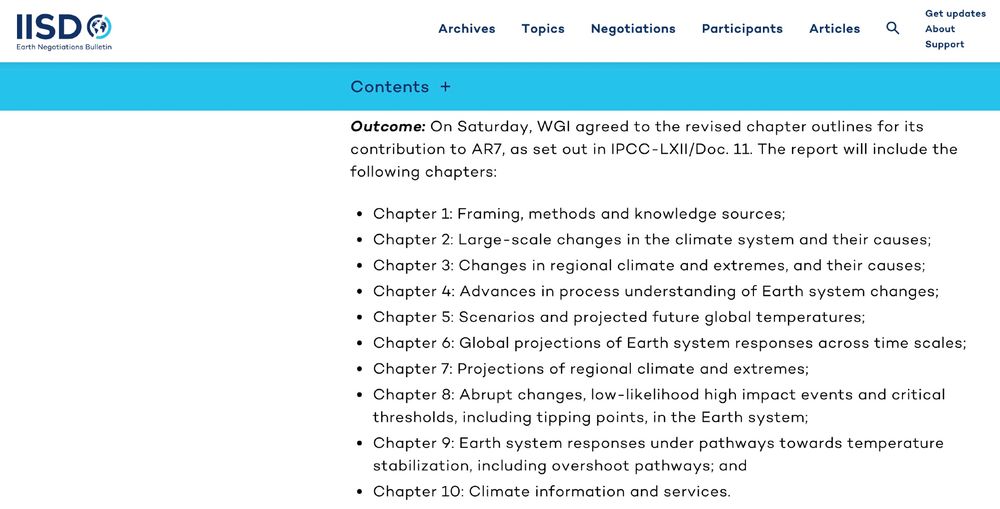
On Saturday, IPCC @ipcc.bsky.social agreed the chapter outlines for AR7 WGI. Do follow @enb.iisd.org to keep track of what happens at IPCC meetings, they provide useful and detailed reports enb.iisd.org/intergovernm...
March 5, 2025 at 10:43 AM
On Saturday, IPCC @ipcc.bsky.social agreed the chapter outlines for AR7 WGI. Do follow @enb.iisd.org to keep track of what happens at IPCC meetings, they provide useful and detailed reports enb.iisd.org/intergovernm...
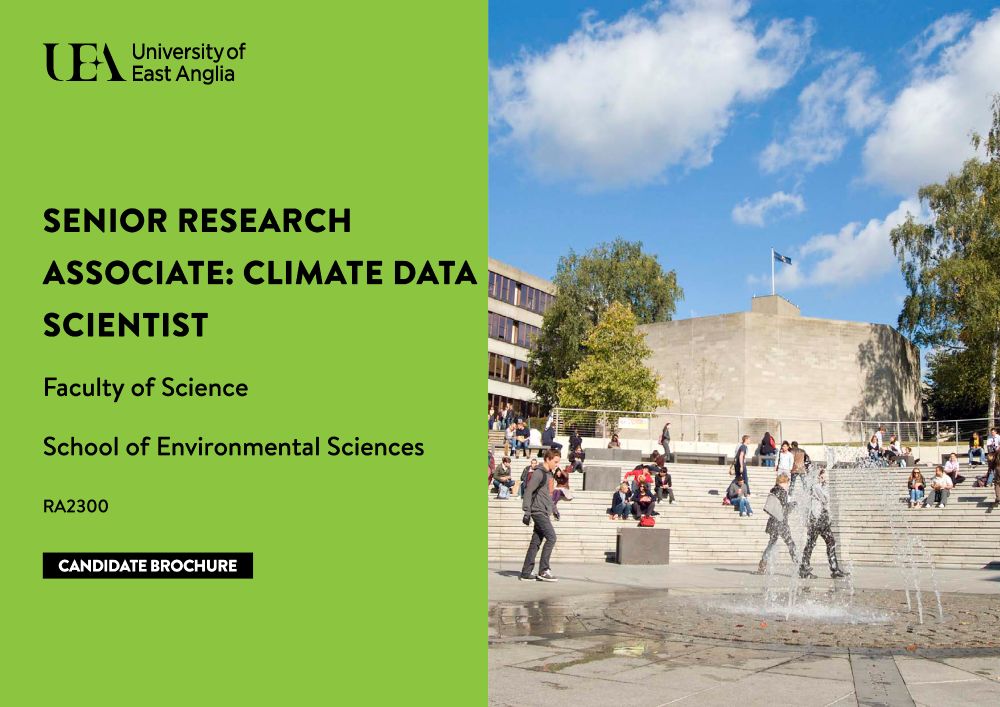
Do you want to work on improving some of the most widely used global climate datasets?
We are offering a 34-month research / climate data science post to further develop CRU TS and CRUTEM @climateuea.bsky.social @ncas-uk.bsky.social
vacancies.uea.ac.uk/vacancies/14...
We are offering a 34-month research / climate data science post to further develop CRU TS and CRUTEM @climateuea.bsky.social @ncas-uk.bsky.social
vacancies.uea.ac.uk/vacancies/14...
February 27, 2025 at 9:25 PM
Do you want to work on improving some of the most widely used global climate datasets?
We are offering a 34-month research / climate data science post to further develop CRU TS and CRUTEM @climateuea.bsky.social @ncas-uk.bsky.social
vacancies.uea.ac.uk/vacancies/14...
We are offering a 34-month research / climate data science post to further develop CRU TS and CRUTEM @climateuea.bsky.social @ncas-uk.bsky.social
vacancies.uea.ac.uk/vacancies/14...
Where has it warmed the most and the least?
Observed warming has not been uniform and matches well the pattern that climate models predict
1. Warming has been greatest over the northern polar regions
2. Warming is generally greater over land than over the oceans
Observed warming has not been uniform and matches well the pattern that climate models predict
1. Warming has been greatest over the northern polar regions
2. Warming is generally greater over land than over the oceans

January 10, 2025 at 4:19 PM
Where has it warmed the most and the least?
Observed warming has not been uniform and matches well the pattern that climate models predict
1. Warming has been greatest over the northern polar regions
2. Warming is generally greater over land than over the oceans
Observed warming has not been uniform and matches well the pattern that climate models predict
1. Warming has been greatest over the northern polar regions
2. Warming is generally greater over land than over the oceans
Now that all groups have released their 2024 global temperature data, here is a comparison of their timeseries and their 2024 values

January 10, 2025 at 4:07 PM
Now that all groups have released their 2024 global temperature data, here is a comparison of their timeseries and their 2024 values
In 2024, all four domains (NH land, NH ocean, SH land, SH ocean) had their warmest annual temperatures on record.
(Based on the CRUTEM and HadSST datasets that go into HadCRUT)
(Based on the CRUTEM and HadSST datasets that go into HadCRUT)


January 10, 2025 at 3:47 PM
In 2024, all four domains (NH land, NH ocean, SH land, SH ocean) had their warmest annual temperatures on record.
(Based on the CRUTEM and HadSST datasets that go into HadCRUT)
(Based on the CRUTEM and HadSST datasets that go into HadCRUT)