


Tal Gross
@talgross.bsky.social
Economist at Questrom School of Business, Boston University. Research Associate at the National Bureau of Economic Research. Co-author of "Better Health Economics: An Introduction for Everyone."
Bottom line: people behave as if their spouse’s plan is a default option. That’s a new peer-effect story — one that matters because the optimal insurance plan is person-specific. What’s right for your spouse may be wrong for you.
August 18, 2025 at 11:39 AM
Bottom line: people behave as if their spouse’s plan is a default option. That’s a new peer-effect story — one that matters because the optimal insurance plan is person-specific. What’s right for your spouse may be wrong for you.
But for about 38% of couples, the plan that’s cheapest for one spouse is not cheapest for the other. For them, insisting on a joint plan means leaving significant money on the table — sometimes hundreds of dollars per year.
August 18, 2025 at 11:39 AM
But for about 38% of couples, the plan that’s cheapest for one spouse is not cheapest for the other. For them, insisting on a joint plan means leaving significant money on the table — sometimes hundreds of dollars per year.
For most couples, the plan that minimizes household costs is also pretty good for each spouse individually.
Those couples could capture most possible savings simply by picking a better plan together — no need to split.
Those couples could capture most possible savings simply by picking a better plan together — no need to split.
August 18, 2025 at 11:39 AM
For most couples, the plan that minimizes household costs is also pretty good for each spouse individually.
Those couples could capture most possible savings simply by picking a better plan together — no need to split.
Those couples could capture most possible savings simply by picking a better plan together — no need to split.
How much money does “spousal following” actually cost?
We estimate overspending by comparing what people do spend in their chosen plan to what they would spend in their cost-minimizing plan.
We estimate overspending by comparing what people do spend in their chosen plan to what they would spend in their cost-minimizing plan.
August 18, 2025 at 11:39 AM
How much money does “spousal following” actually cost?
We estimate overspending by comparing what people do spend in their chosen plan to what they would spend in their cost-minimizing plan.
We estimate overspending by comparing what people do spend in their chosen plan to what they would spend in their cost-minimizing plan.
Humana introduced popular Walmart-branded plans. Younger spouses were more likely to pick them if their older spouse joined Medicare when the plan was available.
We study this using a regression-discontinuity design that exploits birth dates just before/after the new plans entered the market.
We study this using a regression-discontinuity design that exploits birth dates just before/after the new plans entered the market.

August 18, 2025 at 11:39 AM
Humana introduced popular Walmart-branded plans. Younger spouses were more likely to pick them if their older spouse joined Medicare when the plan was available.
We study this using a regression-discontinuity design that exploits birth dates just before/after the new plans entered the market.
We study this using a regression-discontinuity design that exploits birth dates just before/after the new plans entered the market.
We estimate that beneficiaries are willing to give up about $1,741/year to be on the same plan as their spouse – roughly 76% as much as they give up to avoid switching plans at all.
That’s a lot of money for what might just be administrative convenience.
That’s a lot of money for what might just be administrative convenience.
August 18, 2025 at 11:39 AM
We estimate that beneficiaries are willing to give up about $1,741/year to be on the same plan as their spouse – roughly 76% as much as they give up to avoid switching plans at all.
That’s a lot of money for what might just be administrative convenience.
That’s a lot of money for what might just be administrative convenience.
Over 70% of couples choose the exact same Part D plan. Even among couples whose drug needs are very different, the majority still pick the same plan. We create “placebo spouses” based on observables: <20% overlap.

August 18, 2025 at 11:39 AM
Over 70% of couples choose the exact same Part D plan. Even among couples whose drug needs are very different, the majority still pick the same plan. We create “placebo spouses” based on observables: <20% overlap.
We have novel data that allows us to link Medicare beneficiaries to their spouses. Now we can see, for the first time, how couples navigate this decision. Spoiler: They navigate it… together. Sometimes too much together.
August 18, 2025 at 11:39 AM
We have novel data that allows us to link Medicare beneficiaries to their spouses. Now we can see, for the first time, how couples navigate this decision. Spoiler: They navigate it… together. Sometimes too much together.
Economists have studied that question extensively. We know people often don’t pick the cheapest plan for them. We know inertia is huge. We know choice overload matters.
But no one has ever had the data to ask: What happens when you and your spouse both have to choose?
But no one has ever had the data to ask: What happens when you and your spouse both have to choose?
August 18, 2025 at 11:39 AM
Economists have studied that question extensively. We know people often don’t pick the cheapest plan for them. We know inertia is huge. We know choice overload matters.
But no one has ever had the data to ask: What happens when you and your spouse both have to choose?
But no one has ever had the data to ask: What happens when you and your spouse both have to choose?
Americans on traditional Medicare have to choose a Part D insurance plan for their drug coverage. There are about three-dozen plans and everyone has to choose one.
How does someone know which plan is the best for them?
How does someone know which plan is the best for them?
August 18, 2025 at 11:39 AM
Americans on traditional Medicare have to choose a Part D insurance plan for their drug coverage. There are about three-dozen plans and everyone has to choose one.
How does someone know which plan is the best for them?
How does someone know which plan is the best for them?
I talked to one person who recommended searching dissertation databases for all dissertations within two years of the candidate's that include the same key words.
August 13, 2025 at 4:26 PM
I talked to one person who recommended searching dissertation databases for all dissertations within two years of the candidate's that include the same key words.
I gave up on LyX a long time ago. Now, I just use Overleaf with co-authors or else a text editor on my own.
April 26, 2025 at 3:48 PM
I gave up on LyX a long time ago. Now, I just use Overleaf with co-authors or else a text editor on my own.
Here's a better way to write exams in TeX: github.com/talgross-bu/...
GitHub - talgross-bu/LaTeX-template-for-exams: A template to create paper exams with LaTeX
A template to create paper exams with LaTeX. Contribute to talgross-bu/LaTeX-template-for-exams development by creating an account on GitHub.
github.com
April 25, 2025 at 5:13 PM
Here's a better way to write exams in TeX: github.com/talgross-bu/...
I posted this thread on Twitter years ago, but I'm switching over to BlueSky. (Not unrelated, I'm proud to be driving a Hyundai EV.)
March 11, 2025 at 2:24 PM
I posted this thread on Twitter years ago, but I'm switching over to BlueSky. (Not unrelated, I'm proud to be driving a Hyundai EV.)
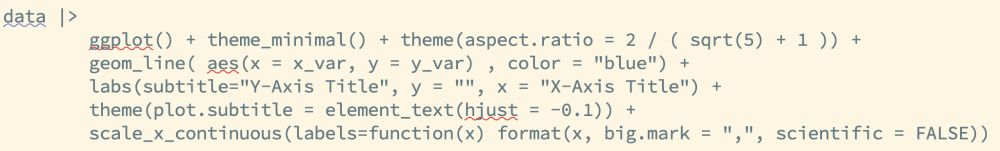
That's Stata, here's a start in R.
March 11, 2025 at 2:24 PM
That's Stata, here's a start in R.
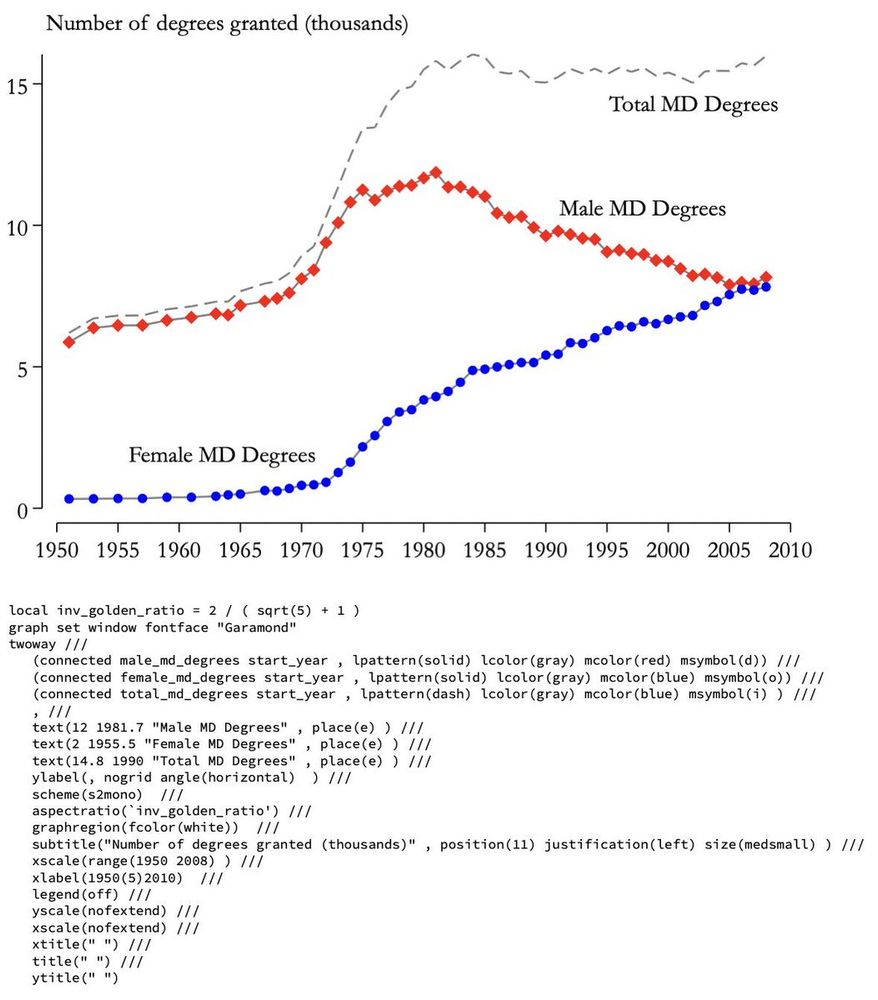
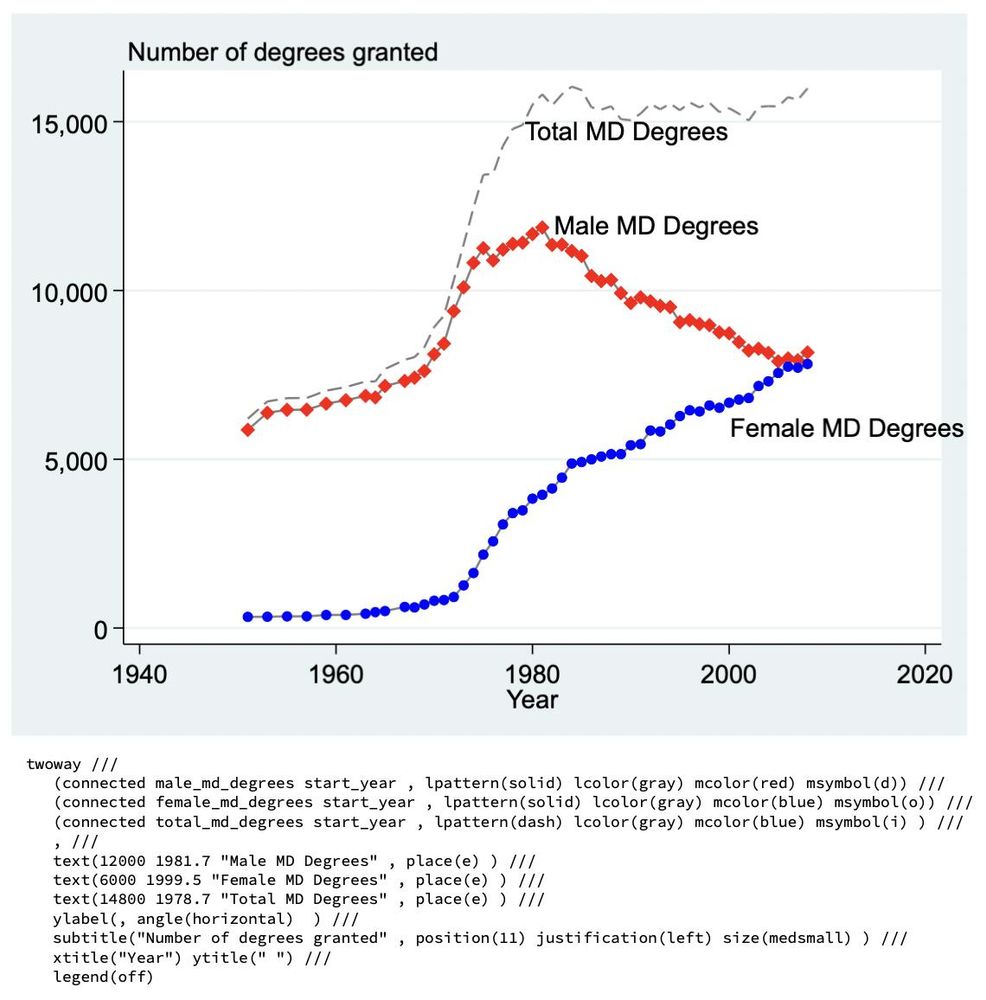
Step 3: eliminated unnecessary ink.
March 11, 2025 at 2:24 PM
Step 3: eliminated unnecessary ink.
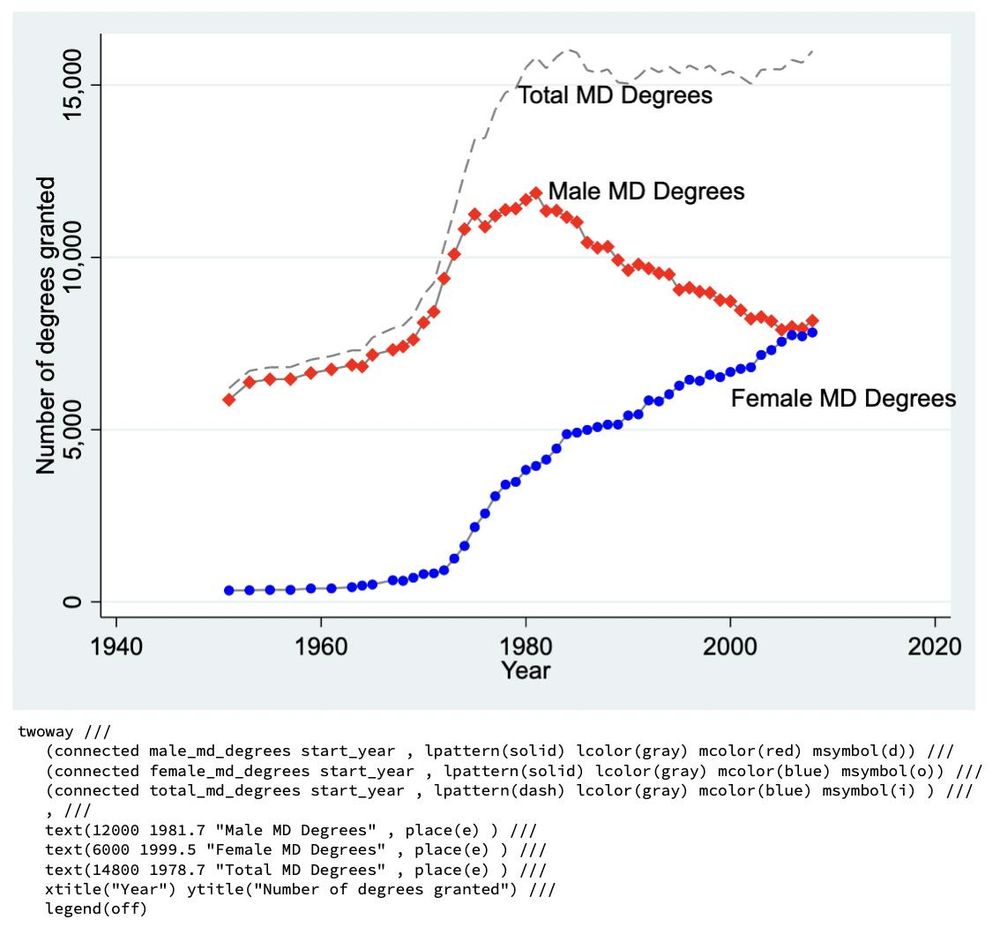
Step 2: all text horizontal. Horizontal text is easier to read than vertical text.
March 11, 2025 at 2:24 PM
Step 2: all text horizontal. Horizontal text is easier to read than vertical text.
Step 1: labels not legends. This makes the graph much easier to read.
March 11, 2025 at 2:24 PM
Step 1: labels not legends. This makes the graph much easier to read.
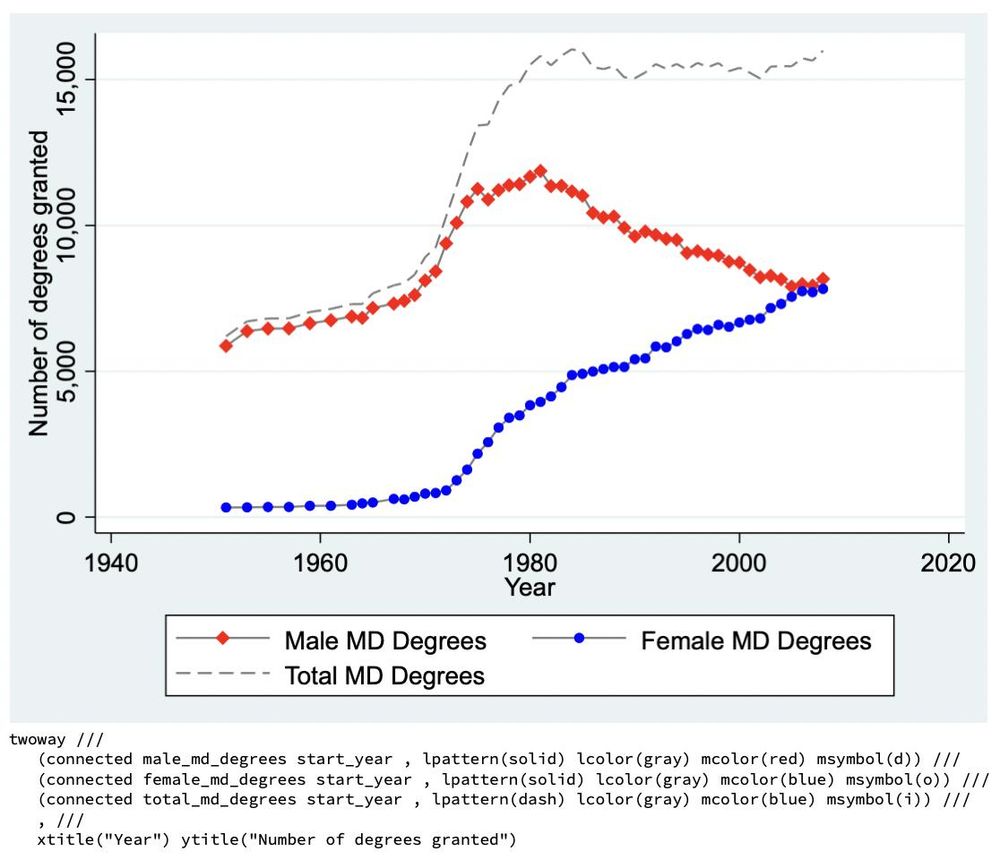
To start, here's a graph with the default Stata options.
March 11, 2025 at 2:24 PM
To start, here's a graph with the default Stata options.
…and in the age of generative AI, paper exams are all we have left.
February 24, 2025 at 1:16 PM
…and in the age of generative AI, paper exams are all we have left.