


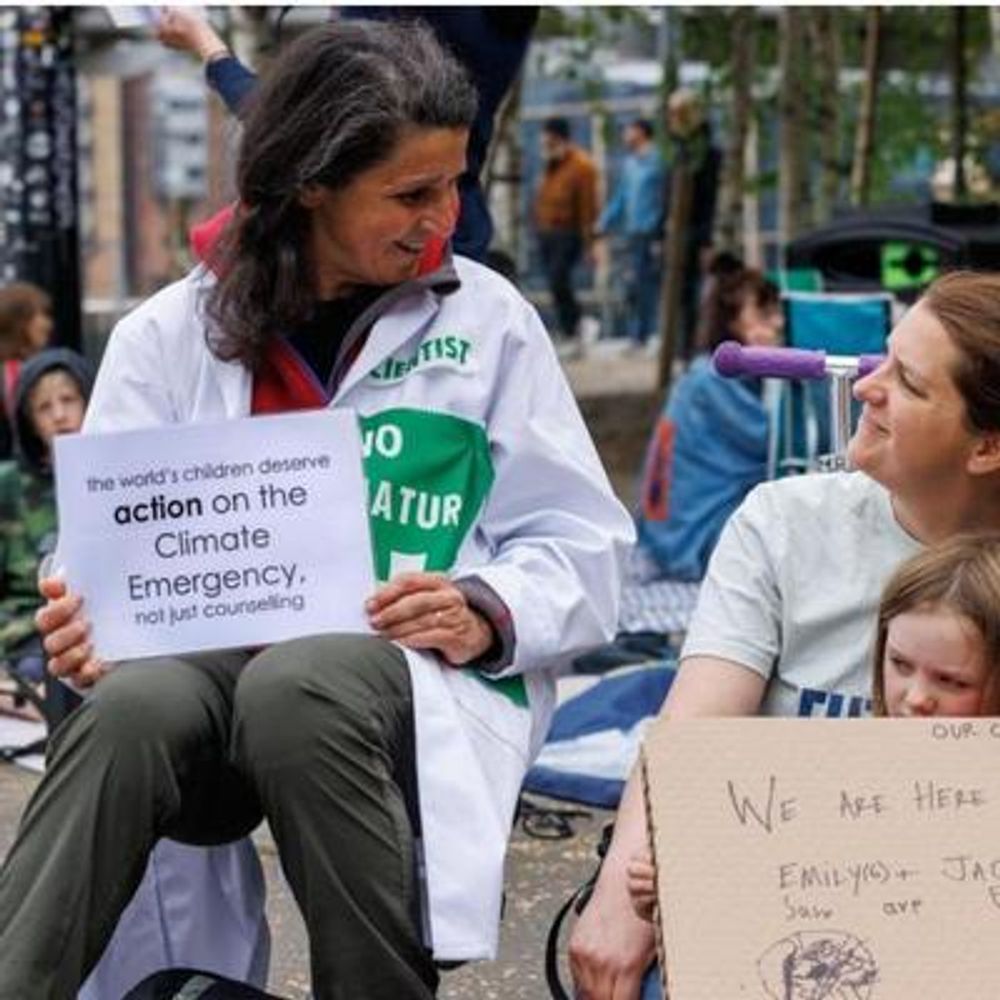
Dr Susi Arnott
@susiarnott.mastodon.green.ap.brid.gy
Biologist, former film-maker, scientist for XR. Climate Literacy handbook: https://bit.ly/CLNZine
London, UK, born here c.315ppm
🌉 bridged from ⁂ https://mastodon.green/@SusiArnott, follow @ap.brid.gy to interact
London, UK, born here c.315ppm
🌉 bridged from ⁂ https://mastodon.green/@SusiArnott, follow @ap.brid.gy to interact
Reposted by Dr Susi Arnott
"Scientists flew drones equipped with special kit through the exhaled droplets, or "blows", made when the giants come up to breathe through their blowholes.
They detected a highly infectious virus linked to mass strandings of whales and dolphins worldwide." […]
They detected a highly infectious virus linked to mass strandings of whales and dolphins worldwide." […]
Original post on mastodon.social
mastodon.social
December 26, 2025 at 5:20 PM
"Scientists flew drones equipped with special kit through the exhaled droplets, or "blows", made when the giants come up to breathe through their blowholes.
They detected a highly infectious virus linked to mass strandings of whales and dolphins worldwide." […]
They detected a highly infectious virus linked to mass strandings of whales and dolphins worldwide." […]
Bizarre reading this while James Dyson boosterises on BBC Radio4
"...I will hand over my small phone-charging project to my younger brother Anas, whose dream is to become a journalist, to tell the truth about Gaza and its people..."
https://aje.io/t5g0f4
"...I will hand over my small phone-charging project to my younger brother Anas, whose dream is to become a journalist, to tell the truth about Gaza and its people..."
https://aje.io/t5g0f4

Israel killed our dreams, but its genocide could not defeat us
I dreamed of becoming a teaching assistant; now I am charging phones for a living. But I refuse to give up.
www.aljazeera.com
December 26, 2025 at 9:06 AM
Bizarre reading this while James Dyson boosterises on BBC Radio4
"...I will hand over my small phone-charging project to my younger brother Anas, whose dream is to become a journalist, to tell the truth about Gaza and its people..."
https://aje.io/t5g0f4
"...I will hand over my small phone-charging project to my younger brother Anas, whose dream is to become a journalist, to tell the truth about Gaza and its people..."
https://aje.io/t5g0f4
"The graduates had studied and sat for examinations while working nonstop inside Gaza’s hospitals during two years of starvation, displacement and genocide. Some were also injured, arrested or had family members killed."
https://aje.io/5gkk3a
https://aje.io/5gkk3a

Palestinian doctors graduate in ruins of Gaza’s destroyed al-Shifa Hospital
Ceremony held at hospital destroyed by Israel highlights toll of two-year war on Gaza's medical system.
www.aljazeera.com
December 26, 2025 at 8:59 AM
"The graduates had studied and sat for examinations while working nonstop inside Gaza’s hospitals during two years of starvation, displacement and genocide. Some were also injured, arrested or had family members killed."
https://aje.io/5gkk3a
https://aje.io/5gkk3a
Reposted by Dr Susi Arnott
RE: https://mastodon.social/@sellathechemist/115776602957475252
That she should have suspended her hunger strike brings relief but little comfort. There are some who accuse her and fellow strikers of being performative. But I’m not sure that the British government comes out of this looking […]
That she should have suspended her hunger strike brings relief but little comfort. There are some who accuse her and fellow strikers of being performative. But I’m not sure that the British government comes out of this looking […]
December 25, 2025 at 4:48 PM
RE: https://mastodon.social/@sellathechemist/115776602957475252
That she should have suspended her hunger strike brings relief but little comfort. There are some who accuse her and fellow strikers of being performative. But I’m not sure that the British government comes out of this looking […]
That she should have suspended her hunger strike brings relief but little comfort. There are some who accuse her and fellow strikers of being performative. But I’m not sure that the British government comes out of this looking […]
We not shoot, you not shoot, to the tune of Silent Night...
https://p.dw.com/p/55c22
https://p.dw.com/p/55c22

The Christmas truce of 1914: When the guns fell silent – DW – 12/24/2025
On Christmas Eve 1914, battling German and British soldiers laid down their arms and sang Christmas carols together — a brief moment of peace in the midst of war.
www.dw.com
December 25, 2025 at 11:14 AM
We not shoot, you not shoot, to the tune of Silent Night...
https://p.dw.com/p/55c22
https://p.dw.com/p/55c22
Thanks for a great episode today! #climatequestion #ClimateLiteracy #scicomm
@akshatrathi
@BBCRadio4
https://www.bbc.co.uk/sounds/play/w3ct702z
@akshatrathi
@BBCRadio4
https://www.bbc.co.uk/sounds/play/w3ct702z

The Climate Question - Q&A: The jobs of the future, nitrous oxide, ice cores - BBC Sounds
Your questions on green careers, temperature predictions and dating ancient ice cores
www.bbc.co.uk
December 24, 2025 at 10:04 AM
Thanks for a great episode today! #climatequestion #ClimateLiteracy #scicomm
@akshatrathi
@BBCRadio4
https://www.bbc.co.uk/sounds/play/w3ct702z
@akshatrathi
@BBCRadio4
https://www.bbc.co.uk/sounds/play/w3ct702z
"...Daily Mail published an article around the time of the 2019 youth climate strike headlined: “Net zero hero! How being carbon neutral will help the planet”. Fast forward to 2024, and in September the Mail published the headline “Bonkers’ net-zero target could cost 1 MILLION jobs, union chief […]
Original post on mastodon.green
mastodon.green
December 24, 2025 at 9:39 AM
"...Daily Mail published an article around the time of the 2019 youth climate strike headlined: “Net zero hero! How being carbon neutral will help the planet”. Fast forward to 2024, and in September the Mail published the headline “Bonkers’ net-zero target could cost 1 MILLION jobs, union chief […]
From #trudiwarner (of Jury equity fame)

December 24, 2025 at 9:18 AM
From #trudiwarner (of Jury equity fame)

World Service - Listen Live - BBC Sounds
Listen live to World Service on BBC Sounds
www.bbc.co.uk
December 23, 2025 at 11:58 AM
Best time for some #ClimateAction keeps whizzing past us -
https://news.sky.com/story/2025-on-track-to-be-uks-warmest-year-on-record-says-met-office-13486920
https://news.sky.com/story/2025-on-track-to-be-uks-warmest-year-on-record-says-met-office-13486920
December 23, 2025 at 7:38 AM
Best time for some #ClimateAction keeps whizzing past us -
https://news.sky.com/story/2025-on-track-to-be-uks-warmest-year-on-record-says-met-office-13486920
https://news.sky.com/story/2025-on-track-to-be-uks-warmest-year-on-record-says-met-office-13486920
"According to an opinion poll conducted in January, the vast majority of Greenland’s 57,000 people want to become independent from Denmark, but they do not wish to become part of the US" - terrifying to think how they could be occupied, militarily or financially?
https://aje.io/6dh8rm
https://aje.io/6dh8rm

‘We have to have it’: Trump renews push for Greenland as Denmark protests
US president cites national security as rationale for his efforts to take control of the self-governing Arctic island.
www.aljazeera.com
December 23, 2025 at 7:34 AM
"According to an opinion poll conducted in January, the vast majority of Greenland’s 57,000 people want to become independent from Denmark, but they do not wish to become part of the US" - terrifying to think how they could be occupied, militarily or financially?
https://aje.io/6dh8rm
https://aje.io/6dh8rm
"Seven years after XRUK first called for urgent climate action, a rapid transition away from fossil fuels, and citizen-led decision-making, none of those demands has been met, and the window to keep global heating below 1.5°C has now passed..."
@news_en #mediatellthetruth […]
@news_en #mediatellthetruth […]
Original post on mastodon.green
mastodon.green
December 22, 2025 at 10:57 PM
"Seven years after XRUK first called for urgent climate action, a rapid transition away from fossil fuels, and citizen-led decision-making, none of those demands has been met, and the window to keep global heating below 1.5°C has now passed..."
@news_en #mediatellthetruth […]
@news_en #mediatellthetruth […]
This is perverse, even in its own terms of military security (and what constitutes 'winning the AI race', anyway?)
"... suspension will threaten grid reliability for its Virginia customers, including military bases..."
https://aje.io/7yys0e
"... suspension will threaten grid reliability for its Virginia customers, including military bases..."
https://aje.io/7yys0e

Trump pauses more offshore wind projects citing national security concerns
The directive pausing five projects comes as the administration ramps up offshore oil and gas production.
www.aljazeera.com
December 22, 2025 at 6:29 PM
This is perverse, even in its own terms of military security (and what constitutes 'winning the AI race', anyway?)
"... suspension will threaten grid reliability for its Virginia customers, including military bases..."
https://aje.io/7yys0e
"... suspension will threaten grid reliability for its Virginia customers, including military bases..."
https://aje.io/7yys0e
Terrible news - what are #uklabour thinking of? #transportforlondon #banprivatecars #planetarywellbeing
https://www.theguardian.com/technology/2025/dec/22/chinese-robotaxis-due-in-london-next-year-as-lyft-and-uber-reveal-tie-ups
https://www.theguardian.com/technology/2025/dec/22/chinese-robotaxis-due-in-london-next-year-as-lyft-and-uber-reveal-tie-ups

Chinese robotaxis due in London next year as Lyft and Uber reveal tie-ups
Firms agree deals with Beijing-based Baidu to take self-driving cabs to UK capital
www.theguardian.com
December 22, 2025 at 2:11 PM
"...Palestinians are beyond doubt an occupied people in international law, and equally beyond doubt an occupied people have the right of armed resistance.
To state that the Palestinians have the right of armed resistance in international law is not in the least controversial as a statement of […]
To state that the Palestinians have the right of armed resistance in international law is not in the least controversial as a statement of […]
Original post on mastodon.green
mastodon.green
December 22, 2025 at 12:00 PM
"...Palestinians are beyond doubt an occupied people in international law, and equally beyond doubt an occupied people have the right of armed resistance.
To state that the Palestinians have the right of armed resistance in international law is not in the least controversial as a statement of […]
To state that the Palestinians have the right of armed resistance in international law is not in the least controversial as a statement of […]
Love this blog; here's a beautiful mix of detailed observation and conceptual digression #scicomm #algae #dataviz #martynkelly #lifeonearth
https://microscopesandmonsters.wordpress.com/2025/12/22/eye-to-the-microscope/
https://microscopesandmonsters.wordpress.com/2025/12/22/eye-to-the-microscope/

Eye to the microscope …
_The eye always knows more than it sees. Kenneth Clark_
I have been watching the weather forecast and the river levels closely for the past three weeks, trying to find a window of opportunity when I can get back to the Lake District for some fieldwork. Each pulse of heavy rain over this period has sent river levels to a point where entering the river would be foolhardy then, just as levels drop towards a workable point, the next weather front arrives, and the rivers are in spate again. The longer this cycle of wet weather and high flows persists, the more curious I become about the effects this is having on the algal communities in rivers and streams in this area, which just adds to the frustration.
Meanwhile, I am busy rearranging schedules to make the most of the time when I should have been out on fieldwork, and also taking the opportunity to reflect on some of the patterns that I have recorded from these sites in the past. I have just been reading about how Anton van Leeuwenhoek pioneered new ways of “seeing” in the 17th century through his use of microscopes to explore a hitherto completely unknown and invisible world in his local ponds. Yet another way of “seeing” emerged just over a century later when William Playfair started using graphs as ways of presenting information. The microscope, by itself, is a fine way of exploring the here and now but graphs, in their many and varied forms, let us take those immediate sensations and compare them with observations at other locations, or at the same place over preceding months and years.
Whether Van Leeuwenhoek would have embraced graphs is a moot point. The impression I get from his biographies is that he was extremely curious but had a relatively short attention span and was forever flitting between subjects that caught his imagination (see: “The invention of microscopy …”). He was curious in the same way as the explorers of his age who were travelling to the far-flung corners of the world, rather than in the theory-driven sense of science emerging at the same time through he work of Descartes and Bacon. In a way, graphs brings these two approaches together because you can not only marvel at the world the microscope reveals, you can also wonder at the changes you see in these observations in space and time and speculate about causes and consequences.
We live in an age where Cartesian hypothesis-driven science prevails but sometimes there is a place for doodling in R Studio and seeing where your curiosity takes you. So, confined to base by the vagaries of the weather, I made a mental journey back to Croasdale Beck (see “Sick note …” and links therein). Many of the stones on the bed of this turbulent stream have dark brown or black patches of a Cyanobacterium _Chamaesiphon fuscus_ (see: “Spotting spots …”) and we have often noticed, whilst out in the field, that our BenthoTorch (portable fluorimeter) records more diatoms on stones with obvious Cyanobacterial crusts than it does on those that are bare.
This observation is largely substantiated by the patterns we have recorded over the past decade. First, the quantity of _Chamaesiphon_ in Croasdale Beck shows a distinct seasonal trend with more biomass recorded in the summer. This is interesting because our estimates of the cover of Cyanobacterial crusts do not tend to fluctuate, so they must be getting thicker and thinner as seasons change. Second, the quantity of diatoms seems to show a dependency on the amount of Cyanobacteria measured on the same stone.
**Left hand graph: annual trends in the abundance of Cyanobacteria (measured as chlorophyll concentration) in Croasdale Beck between 2015 and 2025; right hand graph: relationship between abundance of Cyanbacteria and diatoms in Croasdale Beck. Diagonal line indicates 1:1 slope (i.e. equivalent concentrations of both groups). The photograph at the top of the post shows Croasdale Beck in April 2025.**
What we may be seeing is diatoms taking advantage of the way that the _Chamaesiphon_ alters the substrate. One possibility is that, by creating texture across an otherwise flat cobble, _Chamaesiphon_ creates opportunities for the diatoms to escape the constant mechanical stress exerted by the current. A second possibility is that the habitat they create is less conducive to the marauding invertebrate grazers that we know are abundant in this stream (see: “Curried diatoms …” and “Mayfly mayhem …”). Maybe _Chamaesiphon_ is producing toxins that serve as deterrents (there are a few hints in the literature suggesting that _Chamaesiphon_ does produce such toxins, but no unambiguous evidence. However, this capacity is widespread within the Cyanobacteria so it must be a possibility).
This interaction between diatoms and _Chamaesiphon_ may explain some of the patterns that I described in “Entrances and Exits …” where diatoms with a high-profile habitat were more abundant in the summer, which is counterintuitive in a stream where we often see grazing invertebrates. It is possible that the _Chamaesiphon_ creates patchiness in the habitat at a finer scale than most biologists typically sample stream algae. The next two diagrams, then, show what I think may be happening; first, inside a _Chamaesiphon_ patch where _Fragilara gracilis_ and _Meridion constriction_ are nestled amongst the cells and, then, a wider view showing low-profile diatoms (_Achnanthidium_ spp. and _Cocconeis lineata_) growing alongside the _Chamaesiphon_ crust.
**A schematic diagram showing how _Chamaesiphon fuscus_ may create microenvironments for diatoms (_Fragilaria gracilis_ and _Meridion constrictum_) to thrive in turbulent stream habitats.**
There is quite a lot of conjecture in this because it is difficult to recreate the higher level structure of the algal community on a stream bed from what we see under a microscope (see: “Imagined but not imaginary”). The _Chamaesiphon_ species that live as crusts are particularly difficult to observe to the point where the three “standard works” that I consulted (Desikachery ‘s _Cyanophyta_ from 1959; Brian Whitton’s chapter in the _Freshwater Algal Flora of the British Isles,_ 2011,__ and Komárek & Anagnostidis’s revision of the _Süsswasserflora von Mitteleuropa_ from 1999) all rely on the same drawings in Lothar Geitler’s first edition of the _Susswasserflora_ dating from 1925.
Playfair’s inventions ushered in a new era for science, one that meant that we were no longer constrained by the forms of the organisms we are studying. At the same time, though, he introduced abstraction to scientific thought process, with reality described by patterns on graphs rather than by tangible phenomena. This unlocked a whole range of possibilities, many of which I use in my work. It does mean, however, that we sometimes forget to “see” in the way that van Leeuwenhoek understood, at all.
**An alternative visualisation of the relationship between _Chamaesiphon fuscus_ and diatoms in a turbulent stream such as Croasdale Beck. The _Chamaesiphon_ on the right hand side creates physical shelter and, possibly, an unfavourable habitat for grazing invertebrates. On the left-hand side, an assemblage of diatoms typical of grazed habitats (_Achnanthidium_ spp and _Cocconeis lineata_) develops.**
Some other highlights from the past week (or so):
**Wrote this while listening to:**. Rosalia’s _El Mal Querer_ and _Lux_. Flamenco (hint of Fado, too, perhaps?) meets electronica meets rap meets …
**Currently reading:** NoViolet Bulawayo’s Glory. An _Animal Farm_ -type allegory of recent Zimbabwean history.
**Cultural highlight:** the film _Manchester By The Sea_ on Netflix.
**Culinary highlight:** trial runs for Christmas week cooking.
### Share this:
* Click to share on X (Opens in new window) X
* Click to share on Facebook (Opens in new window) Facebook
*
Like Loading...
### _Related_
microscopesandmonsters.wordpress.com
December 22, 2025 at 9:29 AM
Love this blog; here's a beautiful mix of detailed observation and conceptual digression #scicomm #algae #dataviz #martynkelly #lifeonearth
https://microscopesandmonsters.wordpress.com/2025/12/22/eye-to-the-microscope/
https://microscopesandmonsters.wordpress.com/2025/12/22/eye-to-the-microscope/
Reposted by Dr Susi Arnott

December 21, 2025 at 4:44 PM
"We cannot shift the balance of power back towards workers and citizens, rather than bosses and corporations, if the arms of state tasked with enforcing the rules are atrophied to the point of impotence (a sharp contrast to the ever-greater repressive powers granted the police over protest […]
Original post on mastodon.green
mastodon.green
December 21, 2025 at 9:55 AM
"We cannot shift the balance of power back towards workers and citizens, rather than bosses and corporations, if the arms of state tasked with enforcing the rules are atrophied to the point of impotence (a sharp contrast to the ever-greater repressive powers granted the police over protest […]
Israeli human rights organisation, B’Tselem, said, according to official figures from the Israel Prison Service, about 10,900 Palestinians were being held in Israeli prisons or detention facilities on “security” grounds as of late 2025
#hostages #palestine #israel
https://aje.io/h31wzv
#hostages #palestine #israel
https://aje.io/h31wzv

Vigil in London for Palestinian prisoners held in Israel
Dozens of people gathered in central London on Saturday calling for the release of Palestinian prisoners held in Israel.
www.aljazeera.com
December 21, 2025 at 8:40 AM
Israeli human rights organisation, B’Tselem, said, according to official figures from the Israel Prison Service, about 10,900 Palestinians were being held in Israeli prisons or detention facilities on “security” grounds as of late 2025
#hostages #palestine #israel
https://aje.io/h31wzv
#hostages #palestine #israel
https://aje.io/h31wzv
"...Israel expanded its occupation of southern Syria following the ousting of President Bashar al-Assad in December 2024..." afaik #israel has behaved as if
#golanheights was part of their country for over 40 years #roguenation
https://aje.io/clyf0e
#golanheights was part of their country for over 40 years #roguenation
https://aje.io/clyf0e

Israel launches new raids in Syria’s Quneitra, establishes checkpoints
Syrian state television denounces the Israeli incursion as another violation of the nation's sovereignty.
www.aljazeera.com
December 20, 2025 at 6:21 PM
"...Israel expanded its occupation of southern Syria following the ousting of President Bashar al-Assad in December 2024..." afaik #israel has behaved as if
#golanheights was part of their country for over 40 years #roguenation
https://aje.io/clyf0e
#golanheights was part of their country for over 40 years #roguenation
https://aje.io/clyf0e
Reposted by Dr Susi Arnott
Hype.
No form of CO₂ removal is a climate solution as long as we’re still releasing >40 billion tonnes of CO₂ every year from fossil fuel burning.
https://www.winnipegfreepress.com/breakingnews/2025/12/19/hope-or-hype
No form of CO₂ removal is a climate solution as long as we’re still releasing >40 billion tonnes of CO₂ every year from fossil fuel burning.
https://www.winnipegfreepress.com/breakingnews/2025/12/19/hope-or-hype
December 20, 2025 at 4:30 PM
Hype.
No form of CO₂ removal is a climate solution as long as we’re still releasing >40 billion tonnes of CO₂ every year from fossil fuel burning.
https://www.winnipegfreepress.com/breakingnews/2025/12/19/hope-or-hype
No form of CO₂ removal is a climate solution as long as we’re still releasing >40 billion tonnes of CO₂ every year from fossil fuel burning.
https://www.winnipegfreepress.com/breakingnews/2025/12/19/hope-or-hype
"Israeli officials have previously openly stated that they support what they have termed the “voluntary emigration” of Palestinians from Gaza, in what effectively would be their forced evacuation."
https://aje.io/lcxq2u
https://aje.io/lcxq2u

Al-Majd Europe: The shell company involved in forced evacuations from Gaza
Al Jazeera investigators uncover a trail of covert flights and shady figures associated with front group Al-Majd Europe.
www.aljazeera.com
December 20, 2025 at 10:28 AM
"Israeli officials have previously openly stated that they support what they have termed the “voluntary emigration” of Palestinians from Gaza, in what effectively would be their forced evacuation."
https://aje.io/lcxq2u
https://aje.io/lcxq2u
"I travelled to New York to represent UCL at the SDSN UK Leadership Council. Our discussions focused on climate action, biodiversity, and the role of universities in driving systemic change" - presumably travelling by sailing boat #drivingglobalsustainability #talkingthetalk […]
Original post on mastodon.green
mastodon.green
December 20, 2025 at 8:18 AM
"I travelled to New York to represent UCL at the SDSN UK Leadership Council. Our discussions focused on climate action, biodiversity, and the role of universities in driving systemic change" - presumably travelling by sailing boat #drivingglobalsustainability #talkingthetalk […]
Wow! #ukpolitics #EcologicalEmergency
"The resolution recognised the link between the nature crisis and the climate emergency, and the essential role of environmental protection in sustainable development."
https://www.rother.gov.uk/news/rother-declares-nature-emergency/
"The resolution recognised the link between the nature crisis and the climate emergency, and the essential role of environmental protection in sustainable development."
https://www.rother.gov.uk/news/rother-declares-nature-emergency/

Rother declares nature emergency
Biodiversity will be boosted across Rother after the District formally declared a nature emergency.
www.rother.gov.uk
December 19, 2025 at 10:34 PM
Wow! #ukpolitics #EcologicalEmergency
"The resolution recognised the link between the nature crisis and the climate emergency, and the essential role of environmental protection in sustainable development."
https://www.rother.gov.uk/news/rother-declares-nature-emergency/
"The resolution recognised the link between the nature crisis and the climate emergency, and the essential role of environmental protection in sustainable development."
https://www.rother.gov.uk/news/rother-declares-nature-emergency/