


Daniel 🕹️
@strengejacke.de
He/she/it - 's' muss mit.
We're lower than the world!
R easystats project:
https://easystats.github.io/easystats/
We're lower than the world!
R easystats project:
https://easystats.github.io/easystats/

This weekend I dug out my very old #starwars #ccg cards (decipher) because my son really wanted to play the game. Now I'm thinking about checking out Star Wars Unlimited, because it's no longer easy to get cards for the CCG. Anyone experience with Star Wars Unlimited? Would you recommend it? #tcg

September 8, 2025 at 5:30 AM

If this is not of particular interest, i.e. you're not investigating "treatment methods", I'd suggest adding "hospital ID" as random effect. As said before, in the "worst case", we end up with the same accuracy as for simpler models (that's again Gelman/Hill 2007)

September 3, 2025 at 8:42 AM
If this is not of particular interest, i.e. you're not investigating "treatment methods", I'd suggest adding "hospital ID" as random effect. As said before, in the "worst case", we end up with the same accuracy as for simpler models (that's again Gelman/Hill 2007)
from: Douglas M. Bateslme4: Mixed-effects modeling
with R
with R

September 3, 2025 at 8:33 AM
from: Douglas M. Bateslme4: Mixed-effects modeling
with R
with R
This is how table printing in #easystats look like - nice tables out-of-the-box thanks to #rstats packages like {gt} or {tinytable}, which is now fully supported across easystats📦

September 1, 2025 at 6:21 AM
This is how table printing in #easystats look like - nice tables out-of-the-box thanks to #rstats packages like {gt} or {tinytable}, which is now fully supported across easystats📦

paramters::model_parameters() has the `ci_method` argument with similar options . however, broom.mixed returns NA for Wald-CIs?

August 6, 2025 at 9:17 PM
paramters::model_parameters() has the `ci_method` argument with similar options . however, broom.mixed returns NA for Wald-CIs?

- modern look'n'feel
- fully customizable layout
- absolutely easy to handle GitHub integration
- code assist / LLM integration, if desired
- rather simple and intuitive UI
- hide/show relevant panes with a keystroke
What's not to like about it? 😎
- fully customizable layout
- absolutely easy to handle GitHub integration
- code assist / LLM integration, if desired
- rather simple and intuitive UI
- hide/show relevant panes with a keystroke
What's not to like about it? 😎
August 2, 2025 at 7:06 AM
- modern look'n'feel
- fully customizable layout
- absolutely easy to handle GitHub integration
- code assist / LLM integration, if desired
- rather simple and intuitive UI
- hide/show relevant panes with a keystroke
What's not to like about it? 😎
- fully customizable layout
- absolutely easy to handle GitHub integration
- code assist / LLM integration, if desired
- rather simple and intuitive UI
- hide/show relevant panes with a keystroke
What's not to like about it? 😎
After several years, I noticed that the first author of a co-authored article had corrected what he believed to be a ‘spelling mistake’ in the name of an R package.
July 17, 2025 at 1:15 PM
After several years, I noticed that the first author of a co-authored article had corrected what he believed to be a ‘spelling mistake’ in the name of an R package.
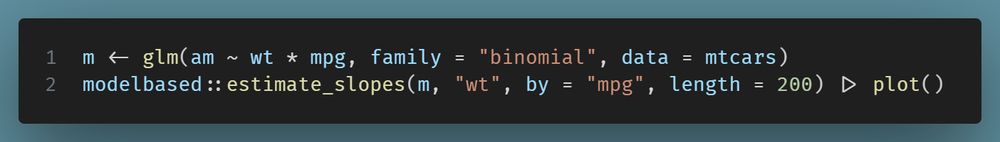
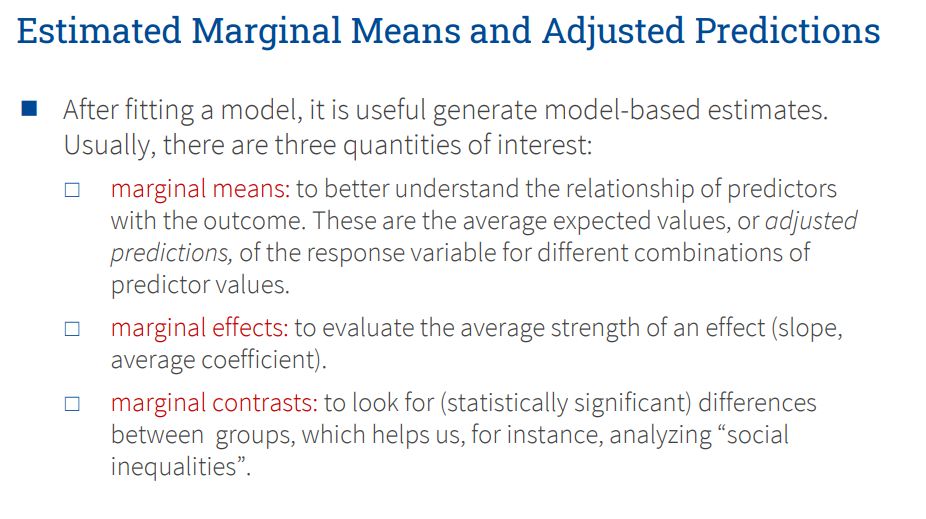
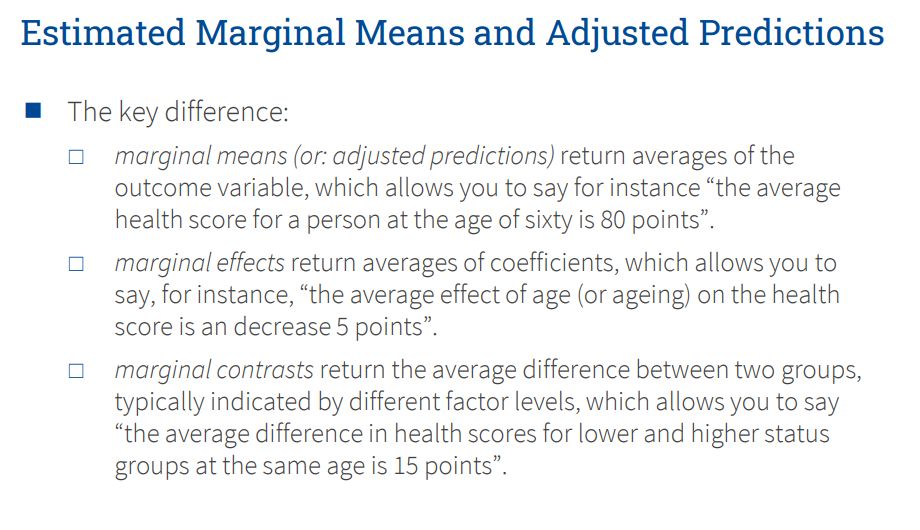
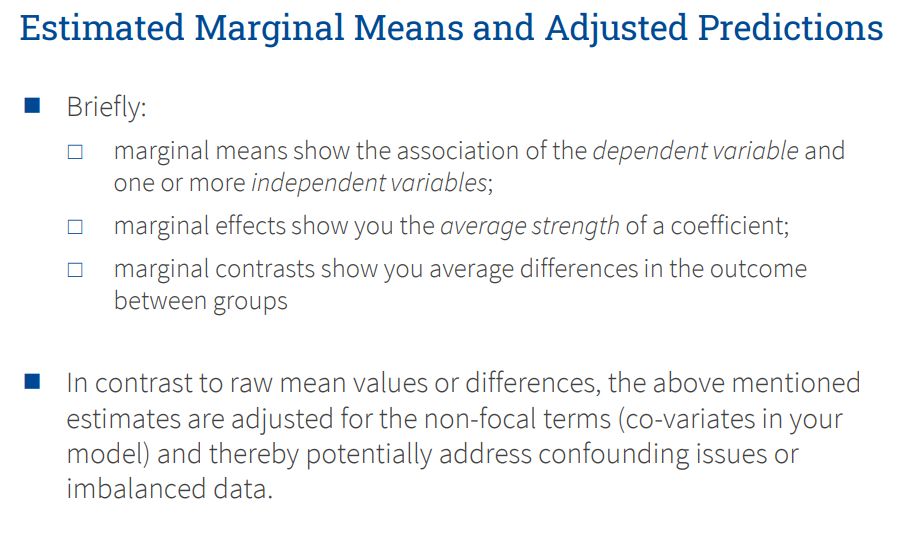
See the slides 21-23 from "Introduction into predictions and the {modelbased} package", where I tried to write up my understanding/definition: easystats.github.io/easystats/ar...
July 17, 2025 at 12:53 PM
See the slides 21-23 from "Introduction into predictions and the {modelbased} package", where I tried to write up my understanding/definition: easystats.github.io/easystats/ar...
That's ("answer is indeed ME") probably a too fast conclusion (depending on what you mean by "marginal effects" - if a single number, that's not always a good idea. In this example, we used cubic age, and the interpretation makes sense... 1/2

July 8, 2025 at 12:32 PM
That's ("answer is indeed ME") probably a too fast conclusion (depending on what you mean by "marginal effects" - if a single number, that's not always a good idea. In this example, we used cubic age, and the interpretation makes sense... 1/2
Ok, works for simple models, must check for more complex like mixed effects / zero-inflated models.
![m <- lm(mpg ~ wt + hp, data = mtcars)
ci <- 0.95
dof <- insight::get_df(m)
set.seed(123)
crit <- mvtnorm::qmvt(ci, df = dof, tail = "both.tails", corr = cov2cor(vcov(m)))$quantile
# 95% level%
confint(m)
#> 2.5 % 97.5 %
#> (Intercept) 33.95738245 40.49715778
#> wt -5.17191604 -2.58374544
#> hp -0.05024078 -0.01330512
parameters::model_parameters(m)
#> Parameter | Coefficient | SE | 95% CI | t(29) | p
#> ----------------------------------------------------------------------
#> (Intercept) | 37.23 | 1.60 | [33.96, 40.50] | 23.28 | < .001
#> wt | -3.88 | 0.63 | [-5.17, -2.58] | -6.13 | < .001
#> hp | -0.03 | 9.03e-03 | [-0.05, -0.01] | -3.52 | 0.001
#>
#> Uncertainty intervals (equal-tailed) and p-values (two-tailed) computed
#> using a Wald t-distribution approximation.
# sup-t adjustment
confint(m, level = 1 - 2 * pt(-abs(crit), df = dof))
#> 1.04 % 98.96 %
#> (Intercept) 33.31930882 41.135231417
#> wt -5.42443900 -2.331222484
#> hp -0.05384452 -0.009701374
set.seed(123)
parameters::model_parameters(m, p_adjust = "sup-t")
#> Parameter | Coefficient | SE | 95% CI | t(29) | p
#> ----------------------------------------------------------------------
#> (Intercept) | 37.23 | 1.60 | [33.32, 41.14] | 23.28 | < .001
#> wt | -3.88 | 0.63 | [-5.42, -2.33] | -6.13 | < .001
#> hp | -0.03 | 9.03e-03 | [-0.05, -0.01] | -3.52 | 0.003
#>
#> p-value adjustment method: Simultaneous confidence bands
#>
#> Uncertainty intervals (equal-tailed) and p-values (two-tailed) computed
#> using a Wald t-distribution approximation.](https://cdn.bsky.app/img/feed_thumbnail/plain/did:plc:d73oqmrkqkaoqdjbjsmkhxp2/bafkreihkibqoi7acbtdg36cxu4dvi6hernwdstzbm7u3t73szzxkebpv74@jpeg)
July 6, 2025 at 9:09 PM
Ok, works for simple models, must check for more complex like mixed effects / zero-inflated models.
Would it be something like this?
![m <- lm(mpg ~ wt + hp, data = mtcars)
x <- 0.95
l <- mvtnorm::qmvnorm(x, tail = "both.tails", corr = cov2cor(vcov(m)))$quantile
1 - 2 * pnorm(-abs(l))
#> [1] 0.9797365
# 95% level%
confint(m)
#> 2.5 % 97.5 %
#> (Intercept) 33.95738245 40.49715778
#> wt -5.17191604 -2.58374544
#> hp -0.05024078 -0.01330512
# new "95%" level
confint(m, level = 1 - 2 * pnorm(-abs(l)))
#> 1.01 % 98.99 %
#> (Intercept) 33.30014759 41.154392645
#> wt -5.43202222 -2.323639269
#> hp -0.05395274 -0.009593154](https://cdn.bsky.app/img/feed_thumbnail/plain/did:plc:d73oqmrkqkaoqdjbjsmkhxp2/bafkreifg3dyowdtqb5h4sl3mwqcdaj7owcgpxpi2awun7dl52fyglly5zm@jpeg)
July 5, 2025 at 10:56 AM
Would it be something like this?
Time for a new wallpaper... #easystats #insight

July 1, 2025 at 1:09 PM
Time for a new wallpaper... #easystats #insight
I mean, it even appears if you just select a single char.

July 1, 2025 at 7:44 AM
I mean, it even appears if you just select a single char.

Here's a way how I handled it in sjPlot, *if* you really have neutral categories. Such thing would be nice to have in a future update, because you don't have much tools for plotting "Likert" scales (especially not in Excel/Office diagrams, but who makes figures with office anyway?)

June 4, 2025 at 10:03 AM
Here's a way how I handled it in sjPlot, *if* you really have neutral categories. Such thing would be nice to have in a future update, because you don't have much tools for plotting "Likert" scales (especially not in Excel/Office diagrams, but who makes figures with office anyway?)
I often have "neutral" categories, like "don't know" or similar, and these are neither positive nor negative, so it would be great to account for their proportion, but placing it in the middle would add half of their counts to both sides, which can be misleading when interpreting "totals".
![library(tinyplot)
tinytheme(
"clean2",
palette.qualitative = c("black", "sienna", "grey", "indianred", "goldenrod")
)
hec <- as.data.frame(proportions(HairEyeColor, 2:3))
# Add a new factor level "Dont know" to the variable "Hair"
hec$Hair <- factor(hec$Hair, levels = c(levels(hec$Hair)[1:2], "Dont know", levels(hec$Hair)[3:4]))
hec$Hair[5] <- "Dont know"
tinyplot(
Freq ~ Eye | Hair,
facet = ~Sex,
data = hec,
type = "barplot",
center = TRUE,
flip = TRUE,
facet.args = list(ncol = 1),
yaxl = "percent"
)](https://cdn.bsky.app/img/feed_thumbnail/plain/did:plc:d73oqmrkqkaoqdjbjsmkhxp2/bafkreic6vsklld7cye5pzi272j5g5mcxtlkxy7hn42turg3hrihv6atkrq@jpeg)
![library(tinyplot)
tinytheme(
"clean2",
palette.qualitative = c("black", "sienna", "grey", "indianred", "goldenrod")
)
hec <- as.data.frame(proportions(HairEyeColor, 2:3))
# Add a new factor level "Dont know" to the variable "Hair"
hec$Hair <- factor(hec$Hair, levels = c(levels(hec$Hair)[1:2], "Dont know", levels(hec$Hair)[3:4]))
hec$Hair[5] <- "Dont know"
tinyplot(
Freq ~ Eye | Hair,
facet = ~Sex,
data = hec,
type = "barplot",
center = TRUE,
flip = TRUE,
facet.args = list(ncol = 1),
yaxl = "percent"
)](https://cdn.bsky.app/img/feed_thumbnail/plain/did:plc:d73oqmrkqkaoqdjbjsmkhxp2/bafkreig6fb5o664yvdpvuonrxtkdzjaxvejscirwnepbim7lnrqavepr6y@jpeg)
June 4, 2025 at 10:03 AM
I often have "neutral" categories, like "don't know" or similar, and these are neither positive nor negative, so it would be great to account for their proportion, but placing it in the middle would add half of their counts to both sides, which can be misleading when interpreting "totals".

I often show students this figure and ask, how different is the green distribution (p < 0.05) from the blue distribution (p = 0.10)? Just to raise some awareness that the difference between "statistical significant" and "not significant" is not always that significant...

June 3, 2025 at 6:57 AM
I often show students this figure and ask, how different is the green distribution (p < 0.05) from the blue distribution (p = 0.10)? Just to raise some awareness that the difference between "statistical significant" and "not significant" is not always that significant...
You may also find `convert_to_na()` and `convert_na_to()` helpful (easystats.github.io/datawizard/r...), or maybe also `replace_nan_inf()` from the #rstats {datawizard} package.

May 21, 2025 at 1:28 PM
You may also find `convert_to_na()` and `convert_na_to()` helpful (easystats.github.io/datawizard/r...), or maybe also `replace_nan_inf()` from the #rstats {datawizard} package.
And although the scales are different for predictions and coefficients, the statistical test for the difference between levels of a factor (= p-values) are literally identical, meaning that if you work with predicted probabilities anyway, it almost doesn't matter which model you take.
![data(heart, package = "glm2")
start.p <- sum(heart$Deaths) / sum(heart$Patients)
fit.glm <- glm(
cbind(Deaths, Patients - Deaths) ~
factor(AgeGroup) + factor(Severity) + factor(Delay) + factor(Region),
family = binomial(),
data = heart
)
fit.logbin <- logbin::logbin(
formula(fit.glm),
data = heart,
start = c(log(start.p), rep(c(0.2, 0.4), 4)),
trace = 1
)
modelbased::estimate_contrasts(fit.logbin, "Delay")
#> Marginal Contrasts Analysis
#>
#> Level1 | Level2 | Difference | SE | 95% CI | t(65) | p
#> -------------------------------------------------------------------
#> 2 | 1 | 0.01 | 0.01 | [-0.01, 0.04] | 0.86 | 0.394
#> 3 | 1 | 0.03 | 0.02 | [ 0.00, 0.07] | 2.13 | 0.037
#> 3 | 2 | 0.02 | 0.02 | [-0.01, 0.05] | 1.56 | 0.124
#>
#> Contrasts are on the response-scale (in %-points).
parameters::model_parameters(fit.logbin, exponentiate = TRUE, keep = "Delay")
#> Parameter | Risk Ratio | SE | 95% CI | Statistic | df | p
#> ---------------------------------------------------------------------
#> Delay [2] | 1.06 | 0.07 | [0.93, 1.22] | 0.85 | 65 | 0.395
#> Delay [3] | 1.19 | 0.10 | [1.01, 1.39] | 2.13 | 65 | 0.034
#>
#> Uncertainty intervals (profile-likelihood) and p-values (two-tailed)
#> computed using a Wald distribution approximation.](https://cdn.bsky.app/img/feed_thumbnail/plain/did:plc:d73oqmrkqkaoqdjbjsmkhxp2/bafkreifo4hz5vwaraulk5vob36cydw4a6s44pg3we4v3srvmoxmdz3f4xy@jpeg)
May 20, 2025 at 12:17 PM
And although the scales are different for predictions and coefficients, the statistical test for the difference between levels of a factor (= p-values) are literally identical, meaning that if you work with predicted probabilities anyway, it almost doesn't matter which model you take.
Nice video, as always! One conclusion would be to use marginal means / adjusted predictions, because this will give consistent results for both models.

May 20, 2025 at 12:17 PM
Nice video, as always! One conclusion would be to use marginal means / adjusted predictions, because this will give consistent results for both models.