

Steven Ruggles
@stevenruggles.bsky.social
Historical demographer and data impresario
Wired profile: https://www.wired.com/1995/03/ruggles/
Publications: https://users.pop.umn.edu/~ruggl001/
Data: https://www.ipums.org/
Wired profile: https://www.wired.com/1995/03/ruggles/
Publications: https://users.pop.umn.edu/~ruggl001/
Data: https://www.ipums.org/
It was raining and cold.

November 3, 2025 at 1:50 AM
It was raining and cold.

Seems about right.
September 6, 2025 at 3:17 AM
Seems about right.
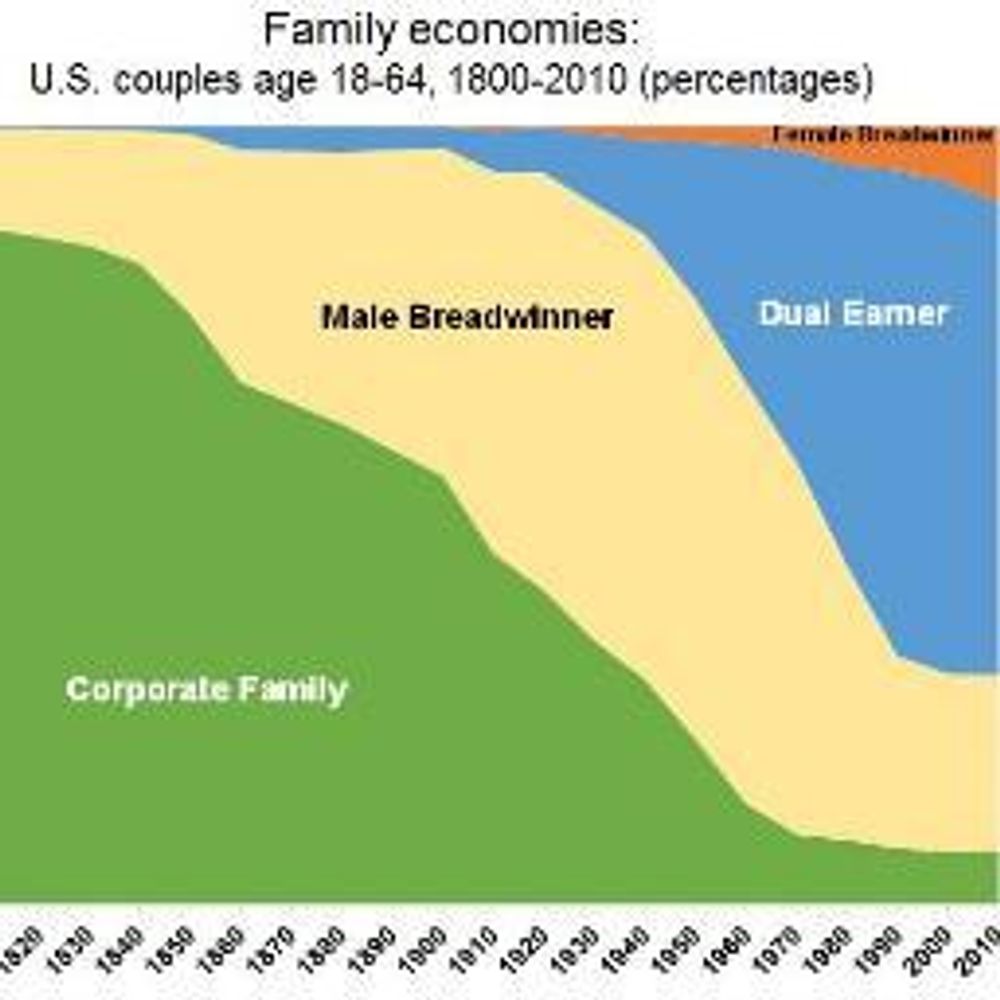
Actually, this graph isn't the percent of households with a married couple. It turns out to be percent of households with a married-spouse-present householder or household head, which is a bit lower. Also 1950 is not the all-time high. We can observe this back to 1850, and that is the high point.

September 3, 2025 at 9:49 PM
Actually, this graph isn't the percent of households with a married couple. It turns out to be percent of households with a married-spouse-present householder or household head, which is a bit lower. Also 1950 is not the all-time high. We can observe this back to 1850, and that is the high point.

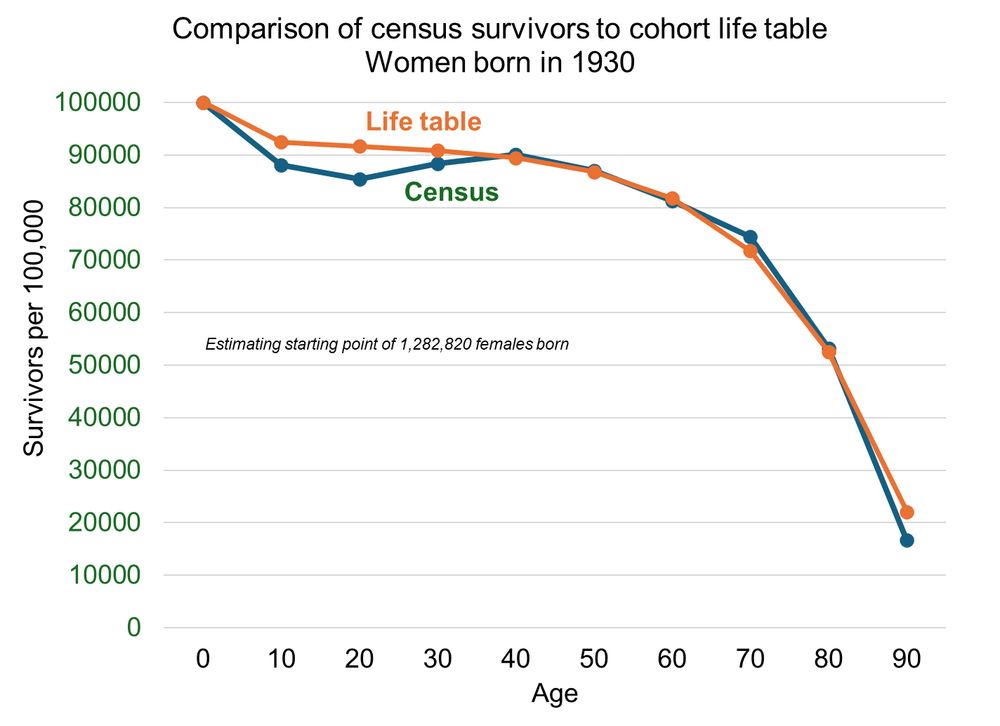
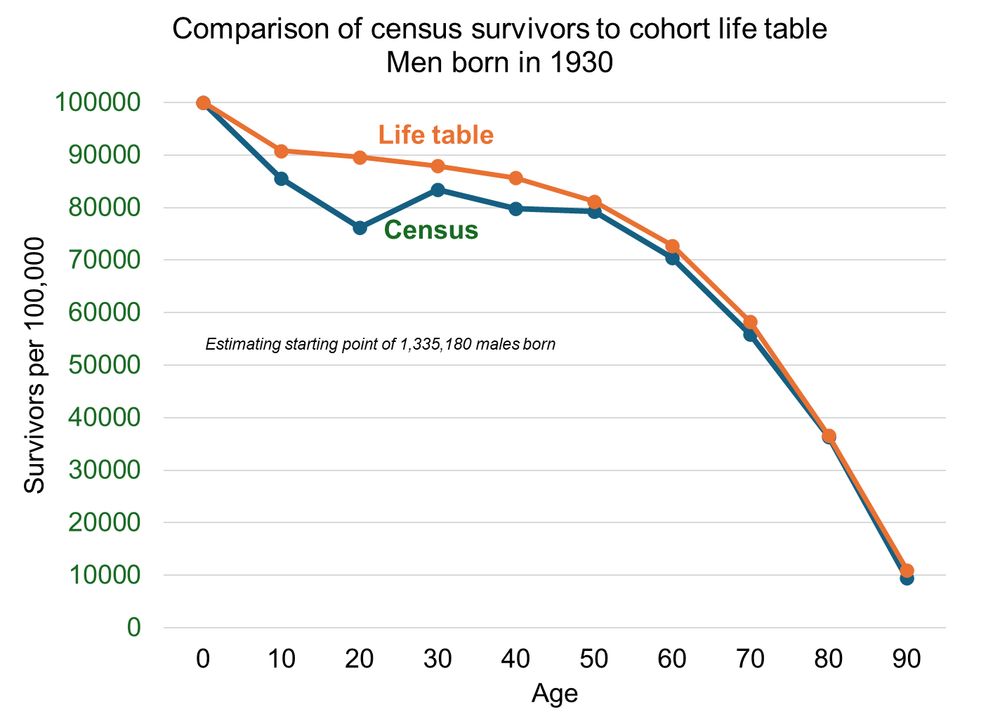
I made another one for women. still a significant undercount at ages 10 and 20, but not nearly as bad.
July 25, 2025 at 10:45 PM
I made another one for women. still a significant undercount at ages 10 and 20, but not nearly as bad.
I replicated the graph using a cohort life table (available here: www.ssa.gov/oact/NOTES/a...), for all races. Very close fit after age 50, still a big mismatch at younger ages, especially age 20 (1950 census). Looks like a major undercount of young men 1940-1970. 1/2
July 25, 2025 at 10:45 PM
I replicated the graph using a cohort life table (available here: www.ssa.gov/oact/NOTES/a...), for all races. Very close fit after age 50, still a big mismatch at younger ages, especially age 20 (1950 census). Looks like a major undercount of young men 1940-1970. 1/2
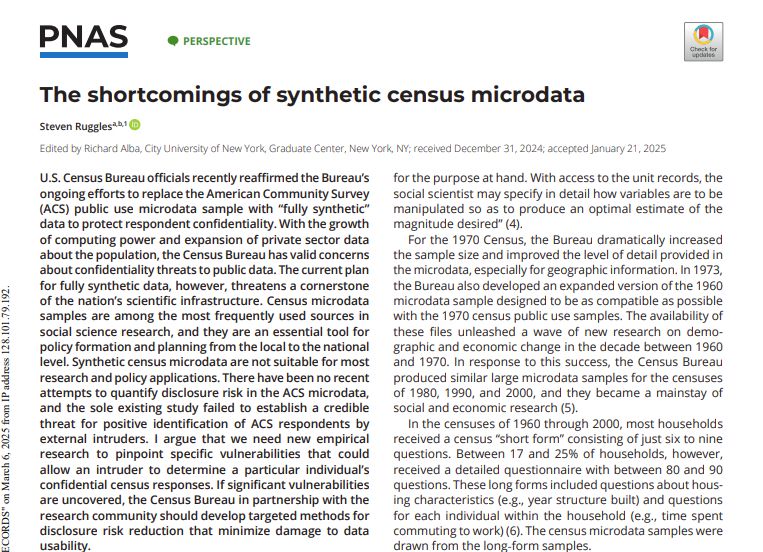
And this one explains the even greater dangers to the ACS microdata. Let me know if you need an ungated copy. www.pnas.org/doi/abs/10.1...
June 18, 2025 at 12:27 AM
And this one explains the even greater dangers to the ACS microdata. Let me know if you need an ungated copy. www.pnas.org/doi/abs/10.1...
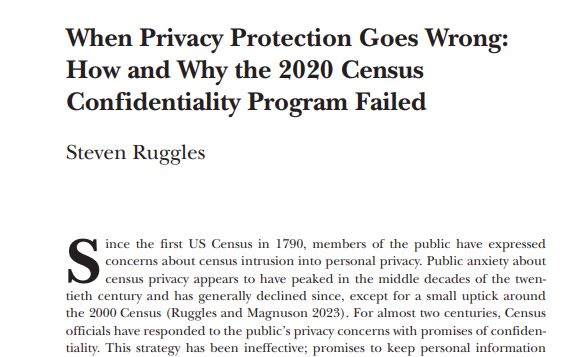
Here are my conclusions about disclosure control in 2020. Unfortunately, they seem to be going down the same misguided path. pubs.aeaweb.org/doi/pdfplus/...
June 18, 2025 at 12:27 AM
Here are my conclusions about disclosure control in 2020. Unfortunately, they seem to be going down the same misguided path. pubs.aeaweb.org/doi/pdfplus/...
Life Among the Legoheads (1995)
www.wired.com/1995/03/rugg...
www.wired.com/1995/03/rugg...

June 16, 2025 at 9:16 PM
Life Among the Legoheads (1995)
www.wired.com/1995/03/rugg...
www.wired.com/1995/03/rugg...

Big crowd considering it was cancelled!

June 15, 2025 at 1:42 AM
Big crowd considering it was cancelled!
If the NYT filtered for their "select pollsters" he would be at 41-55 (-14%) rather than 44-53 (-9%).

April 27, 2025 at 10:02 PM
If the NYT filtered for their "select pollsters" he would be at 41-55 (-14%) rather than 44-53 (-9%).

Hands off St. Paul

April 5, 2025 at 8:49 PM
Hands off St. Paul

Wow. The dogey boy lost about 30 billion (so far) today!

February 25, 2025 at 7:14 PM
Wow. The dogey boy lost about 30 billion (so far) today!
Our paper on the politics of Census Bureau technology argues that Clinton's radical downsizing of the federal workforce led to a loss of expertise that had taken decades to build, massive outsourcing to the private sector, and an explosion of costs.
academic.oup.com/jah/article/...
academic.oup.com/jah/article/...

February 16, 2025 at 6:26 PM
Our paper on the politics of Census Bureau technology argues that Clinton's radical downsizing of the federal workforce led to a loss of expertise that had taken decades to build, massive outsourcing to the private sector, and an explosion of costs.
academic.oup.com/jah/article/...
academic.oup.com/jah/article/...
