


Steven Romalewski
@sromalewski.bsky.social
Director, CUNY Mapping Service at the Center for Urban Research, CUNY Graduate Center. More here: https://www.gc.cuny.edu/people/steven-romalewski Some posts are work-related, some are personal.
Photo credit: Alex Irklievski
Photo credit: Alex Irklievski
"5 Takeaways from the 2025 NYC Election Turnout" via @cityandstateny.bsky.social featuring the @thegraduatecenter.bsky.social online map www.cityandstateny.com/politics/202...
We've added filters to the map (eg., showing 2025 general results in areas won in the primary) plus an address search.
We've added filters to the map (eg., showing 2025 general results in areas won in the primary) plus an address search.

November 10, 2025 at 9:47 PM
"5 Takeaways from the 2025 NYC Election Turnout" via @cityandstateny.bsky.social featuring the @thegraduatecenter.bsky.social online map www.cityandstateny.com/politics/202...
We've added filters to the map (eg., showing 2025 general results in areas won in the primary) plus an address search.
We've added filters to the map (eg., showing 2025 general results in areas won in the primary) plus an address search.
Per @nygroove.nyc, "people who live along subway lines or rented in the city’s more densely packed areas were more likely to vote for Mamdani, according to maps created by CUNY’s @thegraduatecenter.bsky.social Center for Urban Research" nygroove.nyc/nyc-mayoral-... c/o @timdonnelly.com

November 6, 2025 at 3:59 PM
Per @nygroove.nyc, "people who live along subway lines or rented in the city’s more densely packed areas were more likely to vote for Mamdani, according to maps created by CUNY’s @thegraduatecenter.bsky.social Center for Urban Research" nygroove.nyc/nyc-mayoral-... c/o @timdonnelly.com
The article embeds our map and features 8 map thumbnails; see below.

November 6, 2025 at 1:40 PM
The article embeds our map and features 8 map thumbnails; see below.
I happen to think our CUNY @thegraduatecenter.bsky.social map is a bit more detailed & hopefully as visually appealing & even more useful (20 filters, comparison w/2021, and overlays to display subways, NYCHA sites, & Council districts). Hope it's helpful! www.urbanresearchmaps.org/electioncomp...

November 5, 2025 at 4:26 PM
I happen to think our CUNY @thegraduatecenter.bsky.social map is a bit more detailed & hopefully as visually appealing & even more useful (20 filters, comparison w/2021, and overlays to display subways, NYCHA sites, & Council districts). Hope it's helpful! www.urbanresearchmaps.org/electioncomp...
You can see the difference visually, as well. Maps below show renters/subway riders (Mamdani 57% of the vote) www.urbanresearchmaps.org/electioncomp... vs owners/car drivers (Cuomo 51%) www.urbanresearchmaps.org/electioncomp... Stark!


November 5, 2025 at 3:21 PM
You can see the difference visually, as well. Maps below show renters/subway riders (Mamdani 57% of the vote) www.urbanresearchmaps.org/electioncomp... vs owners/car drivers (Cuomo 51%) www.urbanresearchmaps.org/electioncomp... Stark!
You can also use this version of the map to embed at your site & create custom links for specific election districts and/or filtered results www.urbanresearchmaps.org/electioncomp...
The screenshot shows an ED in Borough Park, for example: www.urbanresearchmaps.org/electioncomp...
The screenshot shows an ED in Borough Park, for example: www.urbanresearchmaps.org/electioncomp...

November 5, 2025 at 5:07 AM
You can also use this version of the map to embed at your site & create custom links for specific election districts and/or filtered results www.urbanresearchmaps.org/electioncomp...
The screenshot shows an ED in Borough Park, for example: www.urbanresearchmaps.org/electioncomp...
The screenshot shows an ED in Borough Park, for example: www.urbanresearchmaps.org/electioncomp...
Another view here, fyi, from @thegraduatecenter.bsky.social: www.electionatlas.nyc/maps.html#!N... You can choose from 20 demographic/electoral map filters (or combinations of any of them), direct comparisons to 2021, and overlays to show subway routes, NYCHA sites, and City Council districts.

November 5, 2025 at 5:03 AM
Another view here, fyi, from @thegraduatecenter.bsky.social: www.electionatlas.nyc/maps.html#!N... You can choose from 20 demographic/electoral map filters (or combinations of any of them), direct comparisons to 2021, and overlays to show subway routes, NYCHA sites, and City Council districts.
The NO vote on NYC Ballot Proposal 6 (local elections even years) closely mirrors the areas of the city where Trump did well in 2024, Sliwa did well in 2021 (and where Cuomo has done well so far in 2025): www.urbanresearchmaps.org/electioncomp...


November 5, 2025 at 4:26 AM
The NO vote on NYC Ballot Proposal 6 (local elections even years) closely mirrors the areas of the city where Trump did well in 2024, Sliwa did well in 2021 (and where Cuomo has done well so far in 2025): www.urbanresearchmaps.org/electioncomp...
So far, in election districts w/plurality of citizens of voting age (i.e, eligible voters) who are Black, Mamdani won w/63% of the vote (30 pt margin over Cuomo), w/94% of scanners reporting: www.urbanresearchmaps.org/electioncomp...
In 2021, Adams swept these districts w/89% of the vote.
In 2021, Adams swept these districts w/89% of the vote.

November 5, 2025 at 4:17 AM
So far, in election districts w/plurality of citizens of voting age (i.e, eligible voters) who are Black, Mamdani won w/63% of the vote (30 pt margin over Cuomo), w/94% of scanners reporting: www.urbanresearchmaps.org/electioncomp...
In 2021, Adams swept these districts w/89% of the vote.
In 2021, Adams swept these districts w/89% of the vote.
In Borough Park, Cuomo received some of his strongest support such as ED 42 in Assembly district 48 w/96% of vote: www.urbanresearchmaps.org/electioncomp... In 2021, Adams did poorly in Boro Pk; in this this ED Sliwa had 56% of vote in '21. Also, only 265 people voted in '21 vs over 800 now (!).
November 5, 2025 at 3:38 AM
In Borough Park, Cuomo received some of his strongest support such as ED 42 in Assembly district 48 w/96% of vote: www.urbanresearchmaps.org/electioncomp... In 2021, Adams did poorly in Boro Pk; in this this ED Sliwa had 56% of vote in '21. Also, only 265 people voted in '21 vs over 800 now (!).
Now w/almost all scanners reporting, Cuomo's vote support grows in districts w/plurality of voters w/Jewish surnames www.urbanresearchmaps.org/electioncomp... (almost 58% of vote in those EDs & a 20 pt margin). Notably Adams won those EDs in '21 w/70% of the vote & a 45pt margin.

November 5, 2025 at 3:33 AM
Now w/almost all scanners reporting, Cuomo's vote support grows in districts w/plurality of voters w/Jewish surnames www.urbanresearchmaps.org/electioncomp... (almost 58% of vote in those EDs & a 20 pt margin). Notably Adams won those EDs in '21 w/70% of the vote & a 45pt margin.
Proud to have witnessed, participated in, and mapped the (unofficial) results (so far) of more than 2 million people voting for mayor in New York City! www.urbanresearchmaps.org/electioncomp...

November 5, 2025 at 3:22 AM
Proud to have witnessed, participated in, and mapped the (unofficial) results (so far) of more than 2 million people voting for mayor in New York City! www.urbanresearchmaps.org/electioncomp...
NYC BOE reports (unofficially) more than 2 million votes in mayoral race: web.enrboenyc.us/OF11CY0PY3.h...
November 5, 2025 at 3:18 AM
NYC BOE reports (unofficially) more than 2 million votes in mayoral race: web.enrboenyc.us/OF11CY0PY3.h...
And Cuomo has plurality of support in areas w/plurality of active reg. voters w/Irish / Italian surnames (48% of vote; 13 pt margin over Mamdani) but Sliwa cut into that support (w/16% of vote so far). www.urbanresearchmaps.org/electioncomp... Notably, Sliwa won those EDs in 2021 w/52% of the vote.

November 5, 2025 at 2:52 AM
And Cuomo has plurality of support in areas w/plurality of active reg. voters w/Irish / Italian surnames (48% of vote; 13 pt margin over Mamdani) but Sliwa cut into that support (w/16% of vote so far). www.urbanresearchmaps.org/electioncomp... Notably, Sliwa won those EDs in 2021 w/52% of the vote.
While Mamdani is doing well in districts w/plurality of active registered voters w/Muslim surnames (almost 60% of vote; 27 pt margin). www.urbanresearchmaps.org/electioncomp...

November 5, 2025 at 2:44 AM
While Mamdani is doing well in districts w/plurality of active registered voters w/Muslim surnames (almost 60% of vote; 27 pt margin). www.urbanresearchmaps.org/electioncomp...
NYC mayor 66 percent scanners reporting. Similar overall patterns. Perhaps unsurprisingly, Cuomo continues to do well in districts w/plurality of active registered voters w/Jewish surnames www.urbanresearchmaps.org/electioncomp... (56% of vote; 18 pt margin).

November 5, 2025 at 2:43 AM
NYC mayor 66 percent scanners reporting. Similar overall patterns. Perhaps unsurprisingly, Cuomo continues to do well in districts w/plurality of active registered voters w/Jewish surnames www.urbanresearchmaps.org/electioncomp... (56% of vote; 18 pt margin).
So far, Mamdani has 58% of vote (22 pt margin over Cuomo) in districts that Adams won in 2021 www.urbanresearchmaps.org/electioncomp... but Cuomo doing even better (31 pt margin) in districts where Trump did well in 24 www.urbanresearchmaps.org/electioncomp...


November 5, 2025 at 2:35 AM
So far, Mamdani has 58% of vote (22 pt margin over Cuomo) in districts that Adams won in 2021 www.urbanresearchmaps.org/electioncomp... but Cuomo doing even better (31 pt margin) in districts where Trump did well in 24 www.urbanresearchmaps.org/electioncomp...
Updated map with 53% of scanners reporting
www.urbanresearchmaps.org/electioncomp...
www.urbanresearchmaps.org/electioncomp...

November 5, 2025 at 2:32 AM
Updated map with 53% of scanners reporting
www.urbanresearchmaps.org/electioncomp...
www.urbanresearchmaps.org/electioncomp...
Also see our CUNY map that lets you filter by demographics and electoral patterns: www.electionatlas.nyc/maps.html#!N...

November 5, 2025 at 2:10 AM
Also see our CUNY map that lets you filter by demographics and electoral patterns: www.electionatlas.nyc/maps.html#!N...
Screenshot of the first returns
November 5, 2025 at 2:08 AM
Screenshot of the first returns
But the status of the site is a bit dated (Sept. 24, 2025!); see below. Hope that gets updated just to reassure us all!

November 5, 2025 at 12:29 AM
But the status of the site is a bit dated (Sept. 24, 2025!); see below. Hope that gets updated just to reassure us all!
This link highlights an ED in Park Slope (which will show actual data & color shading after 9pm tonight):
www.urbanresearchmaps.org/electioncomp...
This link shows EDs where Trump did well in 2024, and highlights an election district in Middle Village:
www.urbanresearchmaps.org/electioncomp...
6/n
www.urbanresearchmaps.org/electioncomp...
This link shows EDs where Trump did well in 2024, and highlights an election district in Middle Village:
www.urbanresearchmaps.org/electioncomp...
6/n

November 4, 2025 at 7:30 PM
This link highlights an ED in Park Slope (which will show actual data & color shading after 9pm tonight):
www.urbanresearchmaps.org/electioncomp...
This link shows EDs where Trump did well in 2024, and highlights an election district in Middle Village:
www.urbanresearchmaps.org/electioncomp...
6/n
www.urbanresearchmaps.org/electioncomp...
This link shows EDs where Trump did well in 2024, and highlights an election district in Middle Village:
www.urbanresearchmaps.org/electioncomp...
6/n
Although the 2025 results are blank till tonight, you can explore the filters showing citywide 2021 results for all election districts that match each filter. For example, you can show EDs w/plurality of active registered voters w/Muslim, Jewish, or Chinese surnames & vote results in those EDs.
3/n
3/n

November 4, 2025 at 7:18 PM
Although the 2025 results are blank till tonight, you can explore the filters showing citywide 2021 results for all election districts that match each filter. For example, you can show EDs w/plurality of active registered voters w/Muslim, Jewish, or Chinese surnames & vote results in those EDs.
3/n
3/n
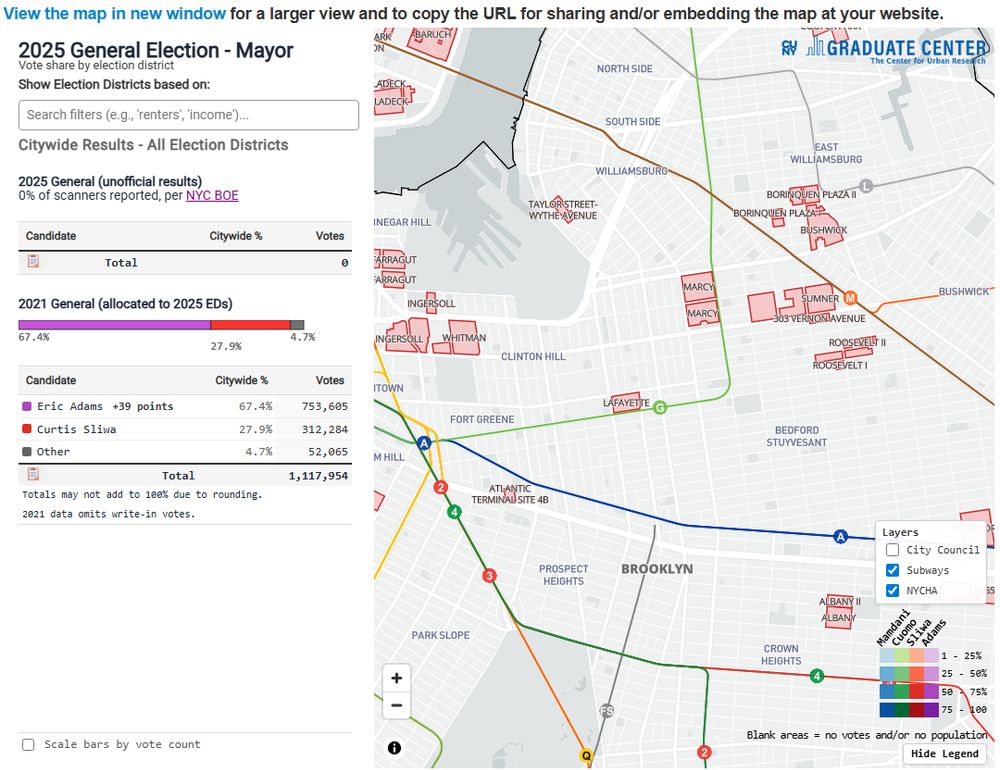
The @thegraduatecenter.bsky.social map will compare 2025 w/2021 mayoral results by election district & citywide. It gives you the ability to filter results by 20 categories of demographics & electoral patterns. The map has overlays to show City Council districts, subways, and NYCHA properties.
2/n
2/n
November 4, 2025 at 7:17 PM
The @thegraduatecenter.bsky.social map will compare 2025 w/2021 mayoral results by election district & citywide. It gives you the ability to filter results by 20 categories of demographics & electoral patterns. The map has overlays to show City Council districts, subways, and NYCHA properties.
2/n
2/n
Looking forward to reading Judith Enck’s new @beyondplastics.bsky.social book: “The Problem With Plastic” (I’m sure there are many!).
thenewpress.org/books/the-pr...
thenewpress.org/books/the-pr...

October 28, 2025 at 12:09 AM
Looking forward to reading Judith Enck’s new @beyondplastics.bsky.social book: “The Problem With Plastic” (I’m sure there are many!).
thenewpress.org/books/the-pr...
thenewpress.org/books/the-pr...