


SPECFEM
@specfem.org
Spectral-element method codes for computational seismology | specfem.org | Science & Technology | Earth, Moon & Mars 🌎
not yet - a similar example setup for the Mendocino Mw7.0 event is explained on the devel branch of SPECFEM3D Cartesian (github.com/SPECFEM/spec...)
will add this example soon...
will add this example soon...
github.com
November 24, 2025 at 7:58 PM
not yet - a similar example setup for the Mendocino Mw7.0 event is explained on the devel branch of SPECFEM3D Cartesian (github.com/SPECFEM/spec...)
will add this example soon...
will add this example soon...
:) with this app you could get some more, closer stations from the Berkley network on your phone when you select the NCEDC FDSN web server: apps.apple.com/us/app/wiggl...

Wiggles: station monitor
Wiggles visualizes Earth's ground motion at seismic stations worldwide. Select your preferred FDSN web server and seismic network, and access seismic station recordings that measure ground motion at ...
apps.apple.com
September 22, 2025 at 9:08 PM
:) with this app you could get some more, closer stations from the Berkley network on your phone when you select the NCEDC FDSN web server: apps.apple.com/us/app/wiggl...
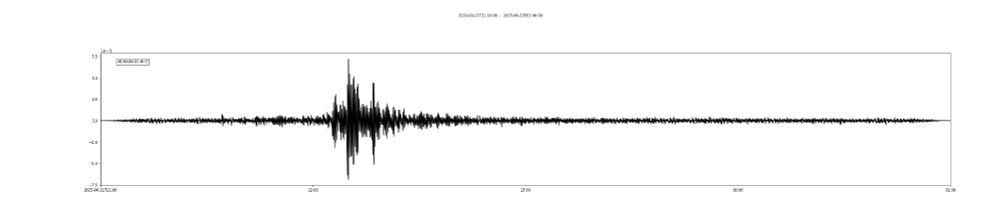
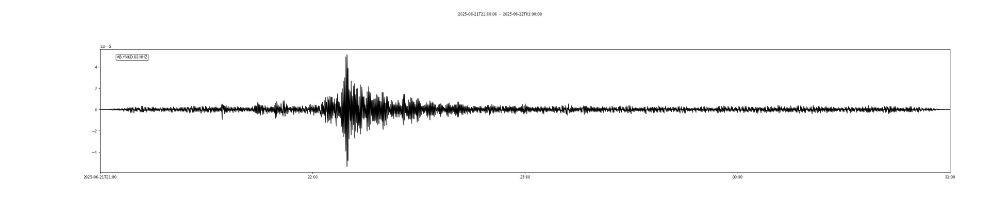
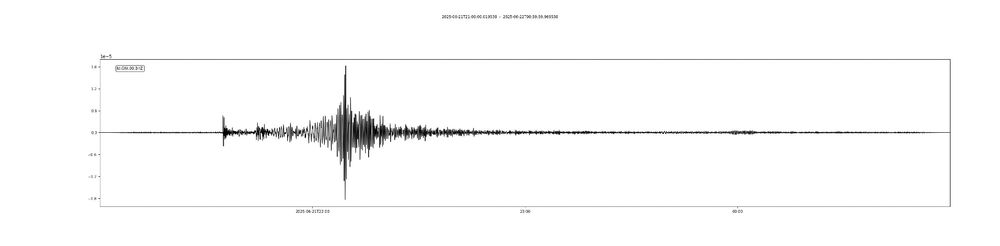
air strike reported on June 22, 2025, 2:30am local time (23:00 UTC on 2025-06-21) - not much visible in available data at closest stations AB.HASN, AB.YNKD and IU.GNI (~500-800 km away from Fordow site). main signal visible between 21:45-22:15 UTC is a Mw6.0 earthquake (epicenter in Japan)
June 24, 2025 at 11:53 PM
air strike reported on June 22, 2025, 2:30am local time (23:00 UTC on 2025-06-21) - not much visible in available data at closest stations AB.HASN, AB.YNKD and IU.GNI (~500-800 km away from Fordow site). main signal visible between 21:45-22:15 UTC is a Mw6.0 earthquake (epicenter in Japan)
:) right, that’s really more due to the choice of using an integer to represent your date rather than a Fortran limit. the same would’ve happened using other programming languages such as C/C++, C#, Java, .. as they all use mostly 32-bit integers by default these days.
February 28, 2025 at 3:28 PM
:) right, that’s really more due to the choice of using an integer to represent your date rather than a Fortran limit. the same would’ve happened using other programming languages such as C/C++, C#, Java, .. as they all use mostly 32-bit integers by default these days.
sure, happy to provide more details 🙂
the differences here with the wavefronts are due to differences in the earthquake source description, i.e., between a single centroid (CMT) source www.sciencedirect.com/science/arti...
vs. a finite-fault description earthquake.usgs.gov/data/finitef...
the differences here with the wavefronts are due to differences in the earthquake source description, i.e., between a single centroid (CMT) source www.sciencedirect.com/science/arti...
vs. a finite-fault description earthquake.usgs.gov/data/finitef...

The global CMT project 2004–2010: Centroid-moment tensors for 13,017 earthquakes
Earthquake moment tensors reflecting seven years of global seismic activity (2004–2010) are presented. The results are the product of the global centr…
www.sciencedirect.com
January 9, 2025 at 12:49 PM
sure, happy to provide more details 🙂
the differences here with the wavefronts are due to differences in the earthquake source description, i.e., between a single centroid (CMT) source www.sciencedirect.com/science/arti...
vs. a finite-fault description earthquake.usgs.gov/data/finitef...
the differences here with the wavefronts are due to differences in the earthquake source description, i.e., between a single centroid (CMT) source www.sciencedirect.com/science/arti...
vs. a finite-fault description earthquake.usgs.gov/data/finitef...
for comparison, this simulation is using the same mesh resolution, but with flat topography and just a single centroid-moment tensor (CMT) source. the noisy scattering pattern is mostly due to the USGS finite-fault solution that uses 147 single point sources with interfering wavefields.
January 8, 2025 at 7:20 PM
for comparison, this simulation is using the same mesh resolution, but with flat topography and just a single centroid-moment tensor (CMT) source. the noisy scattering pattern is mostly due to the USGS finite-fault solution that uses 147 single point sources with interfering wavefields.
might be - this is still a very simplistic model and the finite-element mesh is rather coarse. the spectral-element method however doesn't necessarily need further smoothing.
I guess part of the grid structure you notice is also just due to the visualization...
I guess part of the grid structure you notice is also just due to the visualization...
January 8, 2025 at 7:20 PM
might be - this is still a very simplistic model and the finite-element mesh is rather coarse. the spectral-element method however doesn't necessarily need further smoothing.
I guess part of the grid structure you notice is also just due to the visualization...
I guess part of the grid structure you notice is also just due to the visualization...
:) not all of it are artifacts - the main numerical noise are the small reflections of the absorbing boundaries, mostly visible after the strong surface waves hit the box walls. the overalll small-scale scattering you see is not artifacts, but scattering due to the strong topography in this region.
January 8, 2025 at 9:54 AM
:) not all of it are artifacts - the main numerical noise are the small reflections of the absorbing boundaries, mostly visible after the strong surface waves hit the box walls. the overalll small-scale scattering you see is not artifacts, but scattering due to the strong topography in this region.
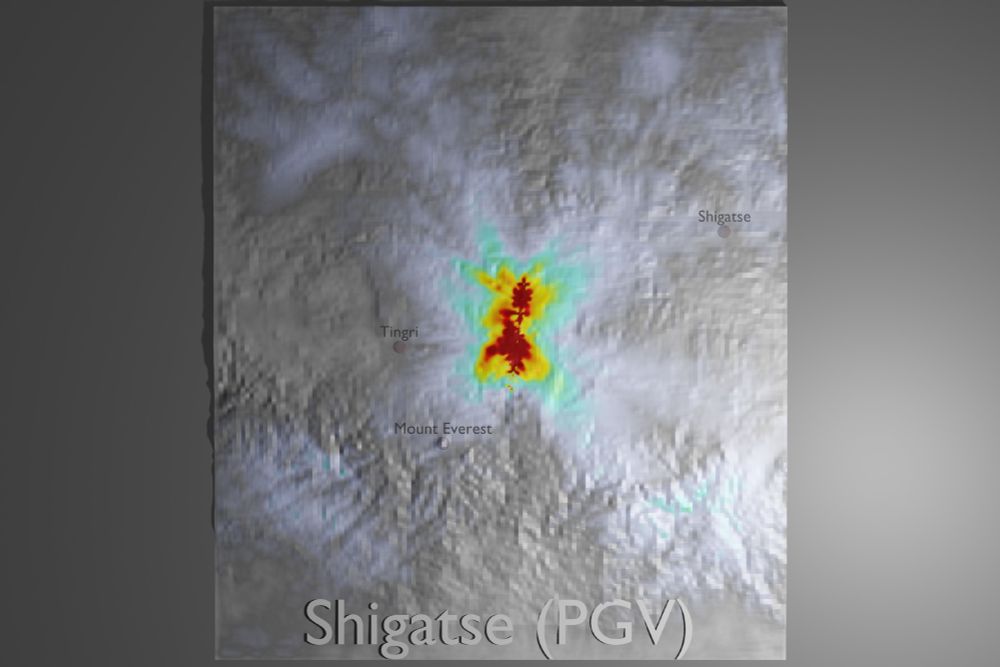
PGV shakemap for the Shigatse Mw 7.1 #earthquake based on USGS finite-fault solution #specfem3d #shakemap
January 7, 2025 at 9:08 PM
PGV shakemap for the Shigatse Mw 7.1 #earthquake based on USGS finite-fault solution #specfem3d #shakemap