


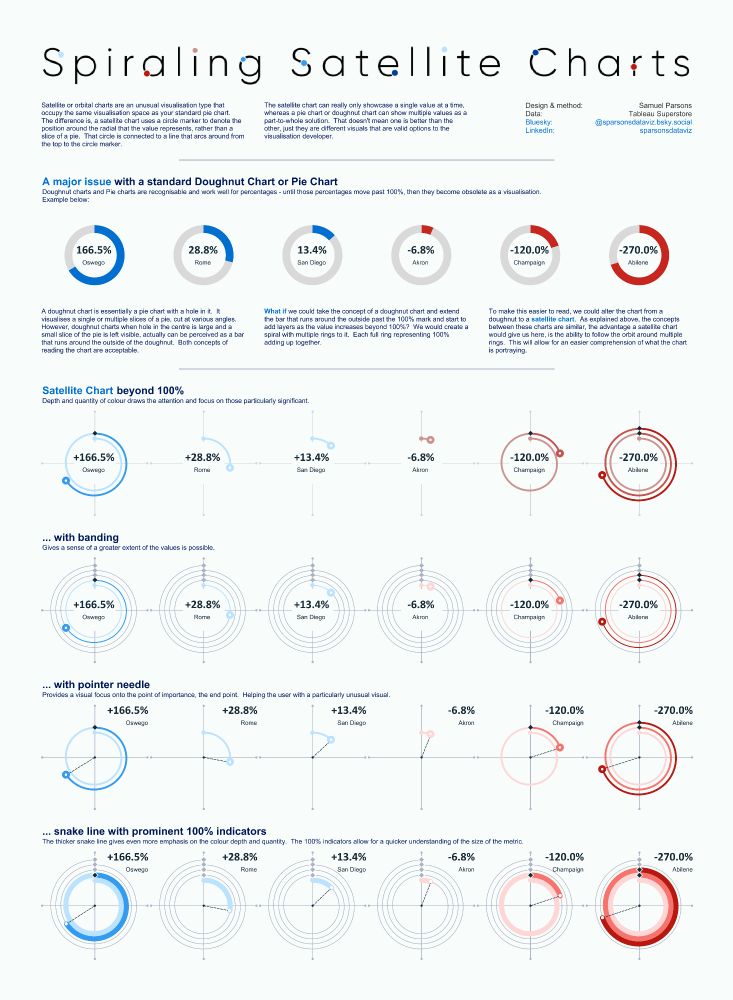
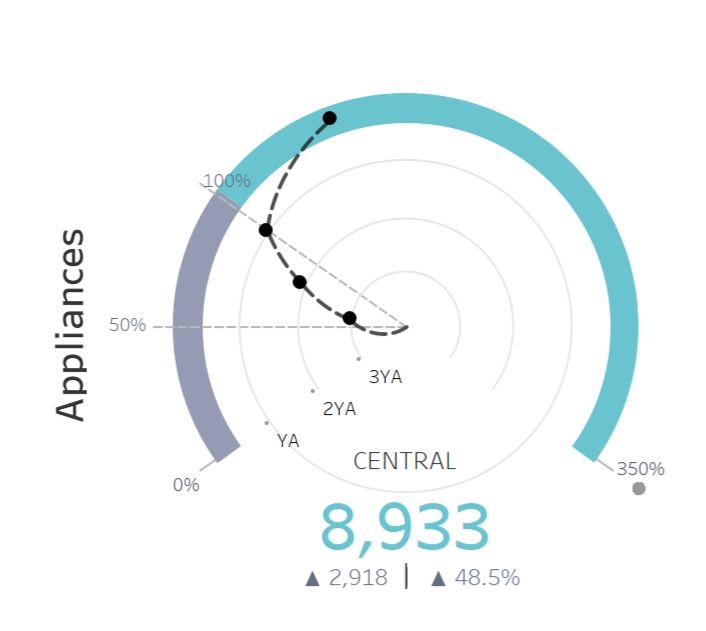
Spiraling Satellite Charts
New visualisation using Tableau! What can you do if your pie / doughnut chart %s go beyond 100%? Try a spiraling satellite chart!
Link: lnkd.in/eKMcmR5j
New visualisation using Tableau! What can you do if your pie / doughnut chart %s go beyond 100%? Try a spiraling satellite chart!
Link: lnkd.in/eKMcmR5j
April 25, 2025 at 11:20 AM
Spiraling Satellite Charts
New visualisation using Tableau! What can you do if your pie / doughnut chart %s go beyond 100%? Try a spiraling satellite chart!
Link: lnkd.in/eKMcmR5j
New visualisation using Tableau! What can you do if your pie / doughnut chart %s go beyond 100%? Try a spiraling satellite chart!
Link: lnkd.in/eKMcmR5j
Second day in a new job, first day in a new office! It has been super insightful so far.
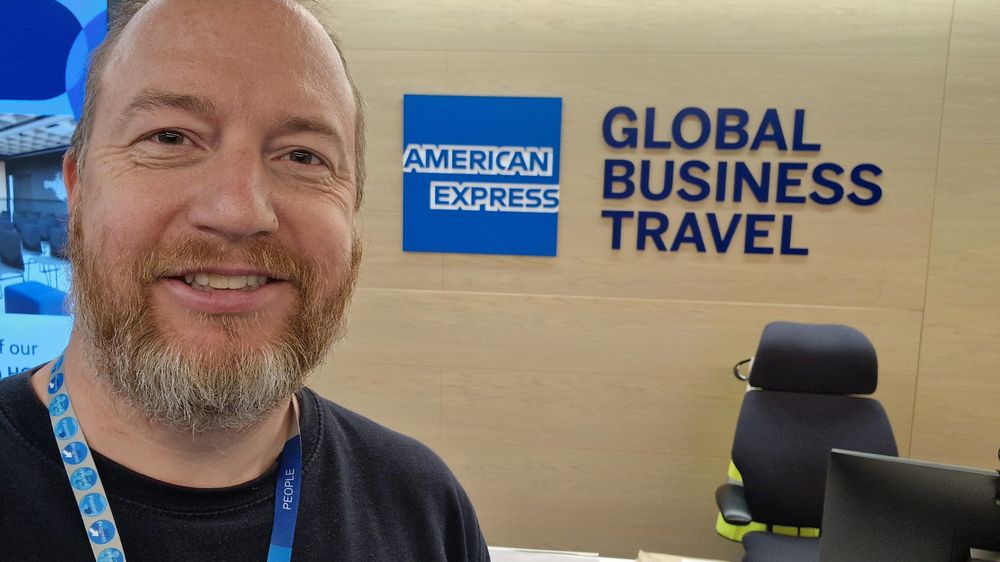
January 7, 2025 at 2:33 PM
Second day in a new job, first day in a new office! It has been super insightful so far.
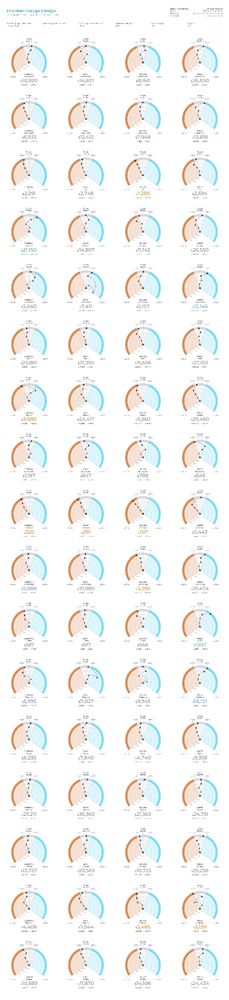
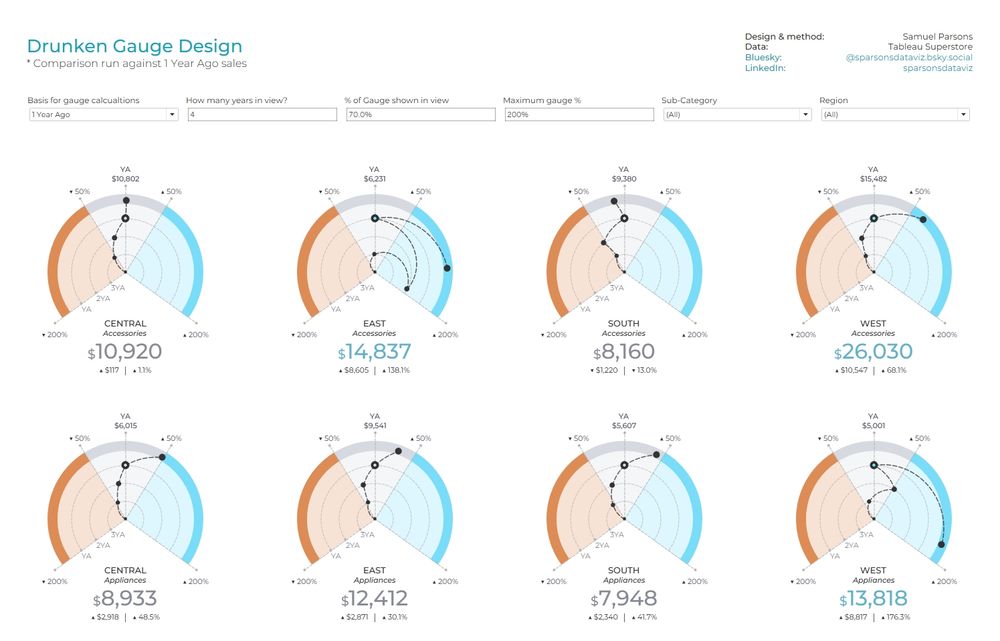
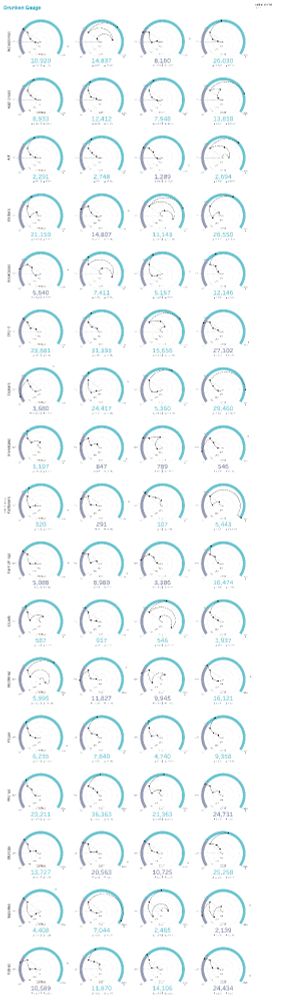
Drunken Gauge / Speedometer Charts
I've wanted to build one for a while now!
They are niche in their use case and I wouldn't recommend as the go to KPI visual, but they are fun and tell a story.
Now published to my Tableau Public site (link below).
Link: lnkd.in/ezbsfduj
I've wanted to build one for a while now!
They are niche in their use case and I wouldn't recommend as the go to KPI visual, but they are fun and tell a story.
Now published to my Tableau Public site (link below).
Link: lnkd.in/ezbsfduj
November 28, 2024 at 5:56 PM
Drunken Gauge / Speedometer Charts
I've wanted to build one for a while now!
They are niche in their use case and I wouldn't recommend as the go to KPI visual, but they are fun and tell a story.
Now published to my Tableau Public site (link below).
Link: lnkd.in/ezbsfduj
I've wanted to build one for a while now!
They are niche in their use case and I wouldn't recommend as the go to KPI visual, but they are fun and tell a story.
Now published to my Tableau Public site (link below).
Link: lnkd.in/ezbsfduj
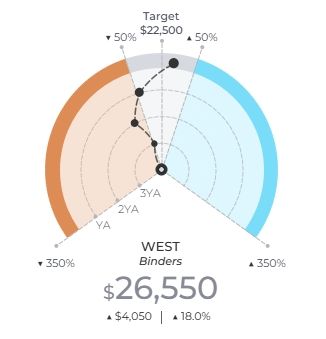
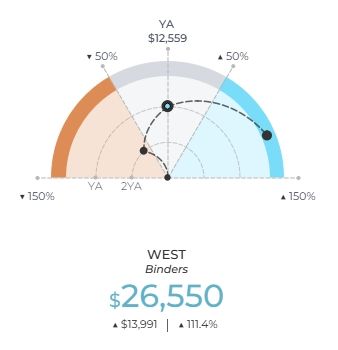
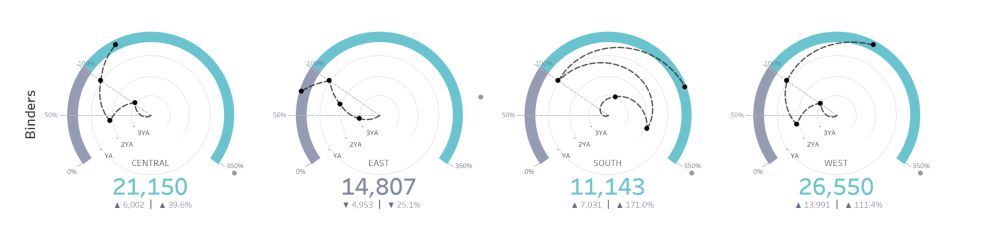
Trying a bit of fun for a Friday and I can't even blame the drink for these Drunken Gauge Charts! 😅
Still a work in progress, but I'm getting there.
#Tableau
Still a work in progress, but I'm getting there.
#Tableau
November 22, 2024 at 7:39 PM
Trying a bit of fun for a Friday and I can't even blame the drink for these Drunken Gauge Charts! 😅
Still a work in progress, but I'm getting there.
#Tableau
Still a work in progress, but I'm getting there.
#Tableau
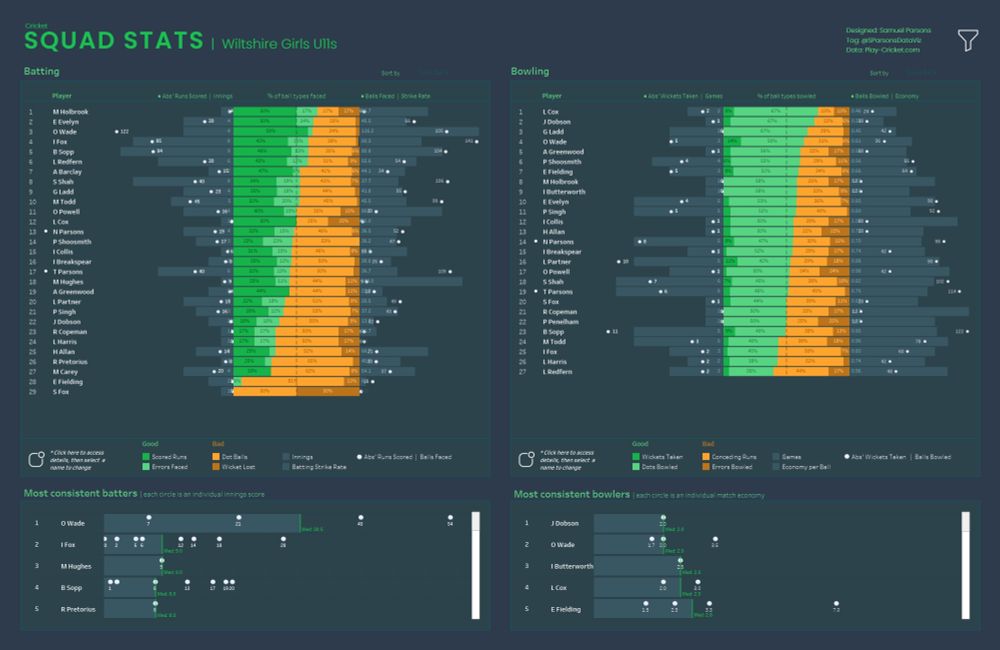
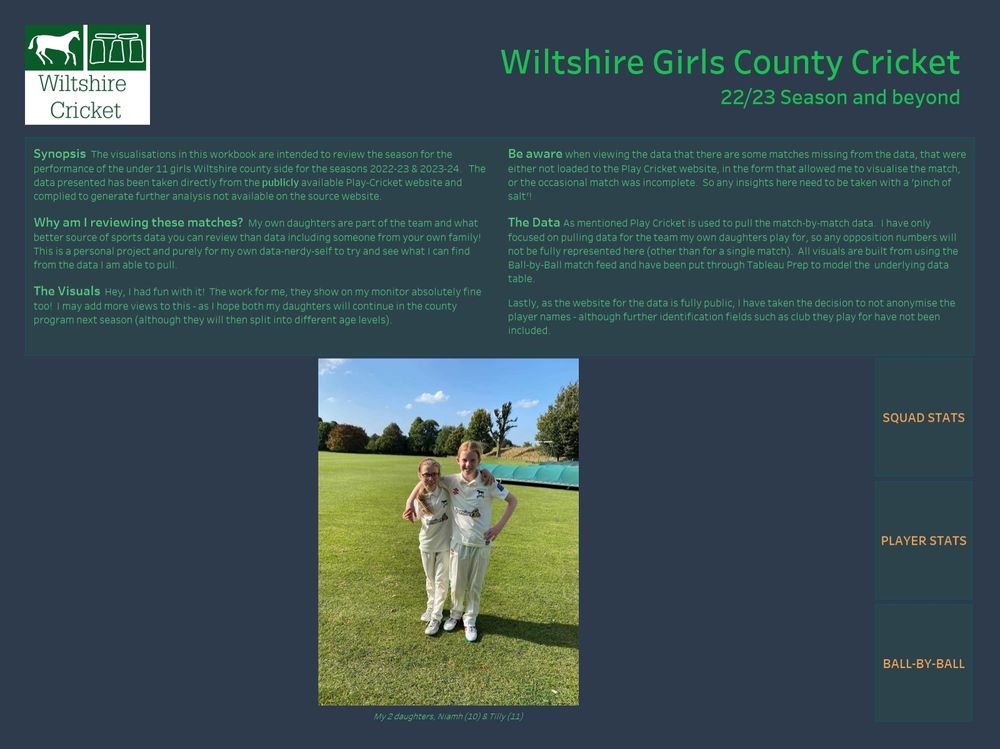
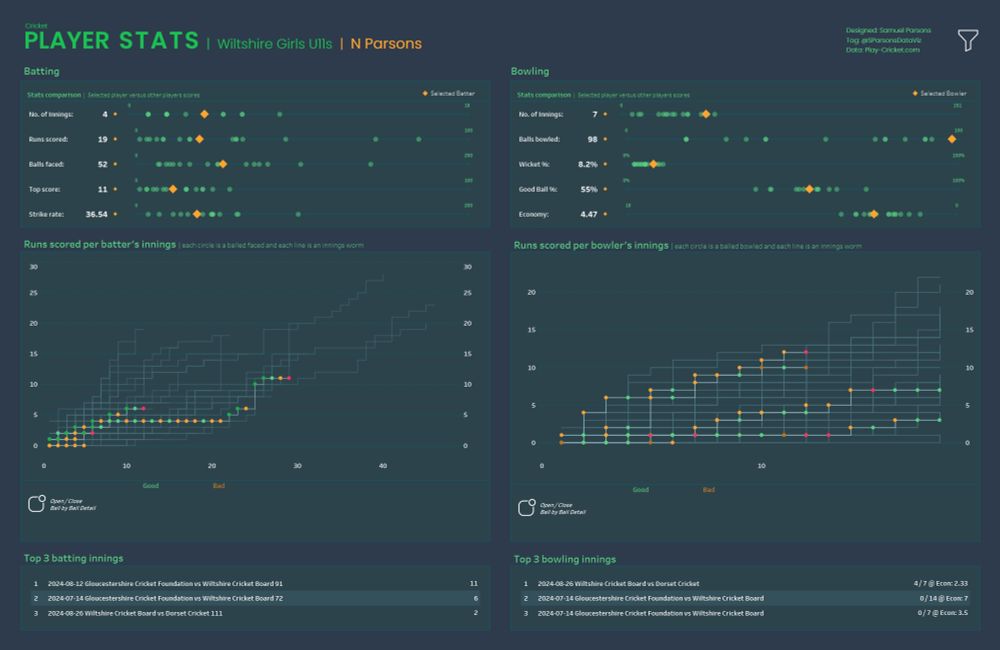
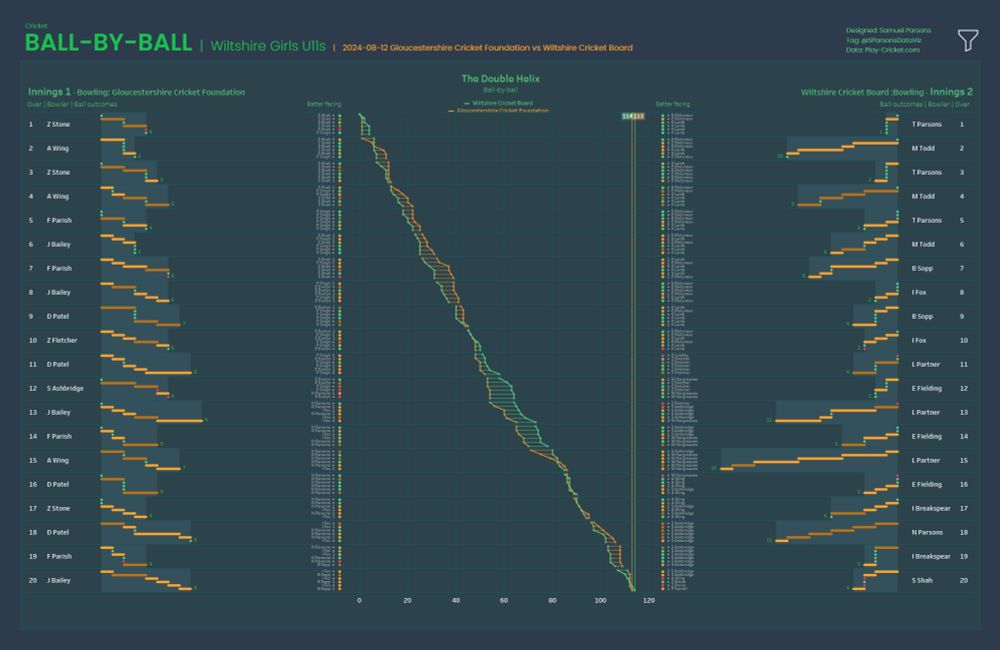
New viz - this is a personal project for me.
WILTSHIRE GIRLS COUNTY CRICKET
My 2 daughters have been playing county cricket for the last couple of seasons and I have pulled the data of the matches for their team and visualised it!
Link: tinyurl.com/ym7eznwb
WILTSHIRE GIRLS COUNTY CRICKET
My 2 daughters have been playing county cricket for the last couple of seasons and I have pulled the data of the matches for their team and visualised it!
Link: tinyurl.com/ym7eznwb
November 19, 2024 at 7:13 PM
New viz - this is a personal project for me.
WILTSHIRE GIRLS COUNTY CRICKET
My 2 daughters have been playing county cricket for the last couple of seasons and I have pulled the data of the matches for their team and visualised it!
Link: tinyurl.com/ym7eznwb
WILTSHIRE GIRLS COUNTY CRICKET
My 2 daughters have been playing county cricket for the last couple of seasons and I have pulled the data of the matches for their team and visualised it!
Link: tinyurl.com/ym7eznwb