


Henrik Singmann
@singmann.bsky.social
Associate Professor at UCL Experimental Psychology; math psych & cognitive psychology; statistical and cognitive modelling in R; German migrant worker in UK
See the same pattern for our Experiments 2 and 3 here. In Experiment 3, we added additional topics (e.g., Separating church from state causes more harm than good.) and more thoroughly controlled argument quality in three levels (good, internally inconsistent, and authority-based).


October 1, 2025 at 7:46 PM
See the same pattern for our Experiments 2 and 3 here. In Experiment 3, we added additional topics (e.g., Separating church from state causes more harm than good.) and more thoroughly controlled argument quality in three levels (good, internally inconsistent, and authority-based).
The pattern in the average data also holds for each of the arguments (each line/colour per panel is one specific argument). People who think a claim (e.g., "abortion should be legal") is false find the corresponding argument is bad; people who think the claim is true think the argument is good.

October 1, 2025 at 7:43 PM
The pattern in the average data also holds for each of the arguments (each line/colour per panel is one specific argument). People who think a claim (e.g., "abortion should be legal") is false find the corresponding argument is bad; people who think the claim is true think the argument is good.
Exciting #rstats news for Bayesian model comparison: bridgesampling is finally ready to support cmdstanr, see screenshot. Help us by installing the development version of bridgesampling and letting us know if it works for your model(s): pak::pkg_install("quentingronau/bridgesampling#44")
![R code and output showing the new functionality:
``` r
## pak::pkg_install("quentingronau/bridgesampling#44")
## see: https://cran.r-project.org/web/packages/bridgesampling/vignettes/bridgesampling_example_stan.html
library(bridgesampling)
### generate data ###
set.seed(12345)
mu <- 0
tau2 <- 0.5
sigma2 <- 1
n <- 20
theta <- rnorm(n, mu, sqrt(tau2))
y <- rnorm(n, theta, sqrt(sigma2))
### set prior parameters ###
mu0 <- 0
tau20 <- 1
alpha <- 1
beta <- 1
stancodeH0 <- 'data {
int<lower=1> n; // number of observations
vector[n] y; // observations
real<lower=0> alpha;
real<lower=0> beta;
real<lower=0> sigma2;
}
parameters {
real<lower=0> tau2; // group-level variance
vector[n] theta; // participant effects
}
model {
target += inv_gamma_lpdf(tau2 | alpha, beta);
target += normal_lpdf(theta | 0, sqrt(tau2));
target += normal_lpdf(y | theta, sqrt(sigma2));
}
'
tf <- withr::local_tempfile(fileext = ".stan")
writeLines(stancodeH0, tf)
mod <- cmdstanr::cmdstan_model(tf, quiet = TRUE, force_recompile = TRUE)
fitH0 <- mod$sample(
data = list(y = y, n = n,
alpha = alpha,
beta = beta,
sigma2 = sigma2),
seed = 202,
chains = 4,
parallel_chains = 4,
iter_warmup = 1000,
iter_sampling = 50000,
refresh = 0
)
#> Running MCMC with 4 parallel chains...
#>
#> Chain 3 finished in 0.8 seconds.
#> Chain 2 finished in 0.8 seconds.
#> Chain 4 finished in 0.8 seconds.
#> Chain 1 finished in 1.1 seconds.
#>
#> All 4 chains finished successfully.
#> Mean chain execution time: 0.9 seconds.
#> Total execution time: 1.2 seconds.
H0.bridge <- bridge_sampler(fitH0, silent = TRUE)
print(H0.bridge)
#> Bridge sampling estimate of the log marginal likelihood: -37.73301
#> Estimate obtained in 8 iteration(s) via method "normal".
#### Expected output:
## Bridge sampling estimate of the log marginal likelihood: -37.53183
## Estimate obtained in 5 iteration(s) via method "normal".
```](https://cdn.bsky.app/img/feed_thumbnail/plain/did:plc:lgxrkw556dtxkplwrj5rzlli/bafkreicf6zdyyjmaxrdfyq2sekokprym3c2o5atca6i2cczcx5zec4q4hm@jpeg)
September 2, 2025 at 9:16 AM
Exciting #rstats news for Bayesian model comparison: bridgesampling is finally ready to support cmdstanr, see screenshot. Help us by installing the development version of bridgesampling and letting us know if it works for your model(s): pak::pkg_install("quentingronau/bridgesampling#44")
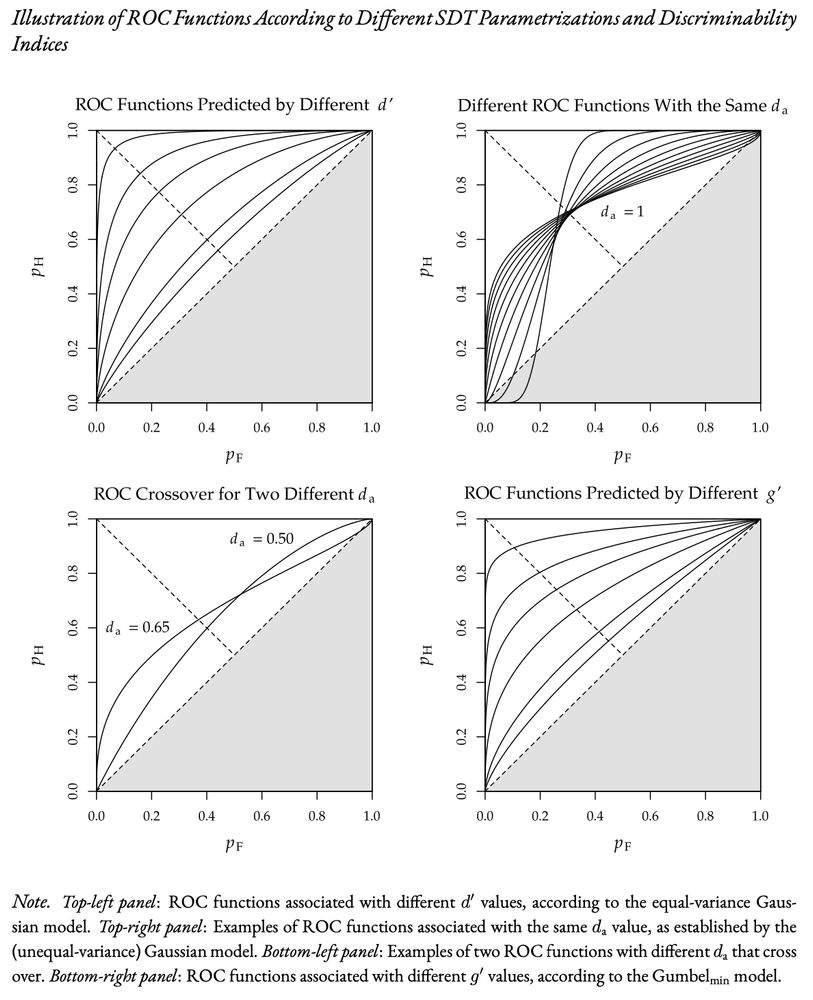
Yes & we discuss some shortcomings of d_a. As shown below, d_a does not permit an ordering of participants according to performance (d' and g' do). We also compare Type I error rates for g', d', and d_a for real H/FA-pairs where only response bias differs, only g' maintains 5% Type I errors (pp. 51)
April 28, 2025 at 6:46 AM
Yes & we discuss some shortcomings of d_a. As shown below, d_a does not permit an ordering of participants according to performance (d' and g' do). We also compare Type I error rates for g', d', and d_a for real H/FA-pairs where only response bias differs, only g' maintains 5% Type I errors (pp. 51)
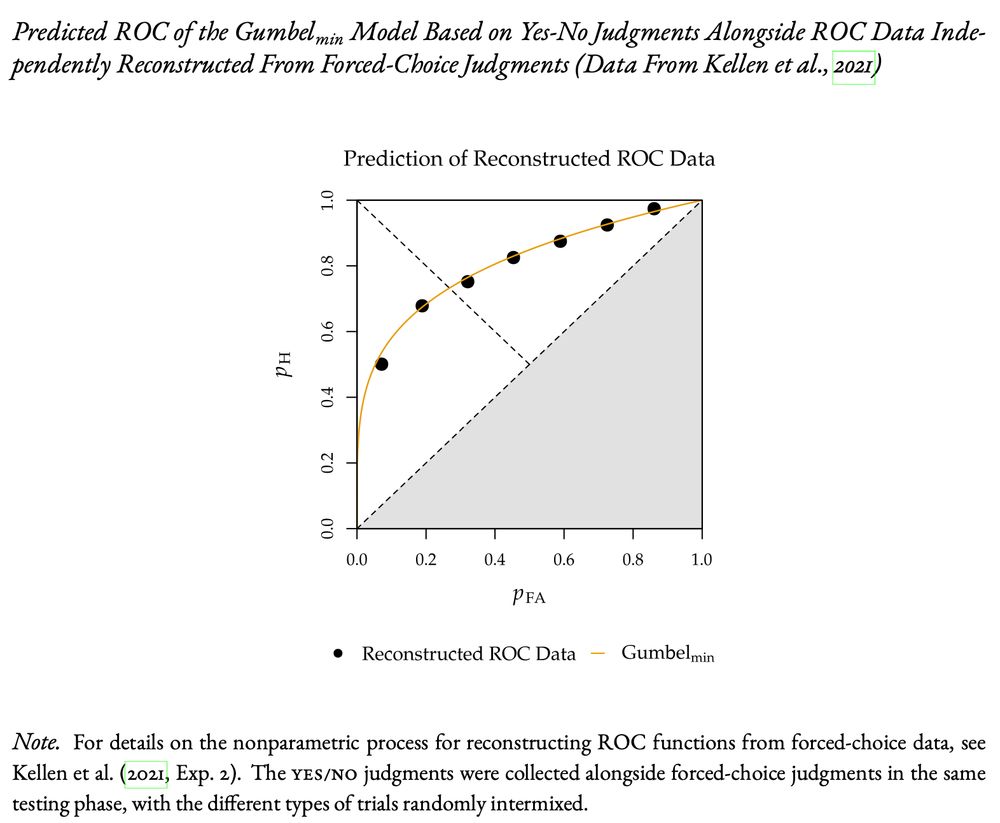
A particularly noteworthy example of a Gumbel-min prediction is shown here. The ROC predicted from g' (calculated from a single yes/no point) closely matches the ROC reconstruction derived independently from forced-choice judgments. The Gaussian model cannot even make a prediction in this case.
April 27, 2025 at 2:46 PM
A particularly noteworthy example of a Gumbel-min prediction is shown here. The ROC predicted from g' (calculated from a single yes/no point) closely matches the ROC reconstruction derived independently from forced-choice judgments. The Gaussian model cannot even make a prediction in this case.
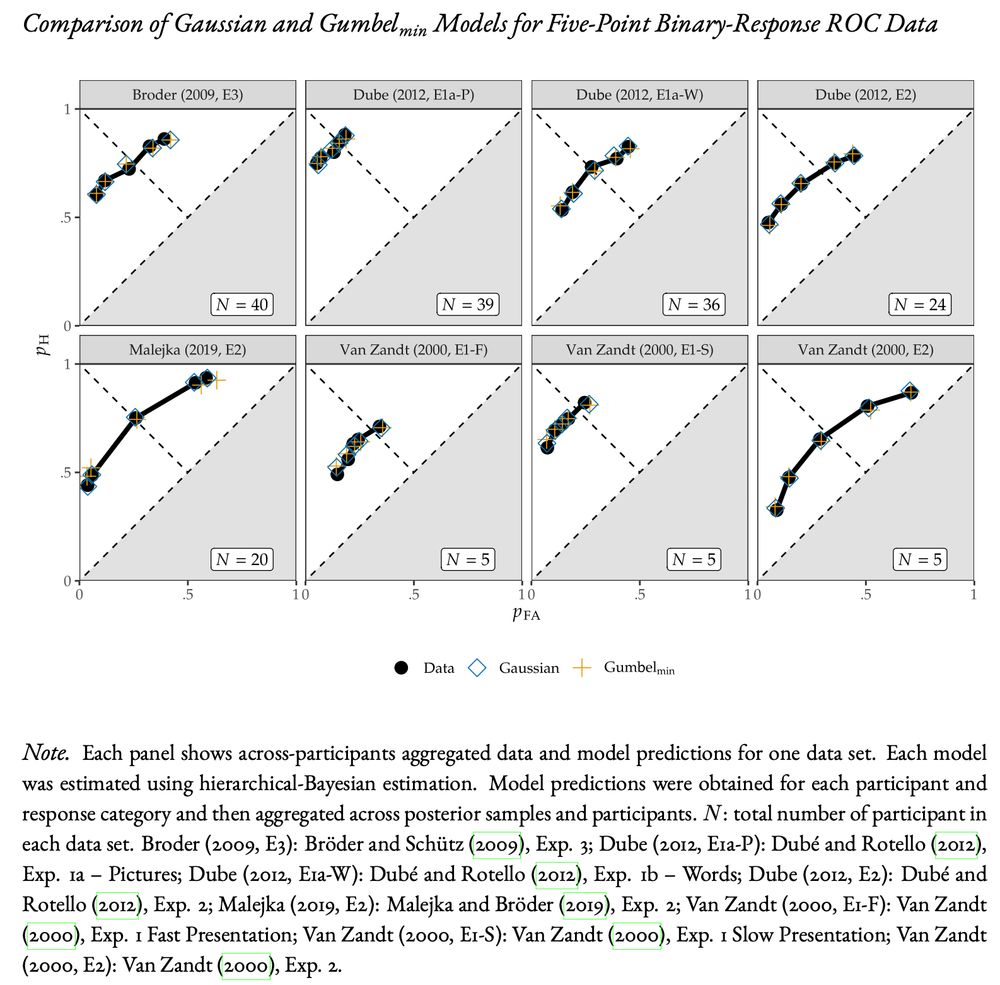
We compared the descriptive performance of both models across 35 datasets from four different recognition memory paradigms. The Gumbel-min model fits the data nearly as well as the Gaussian model. Once model complexity was penalized via AIC, the Gumbel-min model matched or outperformed the Gaussian.


April 27, 2025 at 2:46 PM
We compared the descriptive performance of both models across 35 datasets from four different recognition memory paradigms. The Gumbel-min model fits the data nearly as well as the Gaussian model. Once model complexity was penalized via AIC, the Gumbel-min model matched or outperformed the Gaussian.
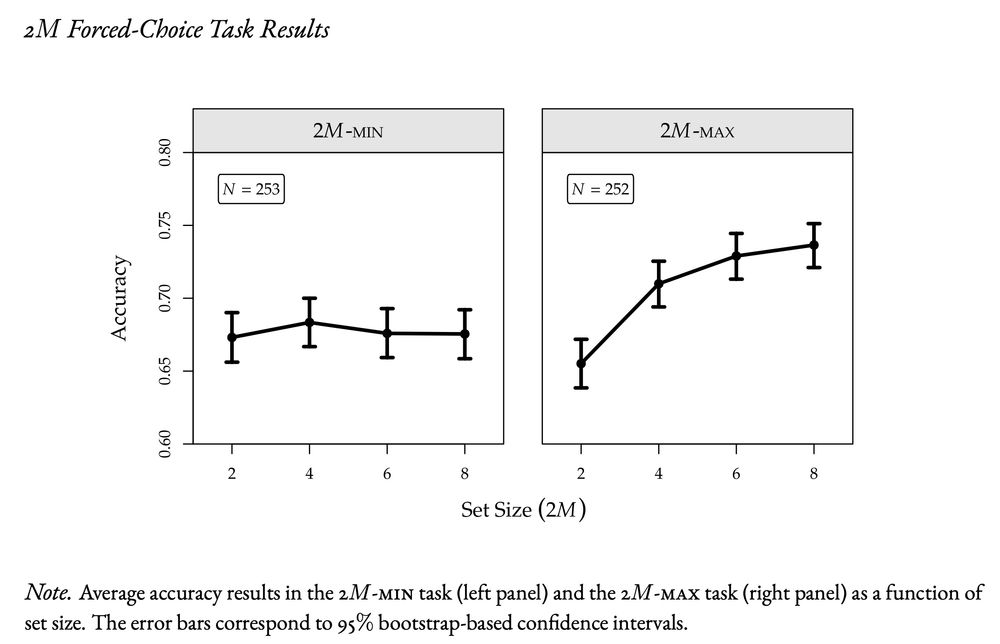
The Gumbel-min model implies a behavioural principle: the probability of choosing a new item remains constant as choice sets grow. An experiment confirms this principle with constant accuracy for new item detection (2M-min). For old-item detection (2M-max), accuracy increase with choice set.
April 27, 2025 at 2:46 PM
The Gumbel-min model implies a behavioural principle: the probability of choosing a new item remains constant as choice sets grow. An experiment confirms this principle with constant accuracy for new item detection (2M-min). For old-item detection (2M-max), accuracy increase with choice set.
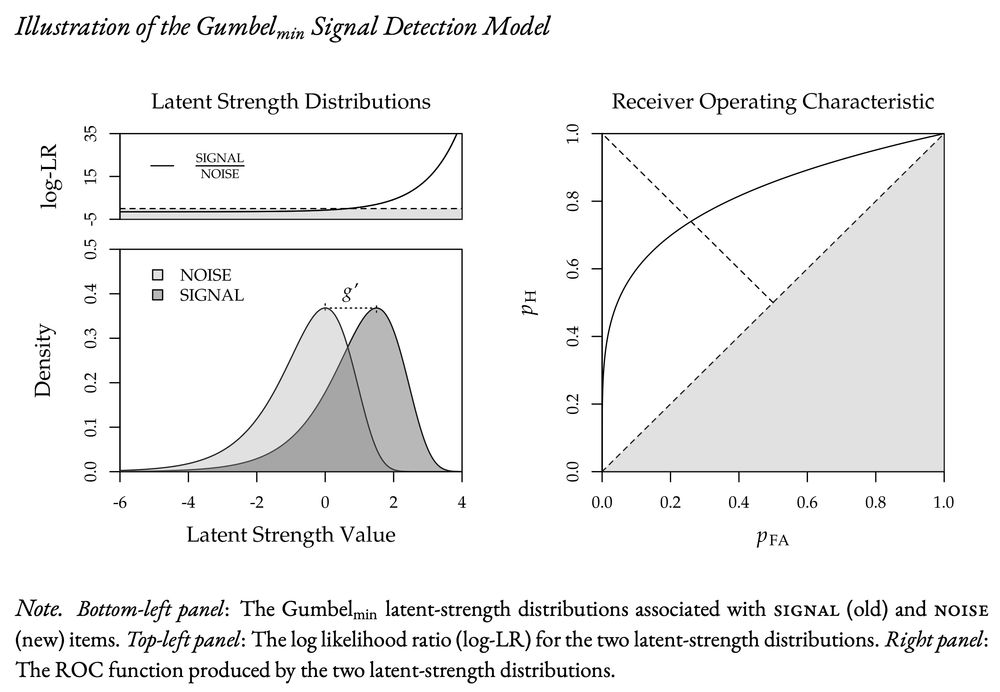
We consider an SDT model assuming Gumbel-min (i.e., minimum extreme-value) distributions. The Gumbel-min model avoids the problrms of the Gaussian model, predicts asymmetric ROCs assuming equal variances, and allows calculating measures of discriminability and response bias, g′ and kappa.

April 27, 2025 at 2:46 PM
We consider an SDT model assuming Gumbel-min (i.e., minimum extreme-value) distributions. The Gumbel-min model avoids the problrms of the Gaussian model, predicts asymmetric ROCs assuming equal variances, and allows calculating measures of discriminability and response bias, g′ and kappa.
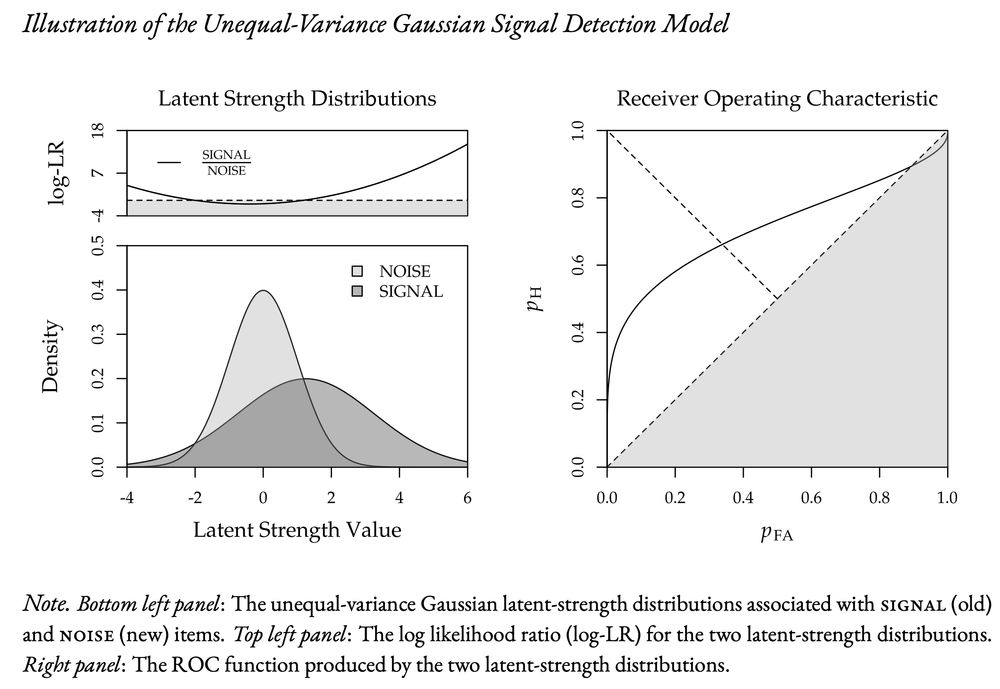
In recognition memory, ROCs are typically asymmetric, which requires Gaussian distributions with unequal variance. One problem with the unequal-variance model is that it predicts below chance performance for items with very low familiarity (i.e., studying makes some items less familiar).
April 27, 2025 at 2:46 PM
In recognition memory, ROCs are typically asymmetric, which requires Gaussian distributions with unequal variance. One problem with the unequal-variance model is that it predicts below chance performance for items with very low familiarity (i.e., studying makes some items less familiar).
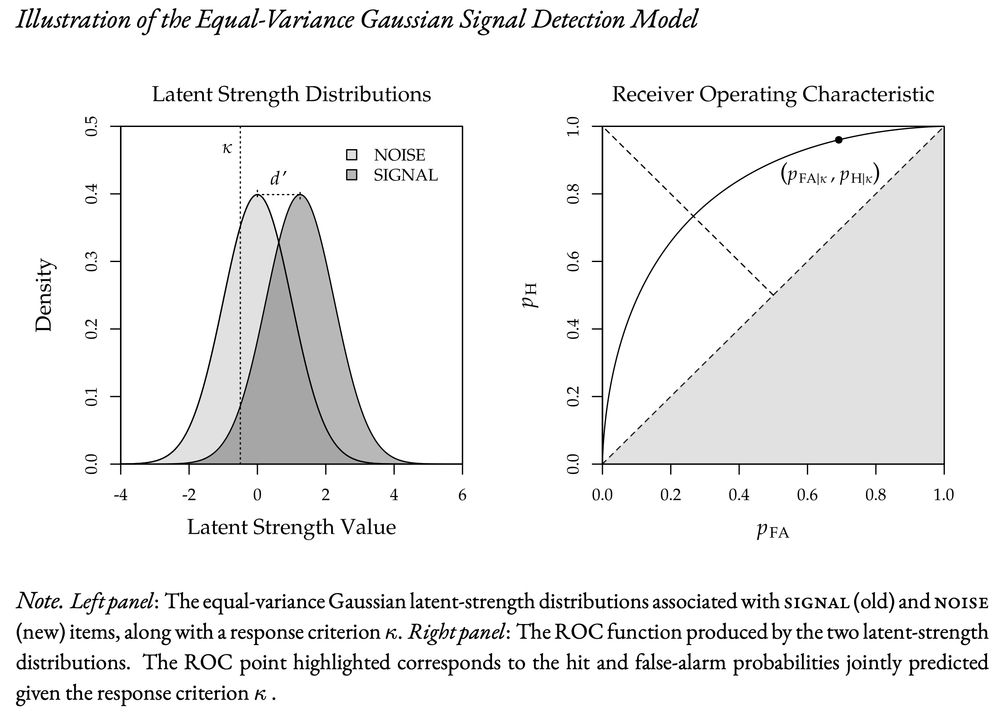
SDT is a cornerstone of recognition memory research, primarily assuming Gaussian distributions – a choice based more on tradition than necessity. The standard model assumes two equal-variance distributions, allows calculating d′ from a pair of hits and false alarms, and predicts symmetric ROCs.
April 27, 2025 at 2:46 PM
SDT is a cornerstone of recognition memory research, primarily assuming Gaussian distributions – a choice based more on tradition than necessity. The standard model assumes two equal-variance distributions, allows calculating d′ from a pair of hits and false alarms, and predicts symmetric ROCs.
Results were in line with the qualitative predictions derived from sampling-based models. Predictions also held for the two types of illogical rankings we looked at. We do not know of any other (i.e. non-sampling) model that can make these qualitative predictions and predict illogical rankings.
March 20, 2025 at 9:42 AM
Results were in line with the qualitative predictions derived from sampling-based models. Predictions also held for the two types of illogical rankings we looked at. We do not know of any other (i.e. non-sampling) model that can make these qualitative predictions and predict illogical rankings.
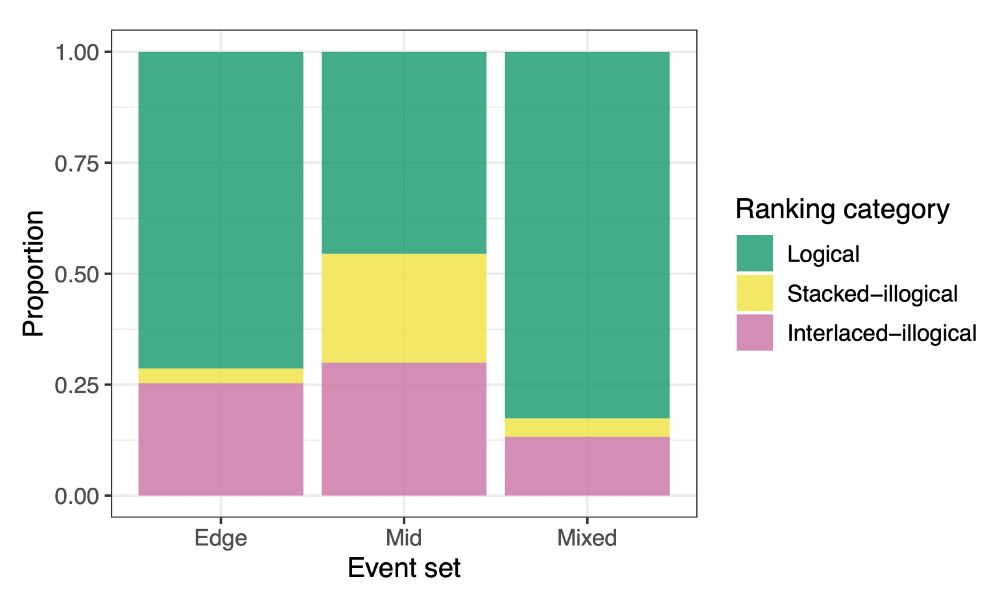
Simulation results show different qualitative pattern across event sets. Pr(logical ranking) is largest for mixed sets, followed by edge-event sets, followed by mid-event sets. This pattern held independently of sample size or whether there was additional read-out noise in the sampling process.

March 19, 2025 at 10:21 PM
Simulation results show different qualitative pattern across event sets. Pr(logical ranking) is largest for mixed sets, followed by edge-event sets, followed by mid-event sets. This pattern held independently of sample size or whether there was additional read-out noise in the sampling process.
We simulate the probability of obtaining logical and two types of illogical rankings for three different event sets: Edge events (P(A) & P(B) ≈ 1), mid-events (P(A) & P(B) ≈ .5), and mixed sets (P(A) ≈ 1 & P(B) ≈ .5).

March 19, 2025 at 10:18 PM
We simulate the probability of obtaining logical and two types of illogical rankings for three different event sets: Edge events (P(A) & P(B) ≈ 1), mid-events (P(A) & P(B) ≈ .5), and mixed sets (P(A) ≈ 1 & P(B) ≈ .5).
In each trial of the event ranking task, participants have to rank an event set consisting of four events, A, not-A, B, and not-B, in terms of their perceived likelihoods. The task contains an embedded logical that allows to classify the obtained ranking as logical or illogical.

March 19, 2025 at 9:49 PM
In each trial of the event ranking task, participants have to rank an event set consisting of four events, A, not-A, B, and not-B, in terms of their perceived likelihoods. The task contains an embedded logical that allows to classify the obtained ranking as logical or illogical.


If you want to see a bit more up to date explanation, Macmillman & Creelman (2005, ch. 3) also describe the process.

January 14, 2025 at 9:40 AM
If you want to see a bit more up to date explanation, Macmillman & Creelman (2005, ch. 3) also describe the process.
Bluesky is delivering some mixed messages here

December 13, 2024 at 10:54 AM
Bluesky is delivering some mixed messages here
This term in my stats teaching, I regularly included images of Moo Deng into my slides. One of my students was clearly inspired by this combination and made this super cool drawing of Moo Deng doing stats herself. I love it so much. Stats is Moo Deng Approved!

December 12, 2024 at 12:42 PM
This term in my stats teaching, I regularly included images of Moo Deng into my slides. One of my students was clearly inspired by this combination and made this super cool drawing of Moo Deng doing stats herself. I love it so much. Stats is Moo Deng Approved!
Getting ready for my last week of teaching with a new stats meme

December 8, 2024 at 10:06 PM
Getting ready for my last week of teaching with a new stats meme
Be careful how many emails you send to the CRAN maintainers (and in which format), otherwise your package might get removed from CRAN. Found on the r-package-devel mailing list. #rstats

November 12, 2024 at 6:53 PM
Be careful how many emails you send to the CRAN maintainers (and in which format), otherwise your package might get removed from CRAN. Found on the r-package-devel mailing list. #rstats
Finally a humble LLM paper.
![Abstract
Establishing a unified theory of cognition has been a major goal of psychology [1, 2]. While there have been previous attempts to instantiate such theories by building computational models [1, 2], we currently do not have one model that captures the human mind in its entirety. Here we introduce Centaur, a computational model that can predict and simulate human behavior in any experiment expressible in natural language. We derived Centaur by finetuning a state-of-theart language model on a novel, large-scale data set called Psych-101. Psych-101 reaches an unprecedented scale, covering trial-by-trial data from over 60,000 participants performing over 10,000,000 choices in 160 experiments. Centaur not only captures the behavior of held-out participants better than existing cognitive models, but also generalizes to new cover stories, structural task modifications, and entirely new domains. Furthermore, we find that the model’s internal representations become more aligned with human neural activity after finetuning. Taken together, Centaur is the first real candidate for a unified model of human cognition. We anticipate that it will have a disruptive impact on the cognitive sciences, challenging the existing paradigm for developing computational models.
Keywords: cognitive science, cognitive modeling, unified theory of cognition, large language models](https://cdn.bsky.app/img/feed_thumbnail/plain/did:plc:lgxrkw556dtxkplwrj5rzlli/bafkreifeef77udzg5p64o26brzpym43ykjuxqotv5twwkcre3qsl53uncu@jpeg)
October 27, 2024 at 10:58 PM
Finally a humble LLM paper.
Getting ready for my stats teaching tomorrow and looks like my meme game is on point. I really hope stats meme never go out of fashion (and if so, please no one tell me).


October 27, 2024 at 9:29 PM
Getting ready for my stats teaching tomorrow and looks like my meme game is on point. I really hope stats meme never go out of fashion (and if so, please no one tell me).
In addition to finding strong evidence for the use of compensatory decision strategies. We found evidence for considerable individual differences. The figure shows both mean and individual-level thresholds between the numerical and categorical impacts.

October 17, 2024 at 3:41 PM
In addition to finding strong evidence for the use of compensatory decision strategies. We found evidence for considerable individual differences. The figure shows both mean and individual-level thresholds between the numerical and categorical impacts.
For both numerical and categorical judgements we found that weather scientists used compensatory decision strategies. An increase on any impact variable led to an increase in perceived severity, even when adjusting for the effect of the other impacts.

October 17, 2024 at 3:35 PM
For both numerical and categorical judgements we found that weather scientists used compensatory decision strategies. An increase on any impact variable led to an increase in perceived severity, even when adjusting for the effect of the other impacts.