


Changing Ocean Biological Systems working group
@scor-cobs.bsky.social
How do interacting drivers/stressors shape the oceans? Sharing new research, workshops, and tools for experimental design, data analysis, mathematical models, and more.
https://scor149-ocean.com
https://meddle-scor149.org/
https://scor149-ocean.com
https://meddle-scor149.org/
We've written tutorials in R on how to analyse your experimental data. This includes how your experiment & analyses can be used to answer scientific questions and provide input into mathematical models.
bsky.app/profile/scor...
bsky.app/profile/scor...
Ever wondered how to analyse your experimental data? 🌊🧪🌍
We’ve developed a series of tutorials in R to guide you through analysing & visualising data from single & multiple driver experiments.
Beginners and experts, we've got something for all of you.
Please share!
meddle-scor149.org/vignettes/
We’ve developed a series of tutorials in R to guide you through analysing & visualising data from single & multiple driver experiments.
Beginners and experts, we've got something for all of you.
Please share!
meddle-scor149.org/vignettes/
Vignettes - Meddle
The MEDDLE data analysis tutorials illustrate statistical approaches for single and multiple driver experiments. The tutorials are not meant as an exhaustive list, nor do they replace formal statistic...
meddle-scor149.org
May 6, 2025 at 2:38 PM
We've written tutorials in R on how to analyse your experimental data. This includes how your experiment & analyses can be used to answer scientific questions and provide input into mathematical models.
bsky.app/profile/scor...
bsky.app/profile/scor...
Feedback welcome! We plan to update these, and to add more in the future.
April 28, 2025 at 11:55 AM
Feedback welcome! We plan to update these, and to add more in the future.
7. Model-averaging, by Peter Dillingham:
Explore how model-averaging enhances the analysis of multi-driver marine experiments with nested and crossed designs, using Arthrocardia under future ocean conditions as a case study: nzoac.nz/s/Model-aver....
Explore how model-averaging enhances the analysis of multi-driver marine experiments with nested and crossed designs, using Arthrocardia under future ocean conditions as a case study: nzoac.nz/s/Model-aver....
Model-averaging for experiments
nzoac.nz
April 28, 2025 at 11:55 AM
7. Model-averaging, by Peter Dillingham:
Explore how model-averaging enhances the analysis of multi-driver marine experiments with nested and crossed designs, using Arthrocardia under future ocean conditions as a case study: nzoac.nz/s/Model-aver....
Explore how model-averaging enhances the analysis of multi-driver marine experiments with nested and crossed designs, using Arthrocardia under future ocean conditions as a case study: nzoac.nz/s/Model-aver....
6. Multiple driver response surfaces, by @mridulkthomas.bsky.social and @sineadcollins.bsky.social
Learn 3 ways to analyse data from a temperature x nutrients response surface experiment, and use the output to understand where in the oceans the species does well.
nzoac.nz/s/Response_s...
Learn 3 ways to analyse data from a temperature x nutrients response surface experiment, and use the output to understand where in the oceans the species does well.
nzoac.nz/s/Response_s...
Fitting a response surface to data from multiple-driver experiments
nzoac.nz
April 28, 2025 at 11:55 AM
6. Multiple driver response surfaces, by @mridulkthomas.bsky.social and @sineadcollins.bsky.social
Learn 3 ways to analyse data from a temperature x nutrients response surface experiment, and use the output to understand where in the oceans the species does well.
nzoac.nz/s/Response_s...
Learn 3 ways to analyse data from a temperature x nutrients response surface experiment, and use the output to understand where in the oceans the species does well.
nzoac.nz/s/Response_s...
5. Single-driver response curves, by @mridulkthomas.bsky.social and @sineadcollins.bsky.social
Learn how to fit a temperature response curve to a simulated phytoplankton growth rate experiment. Then use the curve to learn about how the species performs across space & time.
nzoac.nz/s/Single_dri...
Learn how to fit a temperature response curve to a simulated phytoplankton growth rate experiment. Then use the curve to learn about how the species performs across space & time.
nzoac.nz/s/Single_dri...
Fitting a response curve (reaction norm) to data from single-driver experiments
nzoac.nz
April 28, 2025 at 11:55 AM
5. Single-driver response curves, by @mridulkthomas.bsky.social and @sineadcollins.bsky.social
Learn how to fit a temperature response curve to a simulated phytoplankton growth rate experiment. Then use the curve to learn about how the species performs across space & time.
nzoac.nz/s/Single_dri...
Learn how to fit a temperature response curve to a simulated phytoplankton growth rate experiment. Then use the curve to learn about how the species performs across space & time.
nzoac.nz/s/Single_dri...
4. Time-response variables, by Sam Dupont, Peter Dillingham & christinamcgraw.bsky.social
Dive into modelling time-response data with R, using a sea urchin experiment to explore how environmental factors shape growth over time:
nzoac.nz/s/Time_respo...
Dive into modelling time-response data with R, using a sea urchin experiment to explore how environmental factors shape growth over time:
nzoac.nz/s/Time_respo...
christinamcgraw.bsky.social
christinamcgraw.bsky.social
April 28, 2025 at 11:55 AM
4. Time-response variables, by Sam Dupont, Peter Dillingham & christinamcgraw.bsky.social
Dive into modelling time-response data with R, using a sea urchin experiment to explore how environmental factors shape growth over time:
nzoac.nz/s/Time_respo...
Dive into modelling time-response data with R, using a sea urchin experiment to explore how environmental factors shape growth over time:
nzoac.nz/s/Time_respo...
3. Blocking in time, by Steeve Comeau and @chrisecornwall.bsky.social
Learn how to estimate the effects of two drivers on a response when your experiment is ‘blocked’ i.e. experimental units grouped in time, often because it’s not feasible to do all at once.
nzoac.nz/s/Blocking_i...
Learn how to estimate the effects of two drivers on a response when your experiment is ‘blocked’ i.e. experimental units grouped in time, often because it’s not feasible to do all at once.
nzoac.nz/s/Blocking_i...
Blocking in time
nzoac.nz
April 28, 2025 at 11:55 AM
3. Blocking in time, by Steeve Comeau and @chrisecornwall.bsky.social
Learn how to estimate the effects of two drivers on a response when your experiment is ‘blocked’ i.e. experimental units grouped in time, often because it’s not feasible to do all at once.
nzoac.nz/s/Blocking_i...
Learn how to estimate the effects of two drivers on a response when your experiment is ‘blocked’ i.e. experimental units grouped in time, often because it’s not feasible to do all at once.
nzoac.nz/s/Blocking_i...
2. Analysing scenarios, by Steeve Comeau and @chrisecornwall.bsky.social
Learn how to estimate the effects of two drivers on a response when your experimental treatments are designed to reflect future climate scenarios.
nzoac.nz/s/Scenario_a...
Learn how to estimate the effects of two drivers on a response when your experimental treatments are designed to reflect future climate scenarios.
nzoac.nz/s/Scenario_a...
Scenario approach
nzoac.nz
April 28, 2025 at 11:55 AM
2. Analysing scenarios, by Steeve Comeau and @chrisecornwall.bsky.social
Learn how to estimate the effects of two drivers on a response when your experimental treatments are designed to reflect future climate scenarios.
nzoac.nz/s/Scenario_a...
Learn how to estimate the effects of two drivers on a response when your experimental treatments are designed to reflect future climate scenarios.
nzoac.nz/s/Scenario_a...
1. Statistical power, by Peter Dillingham:
Explore how to use R's built-in functions and simulations to assess the statistical power of a study on sea urchin growth under changing ocean conditions.
nzoac.nz/s/Power-vign...
Explore how to use R's built-in functions and simulations to assess the statistical power of a study on sea urchin growth under changing ocean conditions.
nzoac.nz/s/Power-vign...
Power calculation using built-in R functions or via simulation
nzoac.nz
April 28, 2025 at 11:55 AM
1. Statistical power, by Peter Dillingham:
Explore how to use R's built-in functions and simulations to assess the statistical power of a study on sea urchin growth under changing ocean conditions.
nzoac.nz/s/Power-vign...
Explore how to use R's built-in functions and simulations to assess the statistical power of a study on sea urchin growth under changing ocean conditions.
nzoac.nz/s/Power-vign...
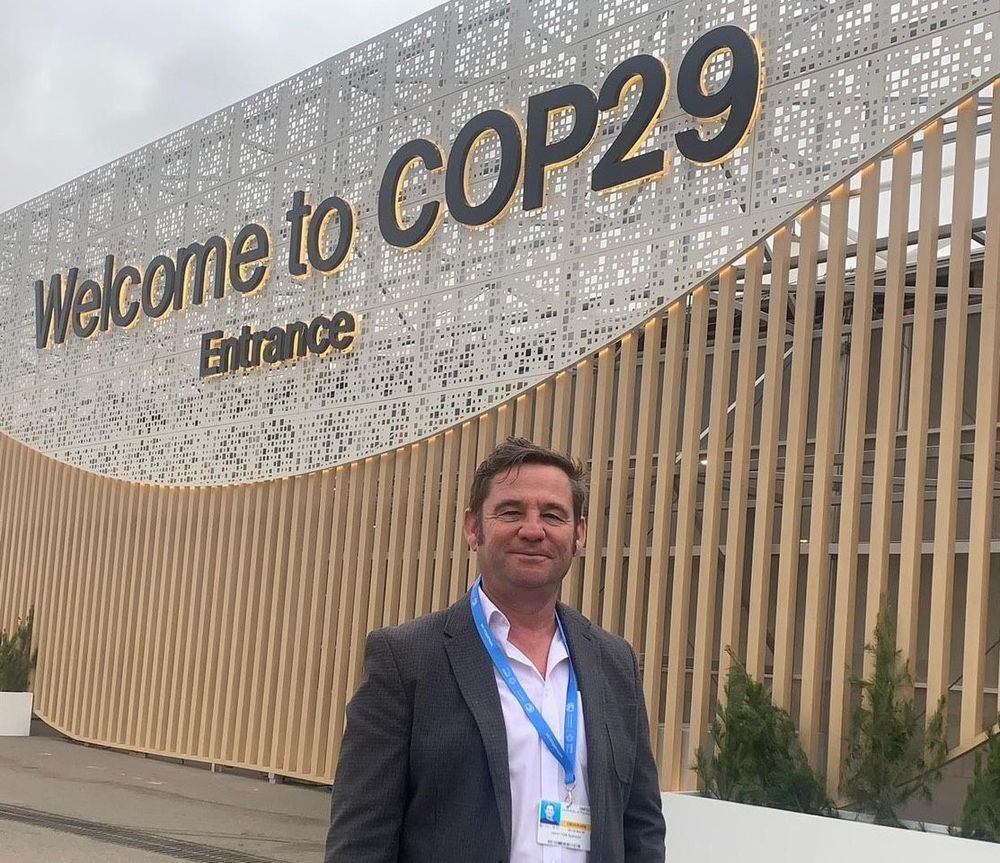
And Jason Hall-Spencer was at COP29, sharing insights on why the ocean is important for our future climate and therefore ongoing climate negotiations.
www.linkedin.com/posts/plymou...
www.linkedin.com/posts/plymou...
December 2, 2024 at 3:31 PM
And Jason Hall-Spencer was at COP29, sharing insights on why the ocean is important for our future climate and therefore ongoing climate negotiations.
www.linkedin.com/posts/plymou...
www.linkedin.com/posts/plymou...
Thank you, and likewise! We are of course very interested in the tropics too, and had a meeting about coral reefs this past summer as well.
November 15, 2024 at 10:10 AM
Thank you, and likewise! We are of course very interested in the tropics too, and had a meeting about coral reefs this past summer as well.
We've written papers/guides about how to improve experimental design so that we learn more from experiments.
We also teach workshops and build tools based on these principles. 🌊
onlinelibrary.wiley.com/doi/10.1111/...
www.sciencedirect.com/science/arti...
www.annualreviews.org/content/jour...
We also teach workshops and build tools based on these principles. 🌊
onlinelibrary.wiley.com/doi/10.1111/...
www.sciencedirect.com/science/arti...
www.annualreviews.org/content/jour...
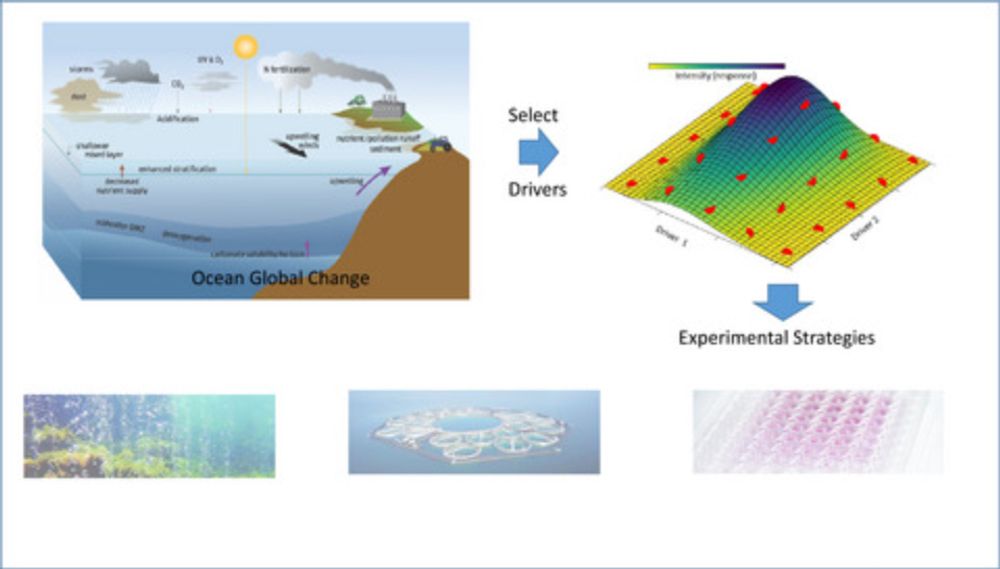
Experimental strategies to assess the biological ramifications of multiple drivers of global ocean change—A review
Marine life is controlled by multiple physical and chemical drivers and by diverse ecological processes. Many of these oceanic properties are being altered by climate change and other anthropogenic p...
onlinelibrary.wiley.com
November 12, 2024 at 2:30 PM
We've written papers/guides about how to improve experimental design so that we learn more from experiments.
We also teach workshops and build tools based on these principles. 🌊
onlinelibrary.wiley.com/doi/10.1111/...
www.sciencedirect.com/science/arti...
www.annualreviews.org/content/jour...
We also teach workshops and build tools based on these principles. 🌊
onlinelibrary.wiley.com/doi/10.1111/...
www.sciencedirect.com/science/arti...
www.annualreviews.org/content/jour...
Thanks for this, David. Could you add us to the list as well?
November 12, 2024 at 10:31 AM
Thanks for this, David. Could you add us to the list as well?
Hi David - could you please add us to the feed? Thanks!
November 12, 2024 at 7:58 AM
Hi David - could you please add us to the feed? Thanks!