


Samuel Marsh Ph.D.
@samuelmarsh.bsky.social
Postdoc Beth Stevens Lab | Interested in Alzheimer’s disease, all things single cell, and neuroimmune | Dad 👧👶🏻 | #scicomm #rstats | NEU ‘10 & UCI ’16
https://samuel-marsh.science
https://samuel-marsh.science
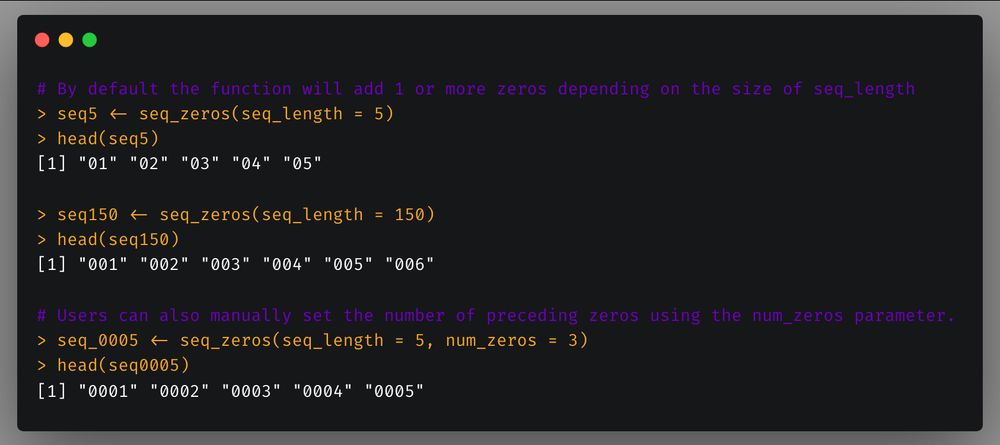
scCustomize now includes `seq_zeros` function to easily create sequences with preceding zeros. You can either specify the number of preceding zeros desired or the function will set automatically based on sequence length.
17/n
17/n
December 6, 2024 at 4:36 PM
scCustomize now includes `seq_zeros` function to easily create sequences with preceding zeros. You can either specify the number of preceding zeros desired or the function will set automatically based on sequence length.
17/n
17/n
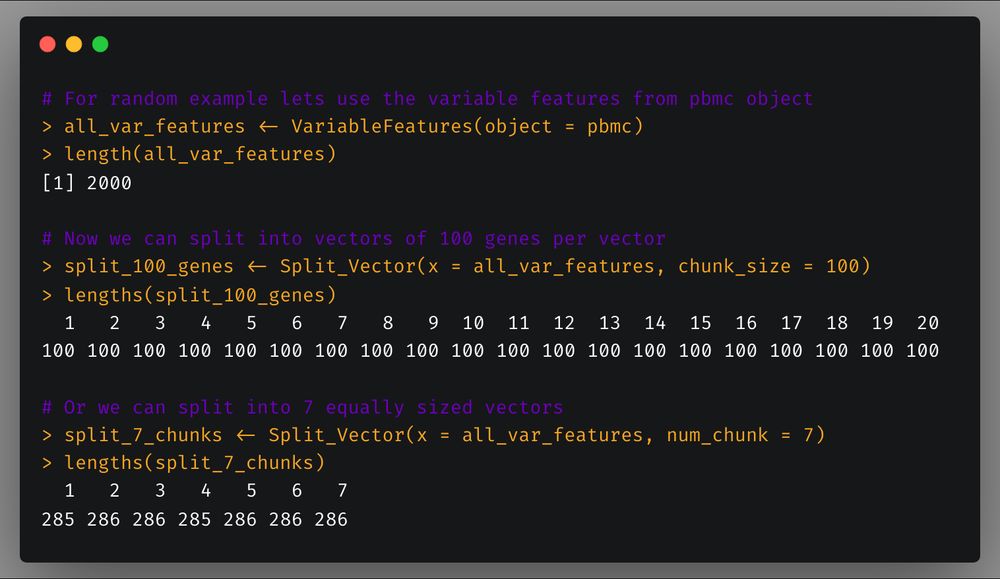
Now here’s two functions that aren’t limited to scRNA-seq analysis but can generally be helpful in your work in R.
First, `Split_Vector` which allows you to split a vector in a specified number of chunks or chunks of specific length.
15/n
First, `Split_Vector` which allows you to split a vector in a specified number of chunks or chunks of specific length.
15/n
December 6, 2024 at 4:36 PM
Now here’s two functions that aren’t limited to scRNA-seq analysis but can generally be helpful in your work in R.
First, `Split_Vector` which allows you to split a vector in a specified number of chunks or chunks of specific length.
15/n
First, `Split_Vector` which allows you to split a vector in a specified number of chunks or chunks of specific length.
15/n
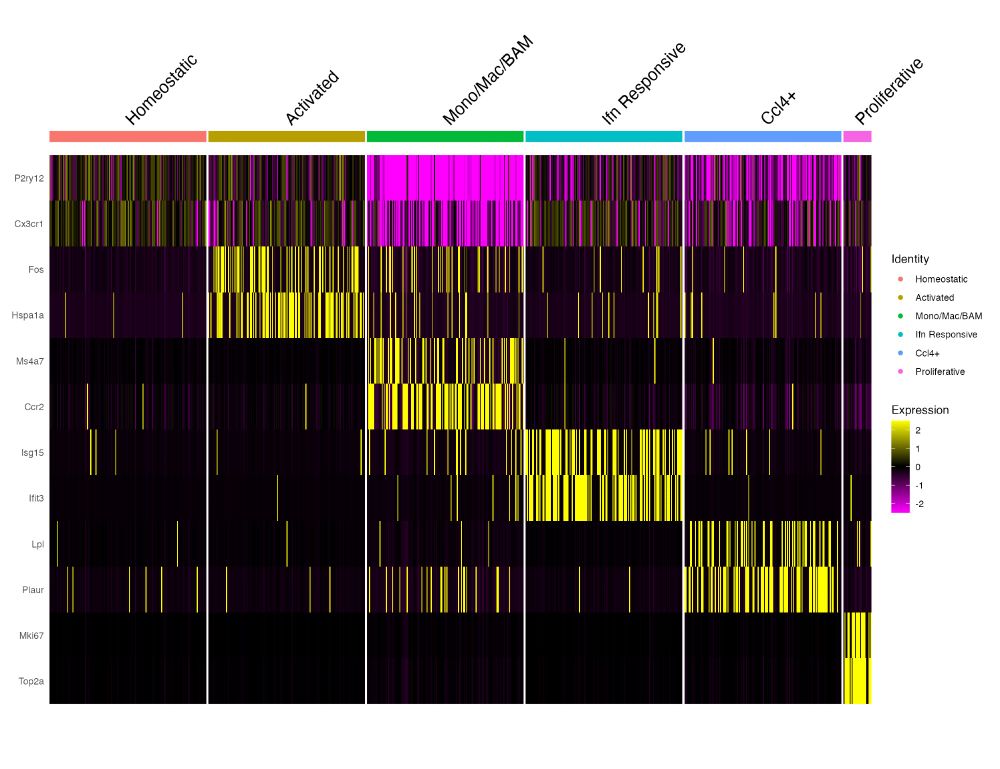
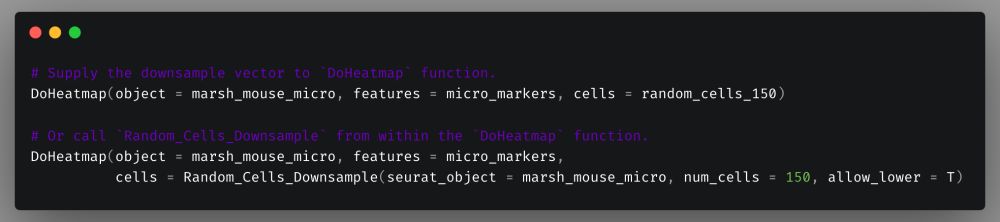
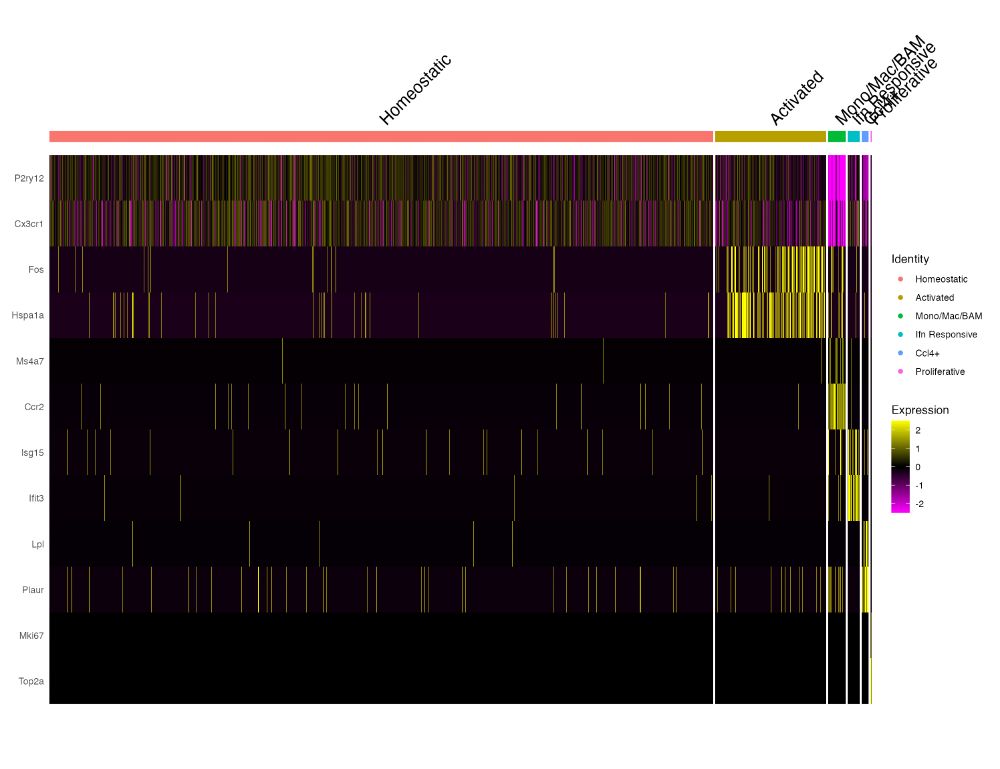
Now we supply that to `cells` parameter of `DoHeatmap` and the result now looks like this. We can now clearly visualize the differences in expression between the identities.
To make it even easier you can also just call `Random_Cells_Downsample` from within the `DoHeatmap` call.
14/n
To make it even easier you can also just call `Random_Cells_Downsample` from within the `DoHeatmap` call.
14/n
December 6, 2024 at 4:36 PM
Now we supply that to `cells` parameter of `DoHeatmap` and the result now looks like this. We can now clearly visualize the differences in expression between the identities.
To make it even easier you can also just call `Random_Cells_Downsample` from within the `DoHeatmap` call.
14/n
To make it even easier you can also just call `Random_Cells_Downsample` from within the `DoHeatmap` call.
14/n
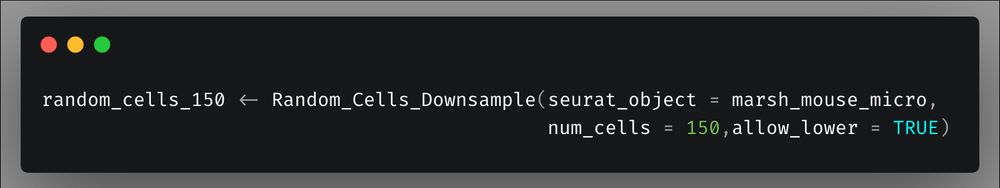
However, by using `Random_Cells_Downsample` we can create a plot with equal number of cells per identity for proper visualization. Here I create a down sampled cell vector of 150 cells per group (or the max number of cells for groups smaller than 150 cells)
13/n
13/n
December 6, 2024 at 4:36 PM
However, by using `Random_Cells_Downsample` we can create a plot with equal number of cells per identity for proper visualization. Here I create a down sampled cell vector of 150 cells per group (or the max number of cells for groups smaller than 150 cells)
13/n
13/n
The default cell level heatmap scales the size of each identity based on the number of cells. This can lead to heatmaps where visualizing the expression in small clusters can be nearly impossible.
12/n
12/n
December 6, 2024 at 4:36 PM
The default cell level heatmap scales the size of each identity based on the number of cells. This can lead to heatmaps where visualizing the expression in small clusters can be nearly impossible.
12/n
12/n
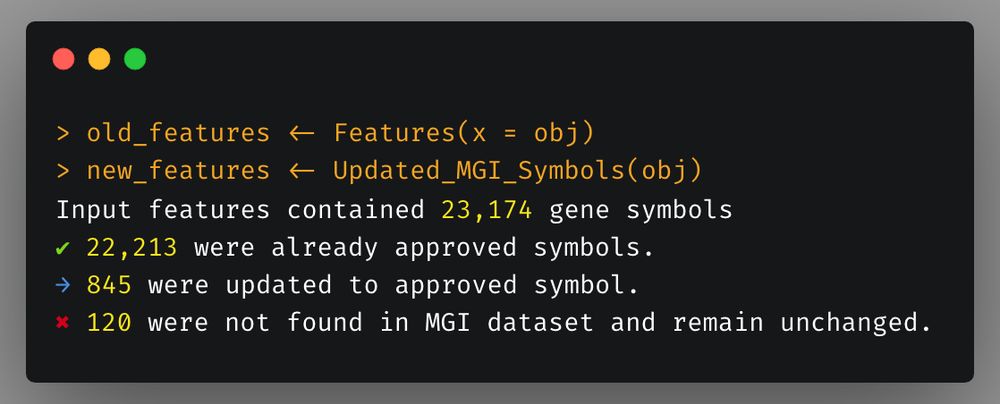
The last scCustomize update brought the advance of `Updated_HGNC_Symbols` for updating human gene symbols. This update brings the equivalent function of mice using MGI database: `Updated_MGI_Symbols`.
9/n
9/n
December 6, 2024 at 4:36 PM
The last scCustomize update brought the advance of `Updated_HGNC_Symbols` for updating human gene symbols. This update brings the equivalent function of mice using MGI database: `Updated_MGI_Symbols`.
9/n
9/n
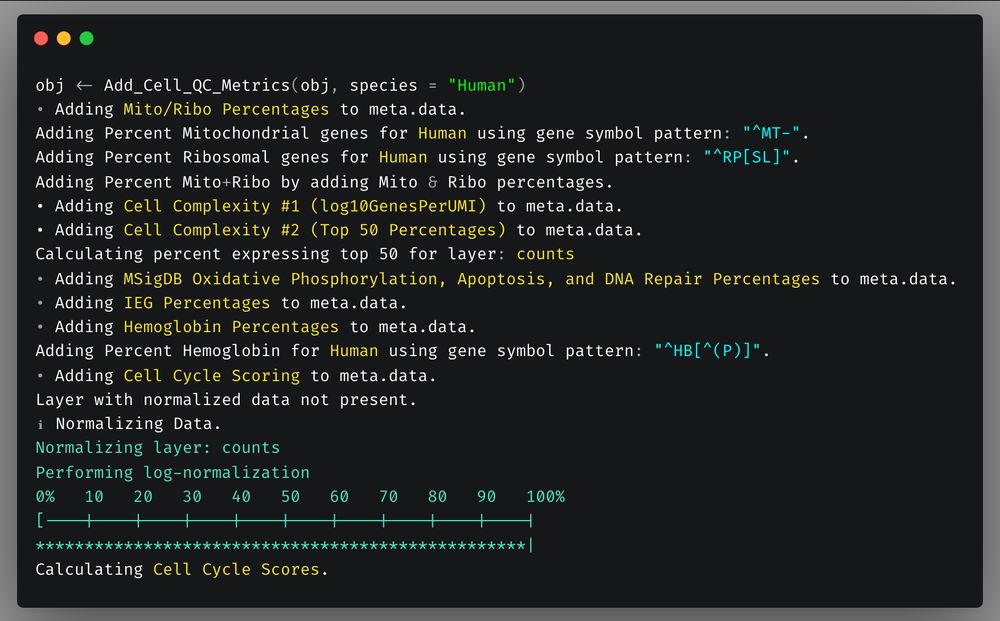
First, QC functions.
`Add_Cell_QC_Metrics` now includes addition of % of hemoglobin counts as metric & chicken was added to default species.
Default species are now human, mouse, rat, drosophila, zebrafish, macaque, marmoset, & chicken.
One line will add all QC metrics to your object.
2/n
`Add_Cell_QC_Metrics` now includes addition of % of hemoglobin counts as metric & chicken was added to default species.
Default species are now human, mouse, rat, drosophila, zebrafish, macaque, marmoset, & chicken.
One line will add all QC metrics to your object.
2/n
December 6, 2024 at 4:36 PM
First, QC functions.
`Add_Cell_QC_Metrics` now includes addition of % of hemoglobin counts as metric & chicken was added to default species.
Default species are now human, mouse, rat, drosophila, zebrafish, macaque, marmoset, & chicken.
One line will add all QC metrics to your object.
2/n
`Add_Cell_QC_Metrics` now includes addition of % of hemoglobin counts as metric & chicken was added to default species.
Default species are now human, mouse, rat, drosophila, zebrafish, macaque, marmoset, & chicken.
One line will add all QC metrics to your object.
2/n
Two entirely new plotting functions have been added in v2.0.0:
- `QC_Histogram` to plot QC features (or any other meta data or feature/gene)
- `FeatureScatter_scCustom` joins the scCustomize family of customized Seurat plots
6/n
- `QC_Histogram` to plot QC features (or any other meta data or feature/gene)
- `FeatureScatter_scCustom` joins the scCustomize family of customized Seurat plots
6/n

November 15, 2023 at 8:38 PM
Two entirely new plotting functions have been added in v2.0.0:
- `QC_Histogram` to plot QC features (or any other meta data or feature/gene)
- `FeatureScatter_scCustom` joins the scCustomize family of customized Seurat plots
6/n
- `QC_Histogram` to plot QC features (or any other meta data or feature/gene)
- `FeatureScatter_scCustom` joins the scCustomize family of customized Seurat plots
6/n
Some new nice new plotting parameters:
- Adding boxplots to any violin plot function with `plot_boxplot`
- Just add median with `plot_median`
- Removing plot axes in any DimPlot-based function with `figure_plot`
5/n
- Adding boxplots to any violin plot function with `plot_boxplot`
- Just add median with `plot_median`
- Removing plot axes in any DimPlot-based function with `figure_plot`
5/n


November 15, 2023 at 8:37 PM
Some new nice new plotting parameters:
- Adding boxplots to any violin plot function with `plot_boxplot`
- Just add median with `plot_median`
- Removing plot axes in any DimPlot-based function with `figure_plot`
5/n
- Adding boxplots to any violin plot function with `plot_boxplot`
- Just add median with `plot_median`
- Removing plot axes in any DimPlot-based function with `figure_plot`
5/n
Ok, now for the good stuff! V2.0.0 adds a number of new QC metrics (see reorganized vignette here for details: samuel-marsh.github.io/scCustomize/...
v2.0.0 also introduces a one-liner to add all qc metrics in one fell swoop:
4/n
v2.0.0 also introduces a one-liner to add all qc metrics in one fell swoop:
4/n

November 15, 2023 at 8:36 PM
Ok, now for the good stuff! V2.0.0 adds a number of new QC metrics (see reorganized vignette here for details: samuel-marsh.github.io/scCustomize/...
v2.0.0 also introduces a one-liner to add all qc metrics in one fell swoop:
4/n
v2.0.0 also introduces a one-liner to add all qc metrics in one fell swoop:
4/n