


Rich Lucas
@richlucas.bsky.social
Personality & subjective well-being; Interested in open science & research practices. Editor at JPSP:PPID. Web: richlucas.org Blog: http://deskreject.com @richlucas@mastodon.social
Also: state variance is not just measurement error, so using latent variables with the CLPM or RI-CLPM won't always fix this (though it helps). Even with multiple-item Big Five scores modeled using latent traits, the same pattern emerged. [14/x]

September 19, 2025 at 1:22 PM
Also: state variance is not just measurement error, so using latent variables with the CLPM or RI-CLPM won't always fix this (though it helps). Even with multiple-item Big Five scores modeled using latent traits, the same pattern emerged. [14/x]
What type of model can account for these patterns? Models that include a state component (like the STARTS or even the ARTS, which drops the stable trait). You can reproduce actual patterns of stability even without assuming the existence of a stable trait (this plot is for the ARTS) [11/x]

September 19, 2025 at 1:22 PM
What type of model can account for these patterns? Models that include a state component (like the STARTS or even the ARTS, which drops the stable trait). You can reproduce actual patterns of stability even without assuming the existence of a stable trait (this plot is for the ARTS) [11/x]
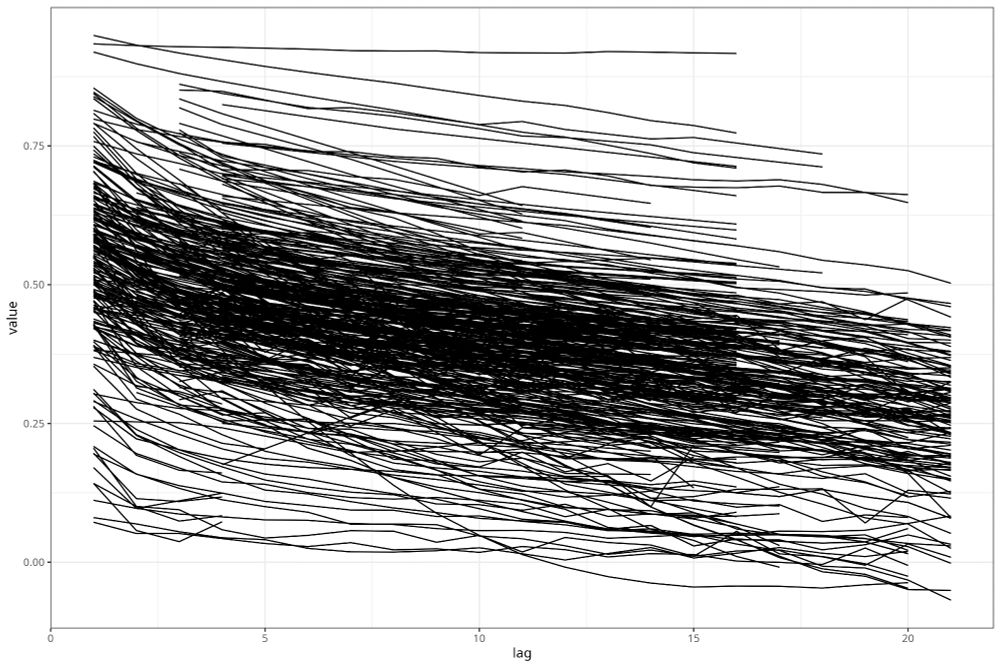
It turns out it's very common. Here are the plots of stability over increasingly long lags for about 400 variables from a large panel study. For anything less than almost perfect short-term stability, stability coefficients should reach an asymptote long before 22 years; very few do [10/x]
September 19, 2025 at 1:22 PM
It turns out it's very common. Here are the plots of stability over increasingly long lags for about 400 variables from a large panel study. For anything less than almost perfect short-term stability, stability coefficients should reach an asymptote long before 22 years; very few do [10/x]
This gets even worse with more waves of data. In our experience, this is a pretty common pattern: If you have more than 4 or 5 waves, the RI-CLPM overestimates long-term stability (and often underestimates medium-term stability). This misfit can also lead to bias in estimates [7/x]

September 19, 2025 at 1:22 PM
This gets even worse with more waves of data. In our experience, this is a pretty common pattern: If you have more than 4 or 5 waves, the RI-CLPM overestimates long-term stability (and often underestimates medium-term stability). This misfit can also lead to bias in estimates [7/x]
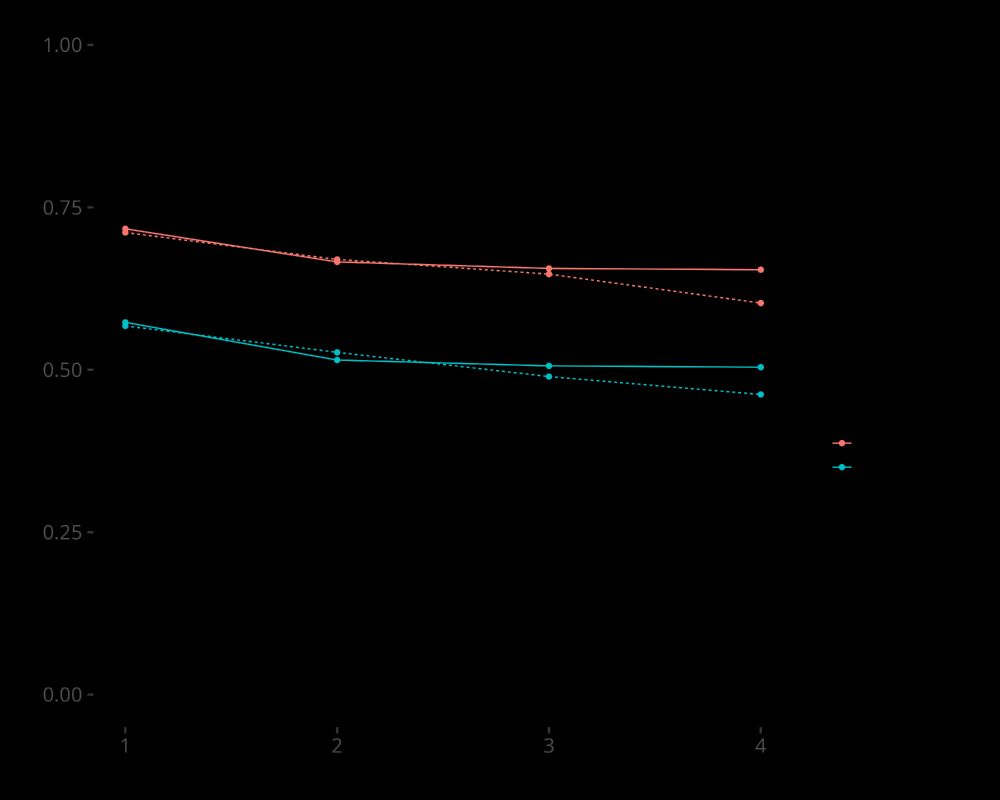
The RI-CLPM does better, but even here, there is a hint of misspecification (see how stability coefficients continue to decline even after the RI-CLPM predicts an asymptote) [6/x]
September 19, 2025 at 1:22 PM
The RI-CLPM does better, but even here, there is a hint of misspecification (see how stability coefficients continue to decline even after the RI-CLPM predicts an asymptote) [6/x]
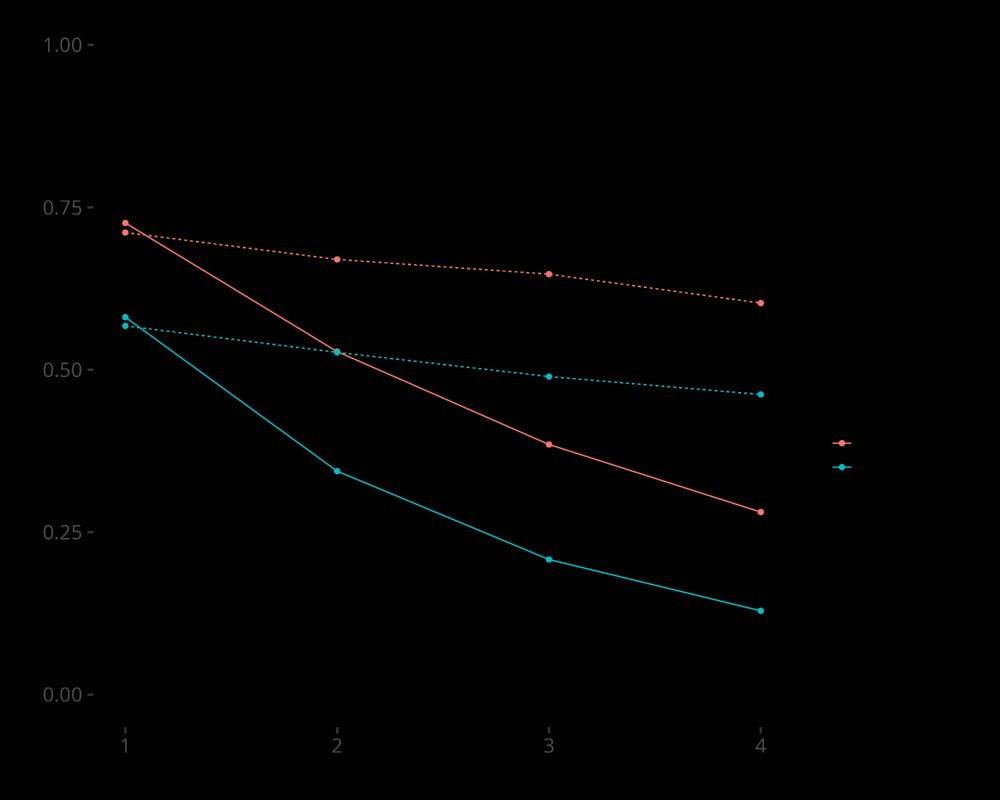
Here's a plot of actual stability coefficients and those implied by a fitted CLPM with life satisfaction and health. It's really bad...CLPM dramatically underestimates stability. This misspecification introduces bias, which can be severe [5/x]
September 19, 2025 at 1:22 PM
Here's a plot of actual stability coefficients and those implied by a fitted CLPM with life satisfaction and health. It's really bad...CLPM dramatically underestimates stability. This misspecification introduces bias, which can be severe [5/x]
For variables that social scientists study, CLPM (short dash) usually overestimates (in model-implied correlations) how quickly stability coefs decline with longer lags (as seen here; solid = actual). This leads to bias in the lagged effects. Other models (like RICLPM -- long-dash) do better /10

September 28, 2023 at 12:59 PM
For variables that social scientists study, CLPM (short dash) usually overestimates (in model-implied correlations) how quickly stability coefs decline with longer lags (as seen here; solid = actual). This leads to bias in the lagged effects. Other models (like RICLPM -- long-dash) do better /10
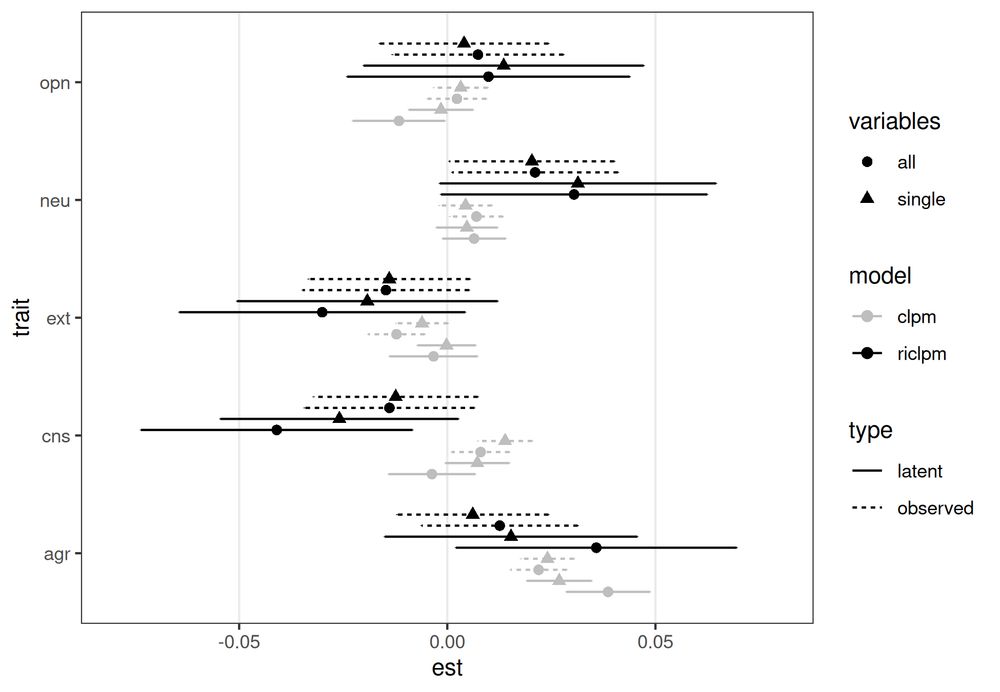
In short, we test variations on three modeling choices, and none of the effects is robust across these different models (figure shows variability in effects). That doesn't mean the original authors' choices were wrong, just that some caution is warranted when interpreting the results /3
September 28, 2023 at 12:54 PM
In short, we test variations on three modeling choices, and none of the effects is robust across these different models (figure shows variability in effects). That doesn't mean the original authors' choices were wrong, just that some caution is warranted when interpreting the results /3
Kind of fun to see how coverage of the streets of my hometown has expanded during my runs over the years. Plotted in #rstats of course


August 23, 2023 at 1:25 PM
Kind of fun to see how coverage of the streets of my hometown has expanded during my runs over the years. Plotted in #rstats of course