


Revisual Labs
@revisual.co
We’re an information design and development agency crafting memorable data stories. Rooted in India with a global outlook. 💻 https://revisual.co/ 💻
#dataviz #informationdesign
#dataviz #informationdesign
We hope you enjoy this series and stay tuned for our next post, next Monday where we pose a new question to each member on the team!
November 10, 2025 at 12:57 PM
We hope you enjoy this series and stay tuned for our next post, next Monday where we pose a new question to each member on the team!
"I always thought it would be amazing if we could get a closer look at the journeys of people in this field to help clear this out a bit, and hopefully provide some sort of a starting point that people could build upon as they begin walking on their own paths” - Ipshita

November 10, 2025 at 12:57 PM
"I always thought it would be amazing if we could get a closer look at the journeys of people in this field to help clear this out a bit, and hopefully provide some sort of a starting point that people could build upon as they begin walking on their own paths” - Ipshita
“There are so many areas one can focus on in this field — from different kinds of visualisations, to software, amongst seemingly countless other possibilities — that it can seem quite overwhelming and confusing to someone who is just starting out. " - Ipshita


November 10, 2025 at 12:57 PM
“There are so many areas one can focus on in this field — from different kinds of visualisations, to software, amongst seemingly countless other possibilities — that it can seem quite overwhelming and confusing to someone who is just starting out. " - Ipshita
The intent of this series is to open up discussions around how each team member of RVL stumbled into the field of data visualisation. We want to emphasise that the journey into a new career looks different for each person, especially in the field of data viz.


November 10, 2025 at 12:57 PM
The intent of this series is to open up discussions around how each team member of RVL stumbled into the field of data visualisation. We want to emphasise that the journey into a new career looks different for each person, especially in the field of data viz.
- We kicked off an exciting internal initiative: building our very own wiki! 🚧
We're eager to see where November takes us and the projects we'll tackle next. Thank you for following our journey, and as always, stay tuned for more! 💫
We're eager to see where November takes us and the projects we'll tackle next. Thank you for following our journey, and as always, stay tuned for more! 💫
November 5, 2025 at 10:26 AM
- We kicked off an exciting internal initiative: building our very own wiki! 🚧
We're eager to see where November takes us and the projects we'll tackle next. Thank you for following our journey, and as always, stay tuned for more! 💫
We're eager to see where November takes us and the projects we'll tackle next. Thank you for following our journey, and as always, stay tuned for more! 💫
Some highlights from last month:
- We welcomed a familiar face back to the team: @rashitries.bsky.social ! 🌸
- @chartwaali.bsky.social delivered a talk at DoBeDo Pro about her experience building a niche design practice in India.
- We welcomed a familiar face back to the team: @rashitries.bsky.social ! 🌸
- @chartwaali.bsky.social delivered a talk at DoBeDo Pro about her experience building a niche design practice in India.
November 5, 2025 at 10:26 AM
Some highlights from last month:
- We welcomed a familiar face back to the team: @rashitries.bsky.social ! 🌸
- @chartwaali.bsky.social delivered a talk at DoBeDo Pro about her experience building a niche design practice in India.
- We welcomed a familiar face back to the team: @rashitries.bsky.social ! 🌸
- @chartwaali.bsky.social delivered a talk at DoBeDo Pro about her experience building a niche design practice in India.
4. Cleaner, simplified layout
5. Adding an insight to the chart title
🔗 Read the SIDE 2024 Report here: icrier.org/pdf/State_of...
🔗 Visit our website: revisual.co/work
#dataviz #charts
5. Adding an insight to the chart title
🔗 Read the SIDE 2024 Report here: icrier.org/pdf/State_of...
🔗 Visit our website: revisual.co/work
#dataviz #charts
icrier.org
October 24, 2025 at 7:24 AM
4. Cleaner, simplified layout
5. Adding an insight to the chart title
🔗 Read the SIDE 2024 Report here: icrier.org/pdf/State_of...
🔗 Visit our website: revisual.co/work
#dataviz #charts
5. Adding an insight to the chart title
🔗 Read the SIDE 2024 Report here: icrier.org/pdf/State_of...
🔗 Visit our website: revisual.co/work
#dataviz #charts
1. Swapping the X & Y axes, allowing the labels (Affordability, Access, etc.) to be read clearly
2. Adding a stacked bar above the waterfall chart that acts as a legend & shows the contribution of each of the pillars to the total.
3. Annotating the number in the waterfall chart
2. Adding a stacked bar above the waterfall chart that acts as a legend & shows the contribution of each of the pillars to the total.
3. Annotating the number in the waterfall chart
October 24, 2025 at 7:24 AM
1. Swapping the X & Y axes, allowing the labels (Affordability, Access, etc.) to be read clearly
2. Adding a stacked bar above the waterfall chart that acts as a legend & shows the contribution of each of the pillars to the total.
3. Annotating the number in the waterfall chart
2. Adding a stacked bar above the waterfall chart that acts as a legend & shows the contribution of each of the pillars to the total.
3. Annotating the number in the waterfall chart
We identified a few improvements we could make to the original chart shared by the client, based on which we created and styled the final. Our improvements included:
October 24, 2025 at 7:24 AM
We identified a few improvements we could make to the original chart shared by the client, based on which we created and styled the final. Our improvements included:
The visual showcases how the 5 different digital pillars in the CHIPS framework contribute to India’s overall ranking. CHIPS here, refers to Connect, Harness, Innovate, Protect and Sustain.
October 24, 2025 at 7:24 AM
The visual showcases how the 5 different digital pillars in the CHIPS framework contribute to India’s overall ranking. CHIPS here, refers to Connect, Harness, Innovate, Protect and Sustain.
🔗 Link to the project: www.youtube.com/watch?v=AJdZ...
🔗 Our website: revisual.co
#dataviz #video #motion
🔗 Our website: revisual.co
#dataviz #video #motion
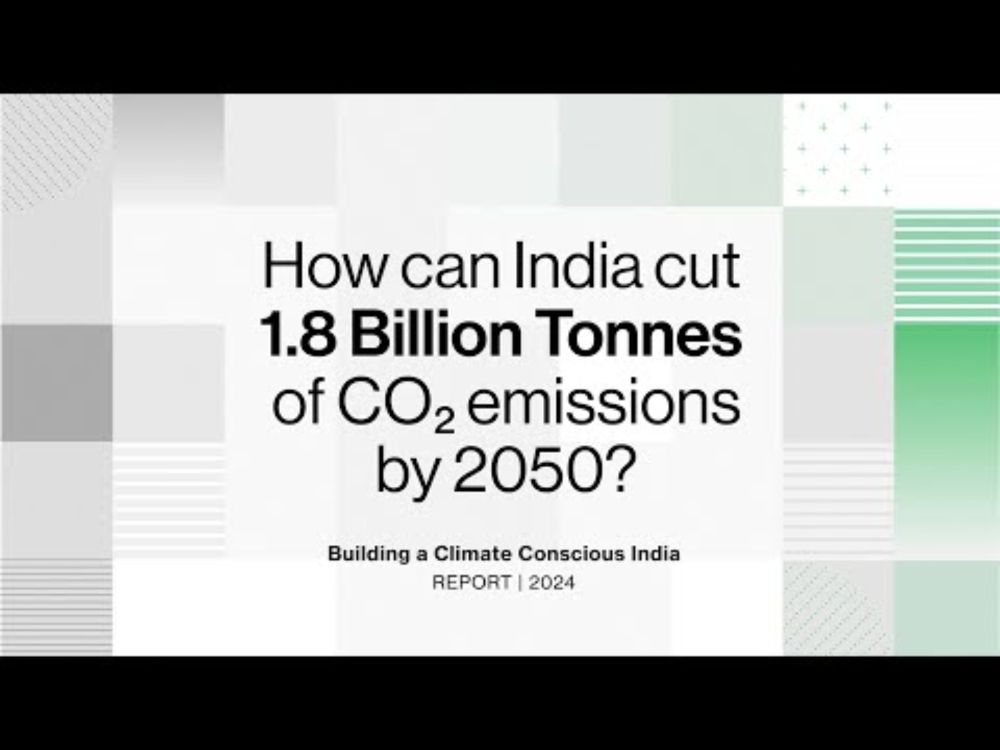
Building A Climate Conscious India
YouTube video by Godrej Design Lab
www.youtube.com
October 22, 2025 at 1:37 PM
🔗 Link to the project: www.youtube.com/watch?v=AJdZ...
🔗 Our website: revisual.co
#dataviz #video #motion
🔗 Our website: revisual.co
#dataviz #video #motion
Team:
Project manager: @chartwaali.bsky.social
Design lead: Tulika Patel
Motion graphics editor: Rameshwar Jaiswal
Project manager: @chartwaali.bsky.social
Design lead: Tulika Patel
Motion graphics editor: Rameshwar Jaiswal
October 22, 2025 at 1:37 PM
Team:
Project manager: @chartwaali.bsky.social
Design lead: Tulika Patel
Motion graphics editor: Rameshwar Jaiswal
Project manager: @chartwaali.bsky.social
Design lead: Tulika Patel
Motion graphics editor: Rameshwar Jaiswal
Today, we’re taking you through our thought process and approach for the long-form video explainer so swipe through to read about how we transformed a static web report into an engaging motion piece!


October 22, 2025 at 1:37 PM
Today, we’re taking you through our thought process and approach for the long-form video explainer so swipe through to read about how we transformed a static web report into an engaging motion piece!
This set consisted of a series of shorter videos breaking down key concepts from the report and a long-form video summary.
October 22, 2025 at 1:37 PM
This set consisted of a series of shorter videos breaking down key concepts from the report and a long-form video summary.
Visit the links below to view the project!
🔗 Link to the project: 3ieimpact.org/impact/impac...
🔗 Our website: revisual.co
#dashboard #dataviz #impactstories
🔗 Link to the project: 3ieimpact.org/impact/impac...
🔗 Our website: revisual.co
#dashboard #dataviz #impactstories

October 16, 2025 at 8:23 AM
Visit the links below to view the project!
🔗 Link to the project: 3ieimpact.org/impact/impac...
🔗 Our website: revisual.co
#dashboard #dataviz #impactstories
🔗 Link to the project: 3ieimpact.org/impact/impac...
🔗 Our website: revisual.co
#dashboard #dataviz #impactstories
In this dashboard, users can filter through impact stories by sector, project type or location. Swipe to read about the unique phases and milestones of the 3ie Impact Stories Dashboard.


October 16, 2025 at 8:23 AM
In this dashboard, users can filter through impact stories by sector, project type or location. Swipe to read about the unique phases and milestones of the 3ie Impact Stories Dashboard.
🔗 Take a closer look at the map here: dtm.iom.int/data-stories...
🔗 Visit our website revisual.co/work
#dataviz #maps
🔗 Visit our website revisual.co/work
#dataviz #maps
October 10, 2025 at 1:13 PM
🔗 Take a closer look at the map here: dtm.iom.int/data-stories...
🔗 Visit our website revisual.co/work
#dataviz #maps
🔗 Visit our website revisual.co/work
#dataviz #maps
From the initial concept sketch inspired by train transit maps, to finding the right tools, trials and errors, followed by a bit of jugaad, view the final product and read about how our developer Aman, met his match.


October 10, 2025 at 1:13 PM
From the initial concept sketch inspired by train transit maps, to finding the right tools, trials and errors, followed by a bit of jugaad, view the final product and read about how our developer Aman, met his match.