


Neil Richards
@questionsindataviz.com
Dataviz blogger, author and Hall of Fame Tableau Visionary. Was @theneilrichards on here and the horrible other place.
Data Fluency @JLL
questionsindataviz.com
https://routledge.pub/Questions-in-Dataviz
Data Fluency @JLL
questionsindataviz.com
https://routledge.pub/Questions-in-Dataviz
What were the chances of that? - I met the guy who sold me the @datavandals.bsky.social T-shirt right here in Vienna!
Great to catch up with @jasonforrest.bsky.social as part of @csh.ac.at’s Visualising Complexity workshop - so many great people are here collaborating on fun visualisation projects
Great to catch up with @jasonforrest.bsky.social as part of @csh.ac.at’s Visualising Complexity workshop - so many great people are here collaborating on fun visualisation projects

August 27, 2025 at 9:12 AM
What were the chances of that? - I met the guy who sold me the @datavandals.bsky.social T-shirt right here in Vienna!
Great to catch up with @jasonforrest.bsky.social as part of @csh.ac.at’s Visualising Complexity workshop - so many great people are here collaborating on fun visualisation projects
Great to catch up with @jasonforrest.bsky.social as part of @csh.ac.at’s Visualising Complexity workshop - so many great people are here collaborating on fun visualisation projects
Brace yourself - here’s dataviz @ryanairofficial.bsky.social style!

August 25, 2025 at 4:23 PM
Brace yourself - here’s dataviz @ryanairofficial.bsky.social style!
Looking forward to a week of fun complex dataviz in Vienna! 🇦🇹

August 25, 2025 at 11:04 AM
Looking forward to a week of fun complex dataviz in Vienna! 🇦🇹
NEW: Questions in Dataviz: What is a Hitomezashi Snowflake?
questionsindataviz.com/2025/07/25/w...
Inspired by @mathskath.bsky.social - looking at encoding data as hitomezashi stitching (steganocoding) and creating digital equivalents, before diving into the mathematics of snowflakes.
questionsindataviz.com/2025/07/25/w...
Inspired by @mathskath.bsky.social - looking at encoding data as hitomezashi stitching (steganocoding) and creating digital equivalents, before diving into the mathematics of snowflakes.
July 25, 2025 at 9:32 PM
NEW: Questions in Dataviz: What is a Hitomezashi Snowflake?
questionsindataviz.com/2025/07/25/w...
Inspired by @mathskath.bsky.social - looking at encoding data as hitomezashi stitching (steganocoding) and creating digital equivalents, before diving into the mathematics of snowflakes.
questionsindataviz.com/2025/07/25/w...
Inspired by @mathskath.bsky.social - looking at encoding data as hitomezashi stitching (steganocoding) and creating digital equivalents, before diving into the mathematics of snowflakes.
I started trying to generate hitomezashi using data (e.g. converting names to binary to generate patterns) but my friend Annabelle Rincon has already done this brilliantly: public.tableau.com/app/profile/...
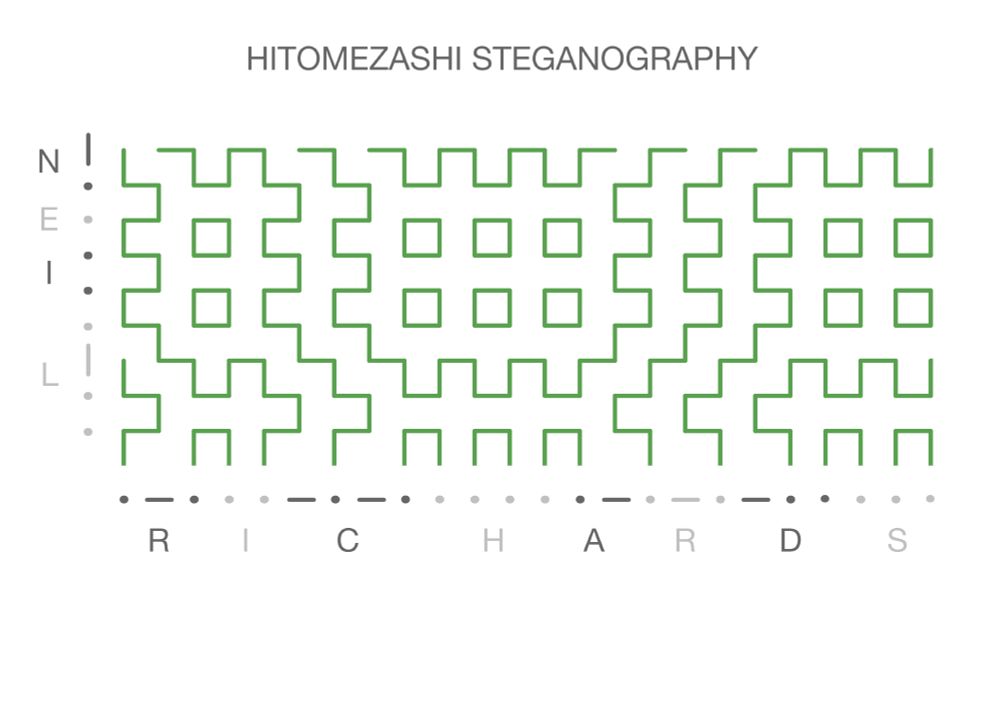
It didn't stop me trying the process myself by converting my name into Morse Code though!
It didn't stop me trying the process myself by converting my name into Morse Code though!
July 25, 2025 at 4:11 PM
I started trying to generate hitomezashi using data (e.g. converting names to binary to generate patterns) but my friend Annabelle Rincon has already done this brilliantly: public.tableau.com/app/profile/...
It didn't stop me trying the process myself by converting my name into Morse Code though!
It didn't stop me trying the process myself by converting my name into Morse Code though!
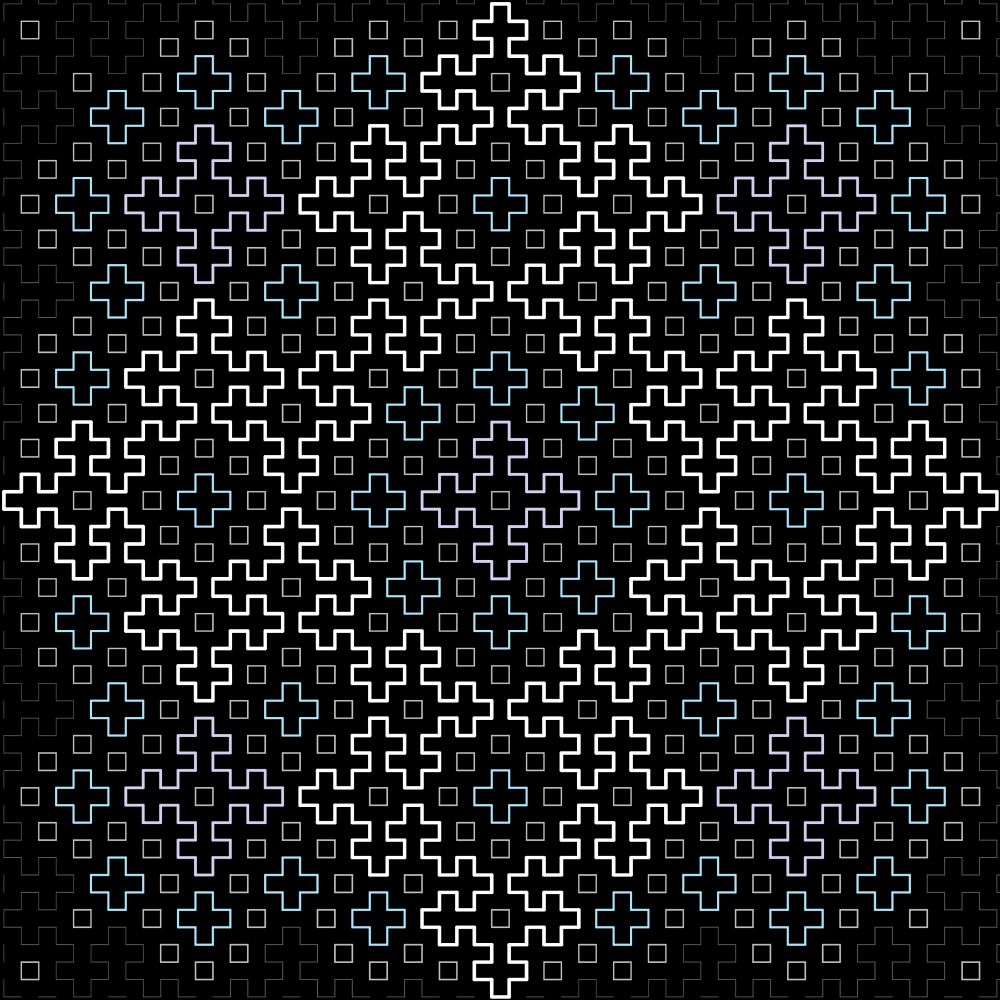
My latest visualisation - Hitomezashi Snowflakes. Inspired by @mathskath.bsky.social and her book A Stitch in Line, here's my digital recreation of an order five Fibonacci snowflake (highlighted in white, with smaller order snowflakes in different colours).
Blog post and explanation to follow! 📊
Blog post and explanation to follow! 📊
July 24, 2025 at 6:04 PM
My latest visualisation - Hitomezashi Snowflakes. Inspired by @mathskath.bsky.social and her book A Stitch in Line, here's my digital recreation of an order five Fibonacci snowflake (highlighted in white, with smaller order snowflakes in different colours).
Blog post and explanation to follow! 📊
Blog post and explanation to follow! 📊
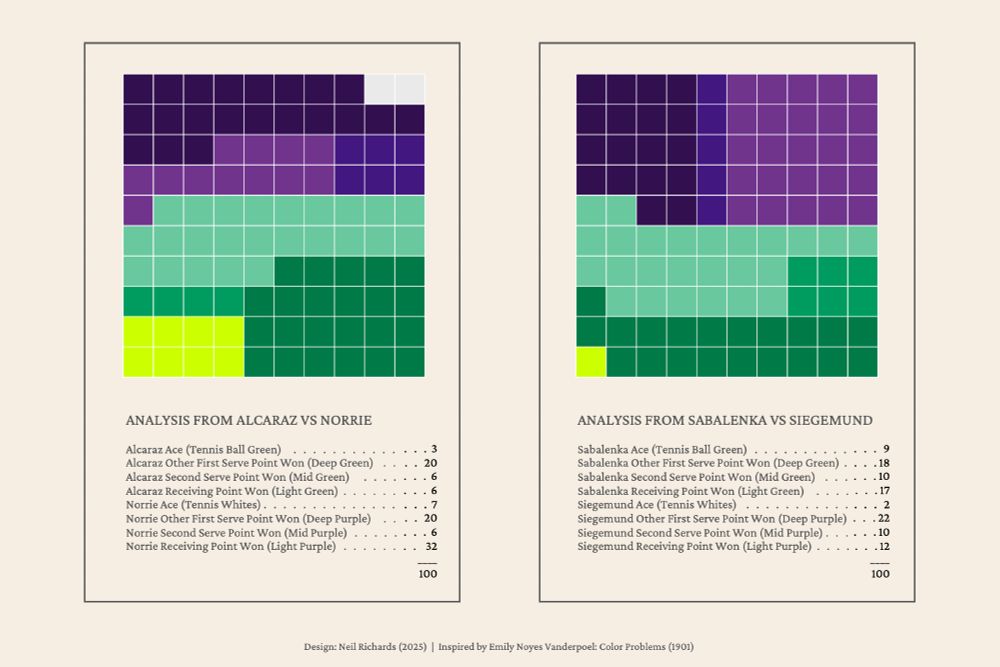
Updated my Emily Vanderpoel inspired Wimbledon viz with yesterday's Singles Finals games..
Even an unorthodox design-inspired viz can show how cruel tennis scoring can be. Anisimova may not have registered a single game but did win just over 30% of the total points in Swiatek's 6-0 6-0 win. 📊
Even an unorthodox design-inspired viz can show how cruel tennis scoring can be. Anisimova may not have registered a single game but did win just over 30% of the total points in Swiatek's 6-0 6-0 win. 📊

July 14, 2025 at 11:00 AM
Updated my Emily Vanderpoel inspired Wimbledon viz with yesterday's Singles Finals games..
Even an unorthodox design-inspired viz can show how cruel tennis scoring can be. Anisimova may not have registered a single game but did win just over 30% of the total points in Swiatek's 6-0 6-0 win. 📊
Even an unorthodox design-inspired viz can show how cruel tennis scoring can be. Anisimova may not have registered a single game but did win just over 30% of the total points in Swiatek's 6-0 6-0 win. 📊
These are amazing - I need to learn to crochet! (though entry level Hitomezashi might be more attainable for me). What is the maths behind them?
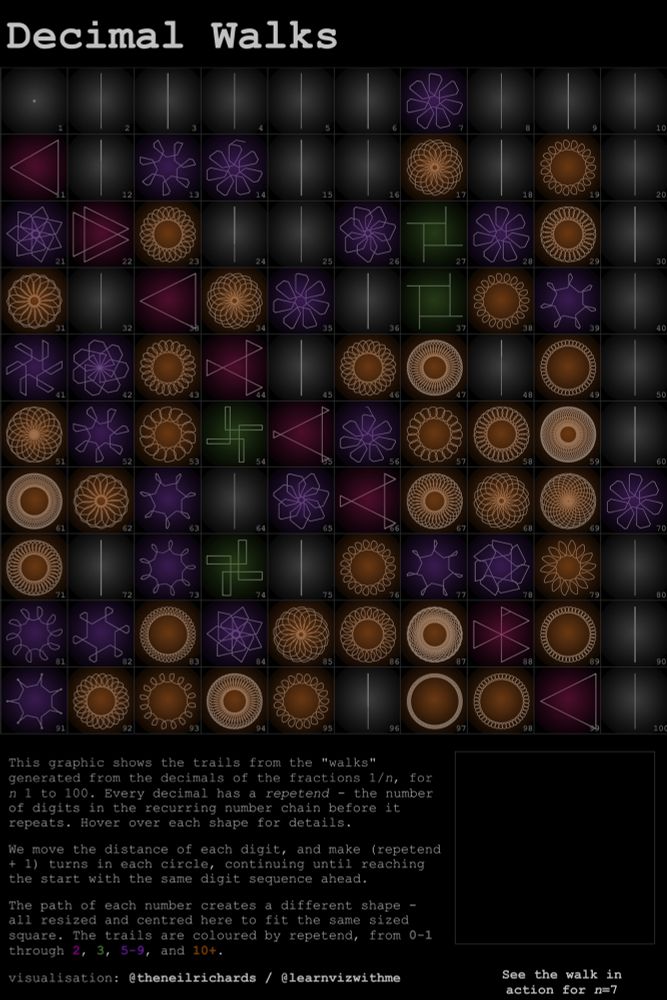
Reminds me (a little) of my Decimal Walks project
Reminds me (a little) of my Decimal Walks project
July 10, 2025 at 6:05 PM
These are amazing - I need to learn to crochet! (though entry level Hitomezashi might be more attainable for me). What is the maths behind them?
Reminds me (a little) of my Decimal Walks project
Reminds me (a little) of my Decimal Walks project
If you see this, quote post with a robot that isn’t from Star Wars, Star Trek, Dr Who and Transformers

July 10, 2025 at 6:42 AM
If you see this, quote post with a robot that isn’t from Star Wars, Star Trek, Dr Who and Transformers
NEW: How do we take inspiration from colour palettes?
questionsindataviz.com/2025/07/08/h...
My latest blog post features my newest visualisation, looking at two Wimbledon matches in the style of 1901 artist, author and colour theory expert Emily Noyes Vanderpoel.
questionsindataviz.com/2025/07/08/h...
My latest blog post features my newest visualisation, looking at two Wimbledon matches in the style of 1901 artist, author and colour theory expert Emily Noyes Vanderpoel.
July 8, 2025 at 10:48 PM
NEW: How do we take inspiration from colour palettes?
questionsindataviz.com/2025/07/08/h...
My latest blog post features my newest visualisation, looking at two Wimbledon matches in the style of 1901 artist, author and colour theory expert Emily Noyes Vanderpoel.
questionsindataviz.com/2025/07/08/h...
My latest blog post features my newest visualisation, looking at two Wimbledon matches in the style of 1901 artist, author and colour theory expert Emily Noyes Vanderpoel.
Ok, BBC Sport, a full filled in bar represents 57%? Got it - that’s nice and clear 🤯

July 2, 2025 at 6:12 PM
Ok, BBC Sport, a full filled in bar represents 57%? Got it - that’s nice and clear 🤯
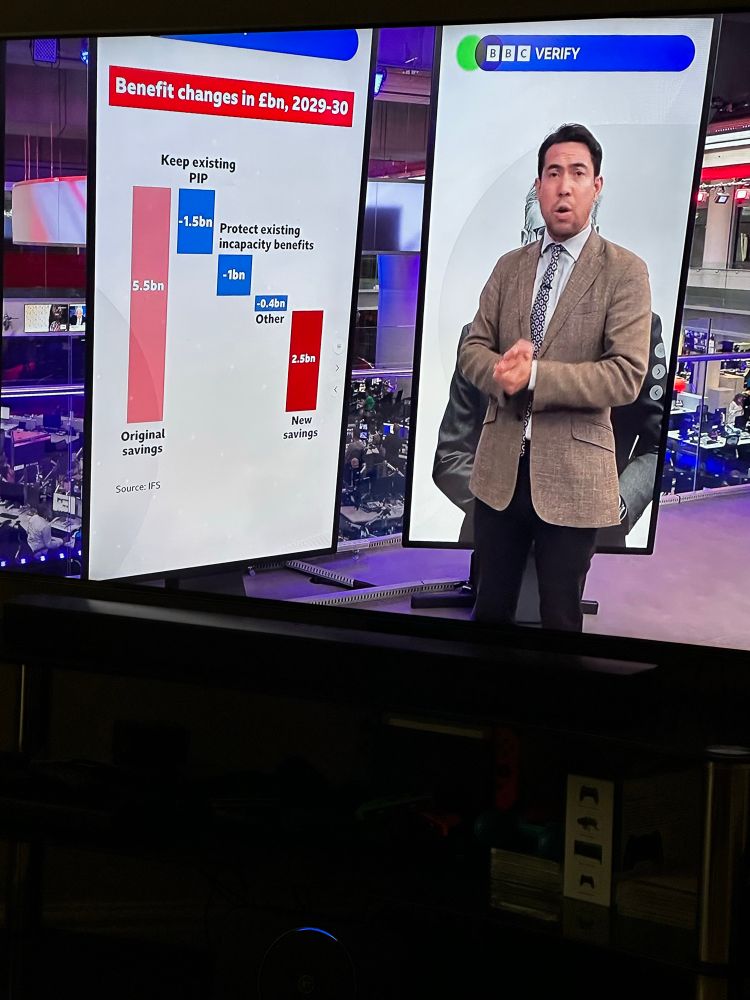
Just seen my first waterfall chart in real life - on @bbcnewsuk.bsky.social 📊
June 30, 2025 at 9:08 PM
Just seen my first waterfall chart in real life - on @bbcnewsuk.bsky.social 📊
My latest book arrival - modern reprint of 1901 original by Emily Noyes Vanderpoel. 116 colour plates, mostly 10x10 analysis grids of colour compositions from historical and cultural objects.
10x10 grids, minimalist pictures, coloured blocks, how have I just found this now?!
#datavizinspiration
10x10 grids, minimalist pictures, coloured blocks, how have I just found this now?!
#datavizinspiration

June 29, 2025 at 4:13 PM
My latest book arrival - modern reprint of 1901 original by Emily Noyes Vanderpoel. 116 colour plates, mostly 10x10 analysis grids of colour compositions from historical and cultural objects.
10x10 grids, minimalist pictures, coloured blocks, how have I just found this now?!
#datavizinspiration
10x10 grids, minimalist pictures, coloured blocks, how have I just found this now?!
#datavizinspiration
It’s #IIBAwards here at the Coral Gables Museum in Miami. Honoured to be here with @datarevelations.com and @datavizsociety.bsky.social Executive Director Christopher Laubenthal

June 12, 2025 at 11:18 PM
It’s #IIBAwards here at the Coral Gables Museum in Miami. Honoured to be here with @datarevelations.com and @datavizsociety.bsky.social Executive Director Christopher Laubenthal
Next up at #outlier2025 is @mikevizneros.bsky.social and Alex Velez from @storytellingwith.bsky.social - explaining how “nothing” matters - when data is missing we lack trust in the data.

June 12, 2025 at 7:13 PM
Next up at #outlier2025 is @mikevizneros.bsky.social and Alex Velez from @storytellingwith.bsky.social - explaining how “nothing” matters - when data is missing we lack trust in the data.
The results of Sophie Sparkes’ workshop at #outlier2025 - so much fun!

June 12, 2025 at 6:45 PM
The results of Sophie Sparkes’ workshop at #outlier2025 - so much fun!
Time for a pens, paper, data workshop with the brilliant Sophie Sparkes at #outlier2025

June 12, 2025 at 5:44 PM
Time for a pens, paper, data workshop with the brilliant Sophie Sparkes at #outlier2025
I’m such a big fan of Liuhuaying Yang and her work at @csh.ac.at - her remote talk at #outlier2025 “this is not interesting … but it could be” shows how dry subjects can become engaging visualisations (and in this case, sonifications!). Can’t wait to visit Vienna for a workshop in August!

June 12, 2025 at 2:01 PM
I’m such a big fan of Liuhuaying Yang and her work at @csh.ac.at - her remote talk at #outlier2025 “this is not interesting … but it could be” shows how dry subjects can become engaging visualisations (and in this case, sonifications!). Can’t wait to visit Vienna for a workshop in August!
First up at #outlier2025 is @frank.computer - bringing his unparalleled accessibility knowledge to a new campaign: should software be “softer”?

June 12, 2025 at 1:22 PM
First up at #outlier2025 is @frank.computer - bringing his unparalleled accessibility knowledge to a new campaign: should software be “softer”?
Next up at #outlier2025, Zan Armstrong introduces diagnostic charts - the middle ground of really useful charts beyond simple “explore” or “explain” charts - some fascinating science-inspired examples!

June 11, 2025 at 7:24 PM
Next up at #outlier2025, Zan Armstrong introduces diagnostic charts - the middle ground of really useful charts beyond simple “explore” or “explain” charts - some fascinating science-inspired examples!
No offence to everyone else here at #outlier2025 but a talk by @datarevelations.com is basically the highlight of any conference - worth the entry fee alone!
Here he tells us the importance of Seeing Data through your Audience’s Eyes
Here he tells us the importance of Seeing Data through your Audience’s Eyes
June 11, 2025 at 6:15 PM
No offence to everyone else here at #outlier2025 but a talk by @datarevelations.com is basically the highlight of any conference - worth the entry fee alone!
Here he tells us the importance of Seeing Data through your Audience’s Eyes
Here he tells us the importance of Seeing Data through your Audience’s Eyes
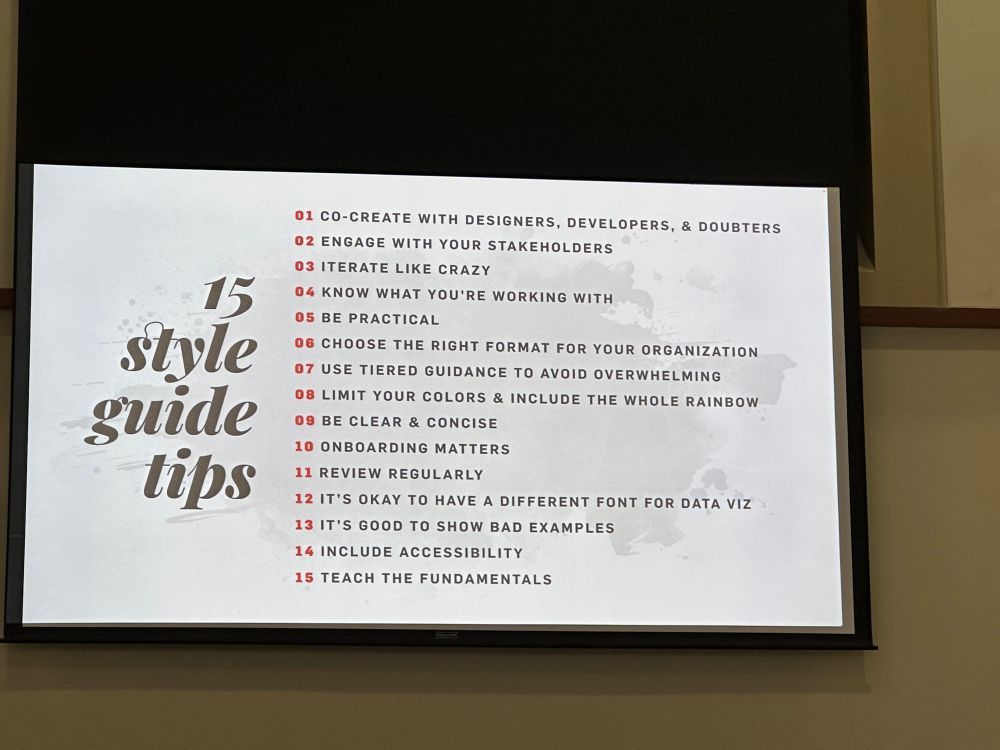
Thankfully @amycesal.com, Max Graze, Alan Wilson and @policyviz.bsky.social managed to get their fifteen style guide tips into one summary slide at #outlier2025 so I didn’t have to pick one!
June 11, 2025 at 6:01 PM
Thankfully @amycesal.com, Max Graze, Alan Wilson and @policyviz.bsky.social managed to get their fifteen style guide tips into one summary slide at #outlier2025 so I didn’t have to pick one!
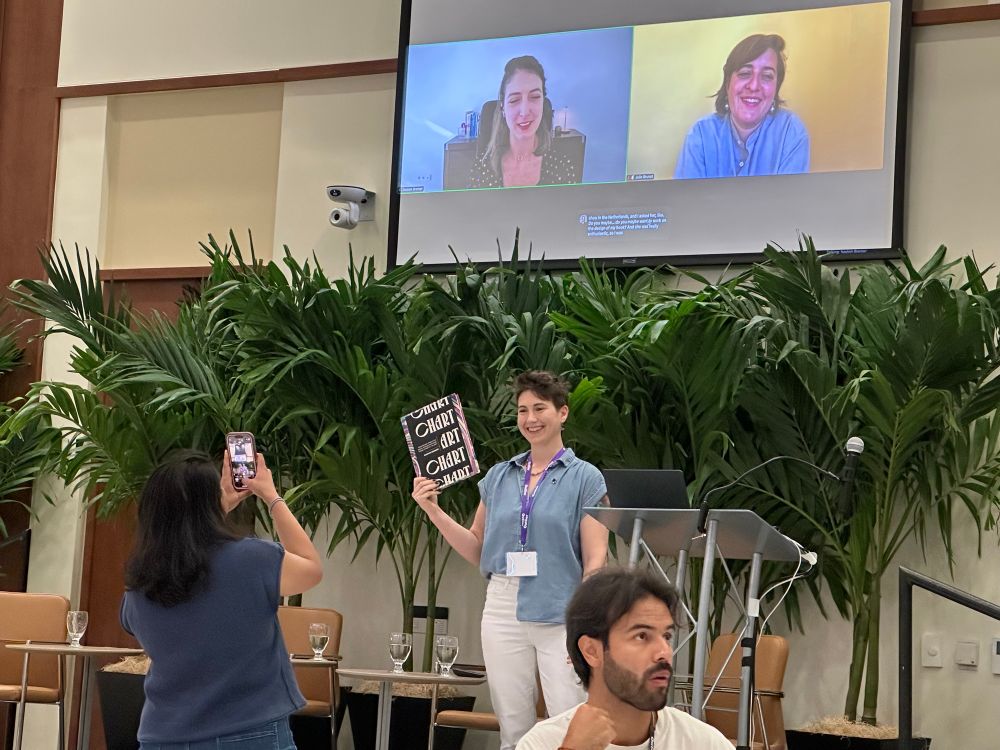
It’s the chART virtual book launch at #outlier2025 - here’s @nadiehbremer.com and @juliebrunet.bsky.social appearing remotely, with @zanewolf.bsky.social proudly displaying the real book! Can’t wait to get hold of my copy (frustratingly 3000 miles away from me at home right now!)
June 11, 2025 at 4:58 PM
It’s the chART virtual book launch at #outlier2025 - here’s @nadiehbremer.com and @juliebrunet.bsky.social appearing remotely, with @zanewolf.bsky.social proudly displaying the real book! Can’t wait to get hold of my copy (frustratingly 3000 miles away from me at home right now!)
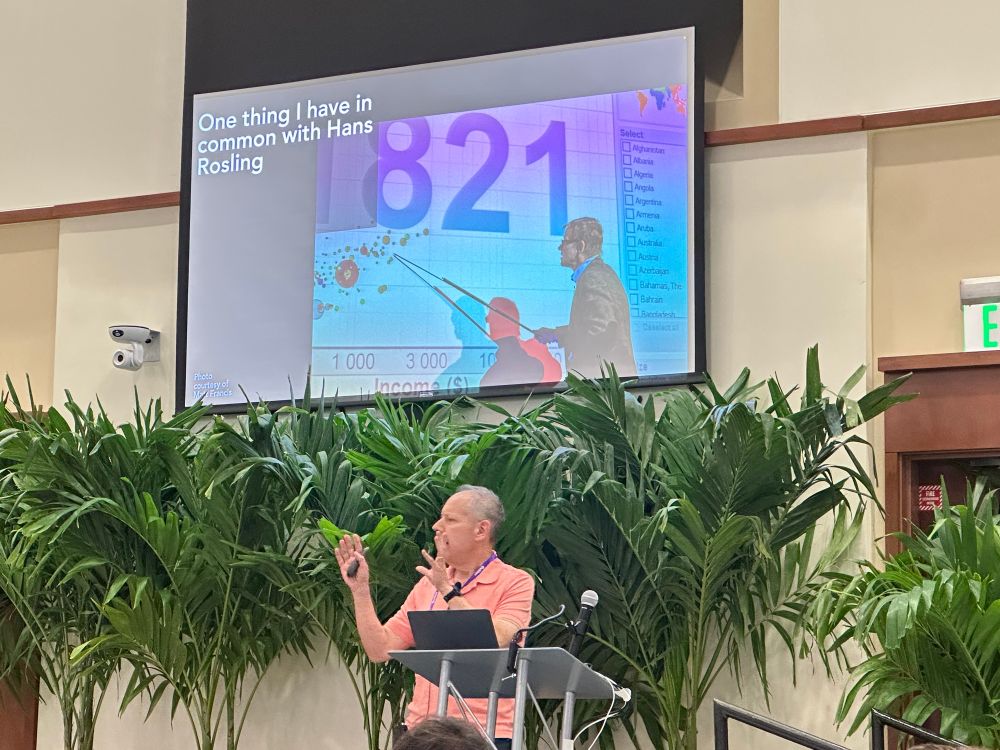
From Jose Duarte’s talk at #outlier2025 about data literacy and access in Latin America - show your answer on an interactive pie chart, what a great interactive talking point for data presentations!

June 11, 2025 at 3:54 PM
From Jose Duarte’s talk at #outlier2025 about data literacy and access in Latin America - show your answer on an interactive pie chart, what a great interactive talking point for data presentations!
From Dr. Lagipoiva Cherelle Jackson at #outlier2025 - this eye-catching indigenous Polynesian data visualisation is not the conventional data visualisation I am more familiar with!

June 11, 2025 at 3:43 PM
From Dr. Lagipoiva Cherelle Jackson at #outlier2025 - this eye-catching indigenous Polynesian data visualisation is not the conventional data visualisation I am more familiar with!