


Tony Cookson
@profcookson.bsky.social
Professor of Finance at CU Boulder. Likes academic research and interesting other insights. Husband, father of two.
I could never give it up.
youtu.be/dQw4w9WgXcQ?...
youtu.be/dQw4w9WgXcQ?...

Rick Astley - Never Gonna Give You Up (Official Music Video)
YouTube video by Rick Astley
youtu.be
January 1, 2025 at 1:13 AM
I could never give it up.
youtu.be/dQw4w9WgXcQ?...
youtu.be/dQw4w9WgXcQ?...

There is more in the paper.
Link (again): papers.ssrn.com/sol3/papers....
Again, this is our first release of the paper, so we're eager to improve it. If you have thoughts or comments, we're eager to learn from you.
Link (again): papers.ssrn.com/sol3/papers....
Again, this is our first release of the paper, so we're eager to improve it. If you have thoughts or comments, we're eager to learn from you.
Coverage Neglect in Homeowners Insurance
Most homeowners do not have enough insurance coverage to rebuild their house after a total loss. Using contract-level data from 24 homeowners insurance companie
papers.ssrn.com
December 16, 2024 at 8:42 PM
There is more in the paper.
Link (again): papers.ssrn.com/sol3/papers....
Again, this is our first release of the paper, so we're eager to improve it. If you have thoughts or comments, we're eager to learn from you.
Link (again): papers.ssrn.com/sol3/papers....
Again, this is our first release of the paper, so we're eager to improve it. If you have thoughts or comments, we're eager to learn from you.
The discrete choice model allows us to perform a counterfactual without coverage neglect -- i.e., what if consumers efficiently shopped by $/coverage?
We estimate this would improve welfare by $290, on average, per year (or about 10% of annual premiums).
We estimate this would improve welfare by $290, on average, per year (or about 10% of annual premiums).

December 16, 2024 at 8:42 PM
The discrete choice model allows us to perform a counterfactual without coverage neglect -- i.e., what if consumers efficiently shopped by $/coverage?
We estimate this would improve welfare by $290, on average, per year (or about 10% of annual premiums).
We estimate this would improve welfare by $290, on average, per year (or about 10% of annual premiums).
Why do consumers neglect coverage?
1) it is tough to know what total loss limit is "full" coverage (rebuild cost isn't home price).
2) even with dueling insurance quotes, it is tough to compare policies w different total loss limits.
We think information provision could help.
1) it is tough to know what total loss limit is "full" coverage (rebuild cost isn't home price).
2) even with dueling insurance quotes, it is tough to compare policies w different total loss limits.
We think information provision could help.

December 16, 2024 at 8:42 PM
Why do consumers neglect coverage?
1) it is tough to know what total loss limit is "full" coverage (rebuild cost isn't home price).
2) even with dueling insurance quotes, it is tough to compare policies w different total loss limits.
We think information provision could help.
1) it is tough to know what total loss limit is "full" coverage (rebuild cost isn't home price).
2) even with dueling insurance quotes, it is tough to compare policies w different total loss limits.
We think information provision could help.
And, that's what we find (see column 3):
* Consumers respond significantly to lower headline premiums in their insurance choice.
* They are less responsive (and in the opposite direction) to the $/coverage price schedule.
* Consumers respond significantly to lower headline premiums in their insurance choice.
* They are less responsive (and in the opposite direction) to the $/coverage price schedule.

December 16, 2024 at 8:42 PM
And, that's what we find (see column 3):
* Consumers respond significantly to lower headline premiums in their insurance choice.
* They are less responsive (and in the opposite direction) to the $/coverage price schedule.
* Consumers respond significantly to lower headline premiums in their insurance choice.
* They are less responsive (and in the opposite direction) to the $/coverage price schedule.
In the last part of the paper, we test for and quantify the coverage neglect mechanism using a discrete choice model.
The idea is that a rational consumer would compare cost per coverage, but a coverage neglected one would only respond to headline premium.
The idea is that a rational consumer would compare cost per coverage, but a coverage neglected one would only respond to headline premium.

December 16, 2024 at 8:42 PM
In the last part of the paper, we test for and quantify the coverage neglect mechanism using a discrete choice model.
The idea is that a rational consumer would compare cost per coverage, but a coverage neglected one would only respond to headline premium.
The idea is that a rational consumer would compare cost per coverage, but a coverage neglected one would only respond to headline premium.
Does underinsurance matter?
Yes! For about 1000 total losses, we find that being more underinsured makes it less likely the household rebuilds and more likely they sell.
Here, we're instrumenting for coverage choice using insurer average coverage ratio (leave one out).
Yes! For about 1000 total losses, we find that being more underinsured makes it less likely the household rebuilds and more likely they sell.
Here, we're instrumenting for coverage choice using insurer average coverage ratio (leave one out).


December 16, 2024 at 8:42 PM
Does underinsurance matter?
Yes! For about 1000 total losses, we find that being more underinsured makes it less likely the household rebuilds and more likely they sell.
Here, we're instrumenting for coverage choice using insurer average coverage ratio (leave one out).
Yes! For about 1000 total losses, we find that being more underinsured makes it less likely the household rebuilds and more likely they sell.
Here, we're instrumenting for coverage choice using insurer average coverage ratio (leave one out).
What it is not 3: We find evidence against adverse selection on Wood Frame houses, which are *wayy* more likely to be a total loss, but are somehow not priced more expensively.
Homeowners do not buy more coverage for such houses.
Homeowners do not buy more coverage for such houses.

December 16, 2024 at 8:42 PM
What it is not 3: We find evidence against adverse selection on Wood Frame houses, which are *wayy* more likely to be a total loss, but are somehow not priced more expensively.
Homeowners do not buy more coverage for such houses.
Homeowners do not buy more coverage for such houses.
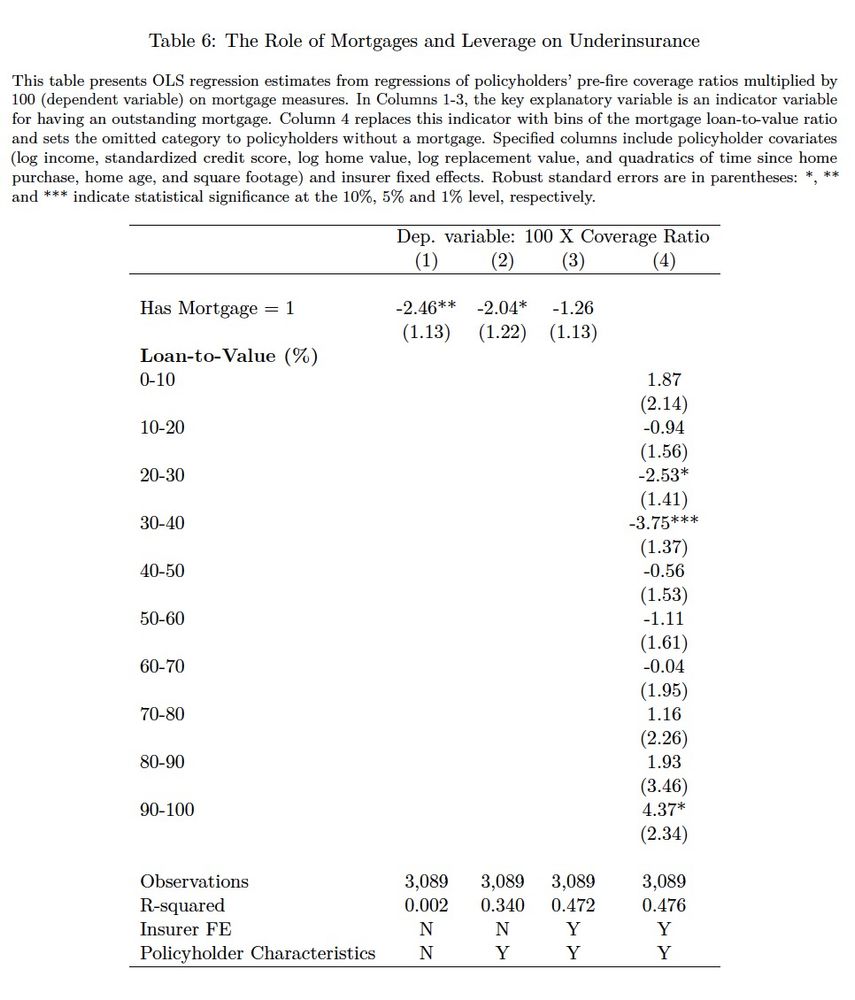
What it is not 2: Underinsurance is only weakly connected to having a mortgage or the mortgage's loan-to-value at the time of the fire.
December 16, 2024 at 8:42 PM
What it is not 2: Underinsurance is only weakly connected to having a mortgage or the mortgage's loan-to-value at the time of the fire.
What it is not 1: Underinsurance is *not* because policies get out of date. If anything, older policies are better insured.
We can see this because we observe contracts at inception and as of the date of the Marshall Fire (Dec 31, 2021).
We can see this because we observe contracts at inception and as of the date of the Marshall Fire (Dec 31, 2021).


December 16, 2024 at 8:42 PM
What it is not 1: Underinsurance is *not* because policies get out of date. If anything, older policies are better insured.
We can see this because we observe contracts at inception and as of the date of the Marshall Fire (Dec 31, 2021).
We can see this because we observe contracts at inception and as of the date of the Marshall Fire (Dec 31, 2021).
Finding 3: Underinsurance varies *a lot* across insurers operating in the same market, and policyholder characteristics do not explain this variation very much.
The flip of this? Underinsured households could have gone with an insurer who would have provided fuller insurance.
The flip of this? Underinsured households could have gone with an insurer who would have provided fuller insurance.


December 16, 2024 at 8:42 PM
Finding 3: Underinsurance varies *a lot* across insurers operating in the same market, and policyholder characteristics do not explain this variation very much.
The flip of this? Underinsured households could have gone with an insurer who would have provided fuller insurance.
The flip of this? Underinsured households could have gone with an insurer who would have provided fuller insurance.
Finding 2: Underinsurance is *pervasive* across household characteristics: income, credit score, and home value.
High income folks are better insured. There's also a negative correlation to home values, but still most groups are underinsured.
High income folks are better insured. There's also a negative correlation to home values, but still most groups are underinsured.


December 16, 2024 at 8:42 PM
Finding 2: Underinsurance is *pervasive* across household characteristics: income, credit score, and home value.
High income folks are better insured. There's also a negative correlation to home values, but still most groups are underinsured.
High income folks are better insured. There's also a negative correlation to home values, but still most groups are underinsured.
So, what do we find?
Finding 1: Underinsurance is *severe and common*... 75% of households are underinsured, and 37% are what we call *severely underinsured* -- i.e., only insured for 75% or less of their home's rebuild cost.
Finding 1: Underinsurance is *severe and common*... 75% of households are underinsured, and 37% are what we call *severely underinsured* -- i.e., only insured for 75% or less of their home's rebuild cost.

December 16, 2024 at 8:42 PM
So, what do we find?
Finding 1: Underinsurance is *severe and common*... 75% of households are underinsured, and 37% are what we call *severely underinsured* -- i.e., only insured for 75% or less of their home's rebuild cost.
Finding 1: Underinsurance is *severe and common*... 75% of households are underinsured, and 37% are what we call *severely underinsured* -- i.e., only insured for 75% or less of their home's rebuild cost.
Our detailed data give a complete picture of underinsurance and recovery in the Colorado market. This allows us to:
1) measure extent of underinsurance,
2) understand how underinsurance ~ insurers versus household characteristics,
3) evaluate impact of underinsurance on recovery
1) measure extent of underinsurance,
2) understand how underinsurance ~ insurers versus household characteristics,
3) evaluate impact of underinsurance on recovery
December 16, 2024 at 8:42 PM
Our detailed data give a complete picture of underinsurance and recovery in the Colorado market. This allows us to:
1) measure extent of underinsurance,
2) understand how underinsurance ~ insurers versus household characteristics,
3) evaluate impact of underinsurance on recovery
1) measure extent of underinsurance,
2) understand how underinsurance ~ insurers versus household characteristics,
3) evaluate impact of underinsurance on recovery
Our paper relies on detailed insurance contract data, matched to household-level information from a major credit bureau, housing characteristics, and after a major wildfire, recovery outcomes.
Because of that wildfire, we also have accurate rebuild cost estimates.
Because of that wildfire, we also have accurate rebuild cost estimates.


December 16, 2024 at 8:42 PM
Our paper relies on detailed insurance contract data, matched to household-level information from a major credit bureau, housing characteristics, and after a major wildfire, recovery outcomes.
Because of that wildfire, we also have accurate rebuild cost estimates.
Because of that wildfire, we also have accurate rebuild cost estimates.