


Alan Nathan
@pobguy.bsky.social
Professor Emeritus of Physics, U of Illinois. Physics of Baseball: baseball.physics.illinois.edu. Mostly post about baseball. Sometimes Con Law, basketball, physics, WW1, Twilight Zone, ...

No Kings, Urbana IL...just getting started

October 18, 2025 at 4:51 PM
No Kings, Urbana IL...just getting started
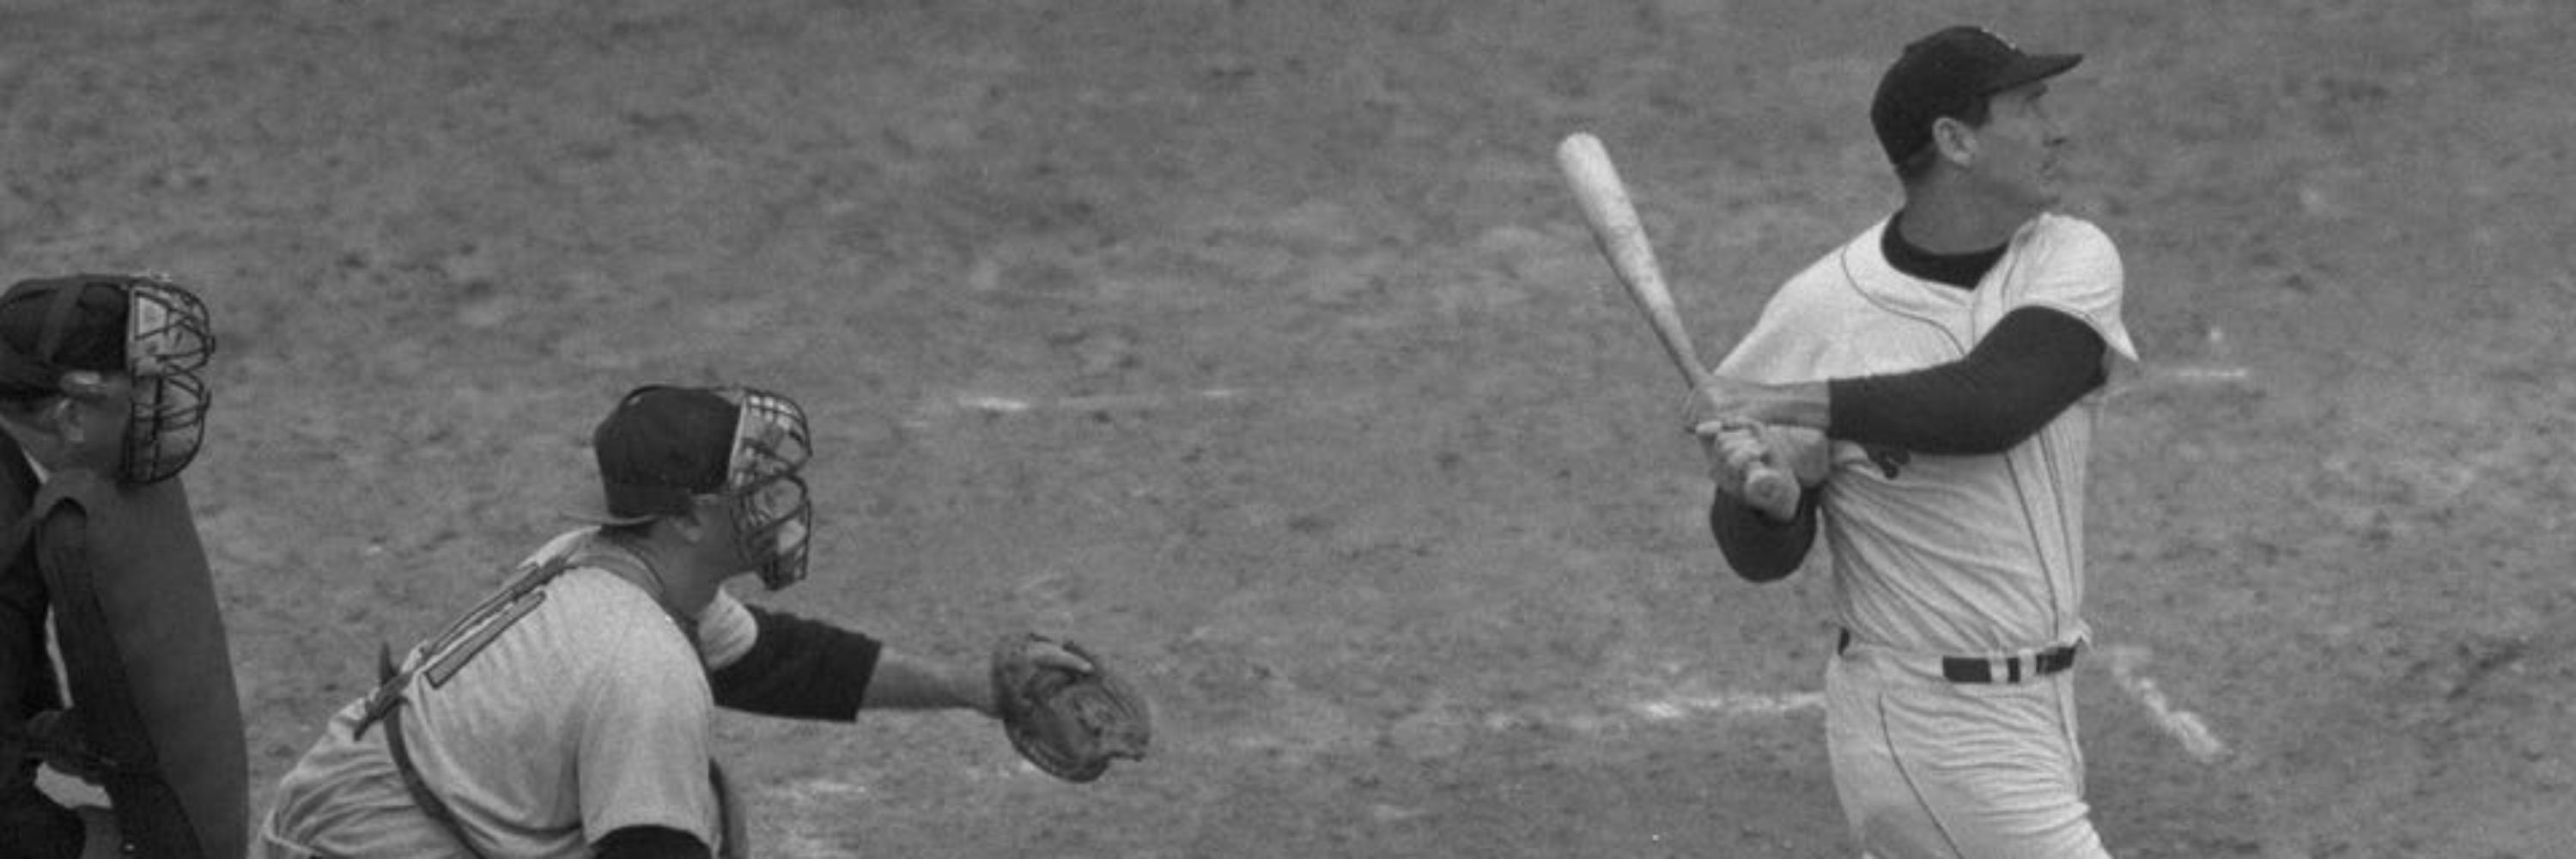
Today is the 65th anniversary of Ted's last swing (shown below), resulting in his 521st home run.


September 28, 2025 at 1:12 PM
Today is the 65th anniversary of Ted's last swing (shown below), resulting in his 521st home run.
Out-of-Place 'Devil Bird' Wows Spectators in Maine, the First Anhinga Ever Seen in the State share.google/htcC26o2eDqL...
Actually I spotted several yesterday in Camden ME. See one in my photo below.
Actually I spotted several yesterday in Camden ME. See one in my photo below.

September 4, 2025 at 1:33 AM
Out-of-Place 'Devil Bird' Wows Spectators in Maine, the First Anhinga Ever Seen in the State share.google/htcC26o2eDqL...
Actually I spotted several yesterday in Camden ME. See one in my photo below.
Actually I spotted several yesterday in Camden ME. See one in my photo below.
Here is a followup to my post about 500 ft being max distance, based on 2022 Statcast data.

July 17, 2025 at 12:17 PM
Here is a followup to my post about 500 ft being max distance, based on 2022 Statcast data.
Here's another try w/most of selection bias removed. For the regular season, I am plotting only home runs and only those hit at Truist Park. I find the distance of those hit at the HRD exceed (on average) those hit during regular season by 16 ft. More for the longest home runs.

July 16, 2025 at 1:46 AM
Here's another try w/most of selection bias removed. For the regular season, I am plotting only home runs and only those hit at Truist Park. I find the distance of those hit at the HRD exceed (on average) those hit during regular season by 16 ft. More for the longest home runs.
Here is another way to look at the data. I use a GAM to fit fly ball distance vs EV,LA for regular season, then apply fit to HRD, then plot actual vs fitted distance (red line is when actual=fitted). Note for HRD, actual exceeds fitted by average of 33ft. Air density not taken into account.

July 15, 2025 at 9:00 PM
Here is another way to look at the data. I use a GAM to fit fly ball distance vs EV,LA for regular season, then apply fit to HRD, then plot actual vs fitted distance (red line is when actual=fitted). Note for HRD, actual exceeds fitted by average of 33ft. Air density not taken into account.
At the HRD last night, the ball was carrying better than typical. In the graphs below, I show home run distance vs. exit velo for LA in 25-30 deg range, both for the 2025 season and for HRD. The red line on both graphs is a crude eyeball fit to the upper limit of the regular season data.

July 15, 2025 at 6:12 PM
At the HRD last night, the ball was carrying better than typical. In the graphs below, I show home run distance vs. exit velo for LA in 25-30 deg range, both for the 2025 season and for HRD. The red line on both graphs is a crude eyeball fit to the upper limit of the regular season data.
I expected best square-up to occur when AA matches both the VAA and centerline angle, in which case the LA would be equal to AA (if I neglect the spin of the pitch). It doesn't look like your analysis agrees with that.

June 2, 2025 at 8:55 PM
I expected best square-up to occur when AA matches both the VAA and centerline angle, in which case the LA would be equal to AA (if I neglect the spin of the pitch). It doesn't look like your analysis agrees with that.
For 2024 data, I have plotted collision efficiency q vs. LA-AA. Note that q removes variation due to both bat speed and pitch speed (q=(EV-vbat)/(vpitch+vbat). It peaks close to LA-AA=0, just as I would expect. Note that I have reversed the horiz and vert axes from your plot.

May 31, 2025 at 10:00 PM
For 2024 data, I have plotted collision efficiency q vs. LA-AA. Note that q removes variation due to both bat speed and pitch speed (q=(EV-vbat)/(vpitch+vbat). It peaks close to LA-AA=0, just as I would expect. Note that I have reversed the horiz and vert axes from your plot.

As we enter the Passover season, I thought I'd share this letter from our local newspaper.

April 12, 2025 at 2:47 PM
As we enter the Passover season, I thought I'd share this letter from our local newspaper.
Here's a screenshot of Dan Russell and me on our Zoom call yesterday discussing Torpedo bats and the testing we are preparing to do. I am holding a Torpedo-like bat that Louisville Slugger made for me back in 2000.

April 1, 2025 at 7:42 PM
Here's a screenshot of Dan Russell and me on our Zoom call yesterday discussing Torpedo bats and the testing we are preparing to do. I am holding a Torpedo-like bat that Louisville Slugger made for me back in 2000.
@sunshinevvn.bsky.social My first attempt, using a reasonable guess as to the bat profiles, old vs. torpedo. Both bats 33"/31 oz. MOI's are not much different. Solid curves are EV, dashed curves are q. Max of EV shifts out ~0.5".

March 30, 2025 at 4:06 PM
@sunshinevvn.bsky.social My first attempt, using a reasonable guess as to the bat profiles, old vs. torpedo. Both bats 33"/31 oz. MOI's are not much different. Solid curves are EV, dashed curves are q. Max of EV shifts out ~0.5".
So I did a study, using the same data and technique discussed here: tht.fangraphs.com/pitch-moveme..., the results of which are shown in the graphs. While there are systematic differences, they are of the order of 0.1 inches or less. (2/3)

February 25, 2025 at 8:00 PM
So I did a study, using the same data and technique discussed here: tht.fangraphs.com/pitch-moveme..., the results of which are shown in the graphs. While there are systematic differences, they are of the order of 0.1 inches or less. (2/3)
Very interesting article which I highly recommend. One conclusion is that it is better to mis-hit on the knob side of the sweet spot than on the barrel tip side. There is some interesting physics as to why that is so. See clip from here:
baseball.physics.illinois.edu/THTAnnual201...
baseball.physics.illinois.edu/THTAnnual201...

February 16, 2025 at 6:47 PM
Very interesting article which I highly recommend. One conclusion is that it is better to mis-hit on the knob side of the sweet spot than on the barrel tip side. There is some interesting physics as to why that is so. See clip from here:
baseball.physics.illinois.edu/THTAnnual201...
baseball.physics.illinois.edu/THTAnnual201...
Just to convince you that "theory" (based on physics) is actually realized, take a look at the random sample of pitch data, sorted by pitch type. Upper plot shows movement (M) vs v, color coded by Cl. Lower is M vs Cl, color coded by v.

February 6, 2025 at 5:03 PM
Just to convince you that "theory" (based on physics) is actually realized, take a look at the random sample of pitch data, sorted by pitch type. Upper plot shows movement (M) vs v, color coded by Cl. Lower is M vs Cl, color coded by v.
No words necessary...

February 2, 2025 at 11:21 PM
No words necessary...
Here's a nice example.
January 22, 2025 at 2:50 PM
Here's a nice example.
How great is this! A menorah fit for a baseball fan!

December 29, 2024 at 10:57 PM
How great is this! A menorah fit for a baseball fan!
I have been maintaining that pitch movement is independent of velocity for a fixed ratio of spin to speed (i.e., for fixed Bauer units). Not only is this true based on physics, it is also supported by the data. Below I show movement vs. Bauer for different fixed value of velo.

December 27, 2024 at 6:01 PM
I have been maintaining that pitch movement is independent of velocity for a fixed ratio of spin to speed (i.e., for fixed Bauer units). Not only is this true based on physics, it is also supported by the data. Below I show movement vs. Bauer for different fixed value of velo.

My version of the same cards. Wilt is badly off center, West a little. O and Elgin are pretty good.

December 26, 2024 at 7:51 PM
My version of the same cards. Wilt is badly off center, West a little. O and Elgin are pretty good.
Looks like I can post a gif, so here is mp4 instead.
December 24, 2024 at 11:12 PM
Looks like I can post a gif, so here is mp4 instead.
Great example here. Note that this is a visual confirmation of the bat-tracking analysis shows quantitatively shows the same thing, as per @tangotiger.com

December 24, 2024 at 7:17 PM
Great example here. Note that this is a visual confirmation of the bat-tracking analysis shows quantitatively shows the same thing, as per @tangotiger.com