

@pgdataviz.bsky.social
Statistical Programmer (Epidemiologist by training) using #Rstats and #Python mostly.
#DataScience #Dataviz
https://pgdatavizandstats.netlify.app/
#DataScience #Dataviz
https://pgdatavizandstats.netlify.app/
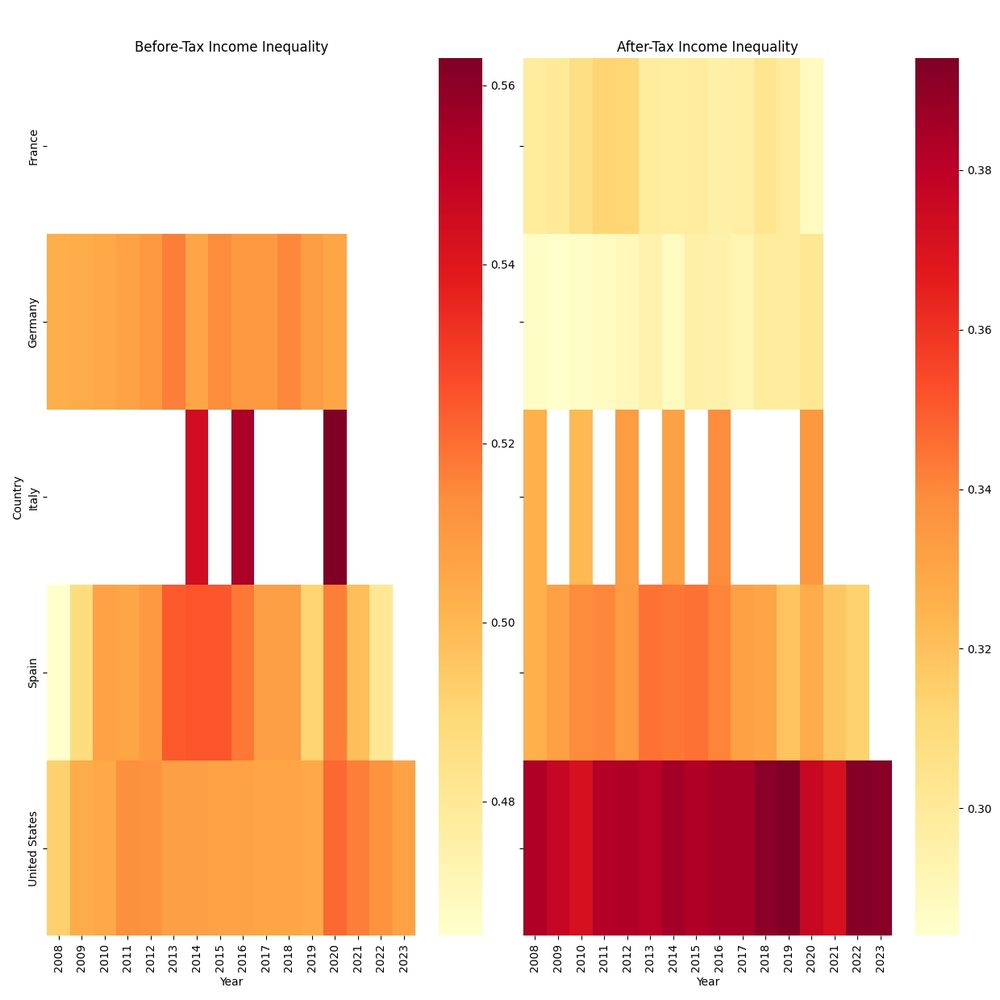
This week's submission for #PydyTuesday. Missed ggplot slot when trying to make this plot
Code here: pgdatavizandstats.netlify.app/data_visuali...
#rstats | #python | #dataviz | #TidyTuesday
Code here: pgdatavizandstats.netlify.app/data_visuali...
#rstats | #python | #dataviz | #TidyTuesday

November 11, 2025 at 5:20 PM
This week's submission for #PydyTuesday. Missed ggplot slot when trying to make this plot
Code here: pgdatavizandstats.netlify.app/data_visuali...
#rstats | #python | #dataviz | #TidyTuesday
Code here: pgdatavizandstats.netlify.app/data_visuali...
#rstats | #python | #dataviz | #TidyTuesday
My submission for #PydyTuesday. A quick jaunt back to Python and some Violin plots
Code here: pgdatavizandstats.netlify.app/data_visuali...
#rstats | #python | #dataviz | #TidyTuesday
Code here: pgdatavizandstats.netlify.app/data_visuali...
#rstats | #python | #dataviz | #TidyTuesday

November 6, 2025 at 11:01 AM
My submission for #PydyTuesday. A quick jaunt back to Python and some Violin plots
Code here: pgdatavizandstats.netlify.app/data_visuali...
#rstats | #python | #dataviz | #TidyTuesday
Code here: pgdatavizandstats.netlify.app/data_visuali...
#rstats | #python | #dataviz | #TidyTuesday
Anyone here better with the ggsankey package than I am? - I am trying to label the flow with the number of people transitioning through each stage. I have found no examples on the internet of labeling the flow (plenty labeling the nodes).
I have below what I need to try
#rstats #dataviz #ggplot2
I have below what I need to try
#rstats #dataviz #ggplot2

November 5, 2025 at 10:58 AM
Looked at the percentage of Oxbridge educated people who have won various British Literary Prizes for #TidyTuesday. I used ggbrick and, as the bricks of look like books, tried to make it look like they were in bookshelves with meh results.
Code here: tinyurl.com/bddsuuc3
#rstats | #dataviz
Code here: tinyurl.com/bddsuuc3
#rstats | #dataviz

October 30, 2025 at 9:09 AM
Looked at the percentage of Oxbridge educated people who have won various British Literary Prizes for #TidyTuesday. I used ggbrick and, as the bricks of look like books, tried to make it look like they were in bookshelves with meh results.
Code here: tinyurl.com/bddsuuc3
#rstats | #dataviz
Code here: tinyurl.com/bddsuuc3
#rstats | #dataviz
As a Welshman, taking the opportunity to ignore the English and focus only on Wales for #TidyTuesday. Looking at the average weather for Wales in 2024 and now I've made myself homesick.
Code here: pgdatavizandstats.netlify.app/data_visuali...
#rstats | #dataviz
Code here: pgdatavizandstats.netlify.app/data_visuali...
#rstats | #dataviz


October 23, 2025 at 5:56 AM
As a Welshman, taking the opportunity to ignore the English and focus only on Wales for #TidyTuesday. Looking at the average weather for Wales in 2024 and now I've made myself homesick.
Code here: pgdatavizandstats.netlify.app/data_visuali...
#rstats | #dataviz
Code here: pgdatavizandstats.netlify.app/data_visuali...
#rstats | #dataviz
It's Monday which mean my chaotic self is submitting last weeks #TidyTuesday. I chose to look at water access as most people had looked at food in much nicer ways than me.
Code here: pgdatavizandstats.netlify.app/data_visuali...
#rstats | #dataviz
Code here: pgdatavizandstats.netlify.app/data_visuali...
#rstats | #dataviz

October 20, 2025 at 5:36 PM
It's Monday which mean my chaotic self is submitting last weeks #TidyTuesday. I chose to look at water access as most people had looked at food in much nicer ways than me.
Code here: pgdatavizandstats.netlify.app/data_visuali...
#rstats | #dataviz
Code here: pgdatavizandstats.netlify.app/data_visuali...
#rstats | #dataviz
Holiday and job-hunting sucking my soul mean I am a week behind and needed to do a(nother) rush job for #TidyTuesday. I have been playing with Reactable though
Code here: pgdatavizandstats.netlify.app/data_visuali...
#rstats | #dataviz
Code here: pgdatavizandstats.netlify.app/data_visuali...
#rstats | #dataviz

October 14, 2025 at 10:59 AM
Holiday and job-hunting sucking my soul mean I am a week behind and needed to do a(nother) rush job for #TidyTuesday. I have been playing with Reactable though
Code here: pgdatavizandstats.netlify.app/data_visuali...
#rstats | #dataviz
Code here: pgdatavizandstats.netlify.app/data_visuali...
#rstats | #dataviz
Tried the datapasta package out, which is a form of minor miracle to get the country codes for the players.
Managed to crack a map of grandmasters per country before flying home to the UK for a break
Code here:
pgdatavizandstats.netlify.app/data_visuali...
#dataviz | #rstats | #tidytuesday
Managed to crack a map of grandmasters per country before flying home to the UK for a break
Code here:
pgdatavizandstats.netlify.app/data_visuali...
#dataviz | #rstats | #tidytuesday

September 23, 2025 at 8:51 AM
Tried the datapasta package out, which is a form of minor miracle to get the country codes for the players.
Managed to crack a map of grandmasters per country before flying home to the UK for a break
Code here:
pgdatavizandstats.netlify.app/data_visuali...
#dataviz | #rstats | #tidytuesday
Managed to crack a map of grandmasters per country before flying home to the UK for a break
Code here:
pgdatavizandstats.netlify.app/data_visuali...
#dataviz | #rstats | #tidytuesday
#TidyTuesday attempt for this week.
#rstats | #dataviz
Code here:
pgdatavizandstats.netlify.app/data_visuali...
#rstats | #dataviz
Code here:
pgdatavizandstats.netlify.app/data_visuali...

September 16, 2025 at 10:26 AM
#TidyTuesday attempt for this week.
#rstats | #dataviz
Code here:
pgdatavizandstats.netlify.app/data_visuali...
#rstats | #dataviz
Code here:
pgdatavizandstats.netlify.app/data_visuali...
Missed last week's #TidyTuesday / #pydyTuesday due to work/toddler commitments but I'm ahead for this one. Such is life
Tried making a dashboard in python Whoever coded #streamlit is a genius
Dashboard here
tidytuespassportdashboard.streamlit.app
Code here
pgdatavizandstats.netlify.app/datavis
Tried making a dashboard in python Whoever coded #streamlit is a genius
Dashboard here
tidytuespassportdashboard.streamlit.app
Code here
pgdatavizandstats.netlify.app/datavis


September 8, 2025 at 6:25 PM
Missed last week's #TidyTuesday / #pydyTuesday due to work/toddler commitments but I'm ahead for this one. Such is life
Tried making a dashboard in python Whoever coded #streamlit is a genius
Dashboard here
tidytuespassportdashboard.streamlit.app
Code here
pgdatavizandstats.netlify.app/datavis
Tried making a dashboard in python Whoever coded #streamlit is a genius
Dashboard here
tidytuespassportdashboard.streamlit.app
Code here
pgdatavizandstats.netlify.app/datavis
For #TidyTuesday / #PydyTuesday I have struggled with the port of patchwork over to python. If anyone has any ideas on how to fix the titles of the graphs, I'm all ears.
Also Plotnine is a minor miracle.
Code Here:
pgdatavizandstats.netlify.app/data_visuali...
#dataviz | #python
Also Plotnine is a minor miracle.
Code Here:
pgdatavizandstats.netlify.app/data_visuali...
#dataviz | #python

August 27, 2025 at 6:58 PM
For #TidyTuesday / #PydyTuesday I have struggled with the port of patchwork over to python. If anyone has any ideas on how to fix the titles of the graphs, I'm all ears.
Also Plotnine is a minor miracle.
Code Here:
pgdatavizandstats.netlify.app/data_visuali...
#dataviz | #python
Also Plotnine is a minor miracle.
Code Here:
pgdatavizandstats.netlify.app/data_visuali...
#dataviz | #python
(Reposted because I can't spell) Back to the warm blanket that is ggplot2 for #TidyTuesday.
A Sankey diagram of how the classifications of Scottish Munros have changed over time
#rstats | #dataviz | #ggplot2
Code here:
pgdatavizandstats.netlify.app/data_visuali...
A Sankey diagram of how the classifications of Scottish Munros have changed over time
#rstats | #dataviz | #ggplot2
Code here:
pgdatavizandstats.netlify.app/data_visuali...

August 19, 2025 at 3:49 PM
(Reposted because I can't spell) Back to the warm blanket that is ggplot2 for #TidyTuesday.
A Sankey diagram of how the classifications of Scottish Munros have changed over time
#rstats | #dataviz | #ggplot2
Code here:
pgdatavizandstats.netlify.app/data_visuali...
A Sankey diagram of how the classifications of Scottish Munros have changed over time
#rstats | #dataviz | #ggplot2
Code here:
pgdatavizandstats.netlify.app/data_visuali...
Another #TidyTuesday / #PyDytuesday another week of thinking that making graphs in Python just isn't as nice as it is in R (Skill issue, I know)
Code here:
pgdatavizandstats.netlify.app/data_visuali...
#dataviz | #python
Code here:
pgdatavizandstats.netlify.app/data_visuali...
#dataviz | #python

August 13, 2025 at 4:20 PM
Another #TidyTuesday / #PyDytuesday another week of thinking that making graphs in Python just isn't as nice as it is in R (Skill issue, I know)
Code here:
pgdatavizandstats.netlify.app/data_visuali...
#dataviz | #python
Code here:
pgdatavizandstats.netlify.app/data_visuali...
#dataviz | #python


I've been cursing out my Propensity Score Matching project all week at work so a very brief #TldyTuesday and #PyDyTuesday. If I have time I'll try and do a better job.
Code here: pgdatavizandstats.netlify.app/data_visuali...
#python | #dataviz | #rstats
Code here: pgdatavizandstats.netlify.app/data_visuali...
#python | #dataviz | #rstats
August 5, 2025 at 4:53 PM
I've been cursing out my Propensity Score Matching project all week at work so a very brief #TldyTuesday and #PyDyTuesday. If I have time I'll try and do a better job.
Code here: pgdatavizandstats.netlify.app/data_visuali...
#python | #dataviz | #rstats
Code here: pgdatavizandstats.netlify.app/data_visuali...
#python | #dataviz | #rstats
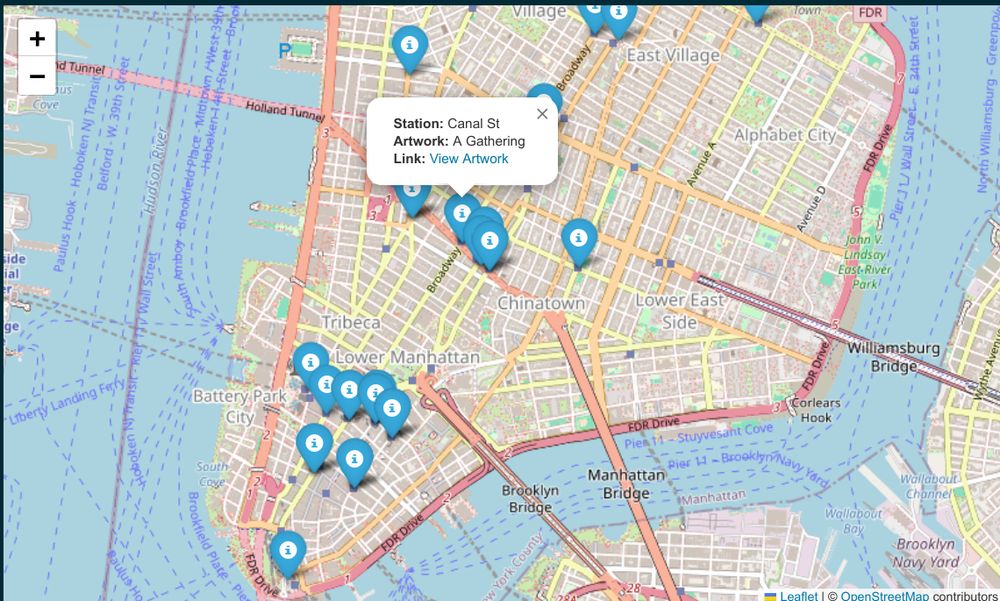
Created an Interactive map with Folium of all the New York MTA artworks for #TIdyTuesday and #PyDyTuesday
#python | #dataviz | #gis
Code here: pgdatavizandstats.netlify.app/data_visuali...
#python | #dataviz | #gis
Code here: pgdatavizandstats.netlify.app/data_visuali...
July 23, 2025 at 8:34 AM
Created an Interactive map with Folium of all the New York MTA artworks for #TIdyTuesday and #PyDyTuesday
#python | #dataviz | #gis
Code here: pgdatavizandstats.netlify.app/data_visuali...
#python | #dataviz | #gis
Code here: pgdatavizandstats.netlify.app/data_visuali...
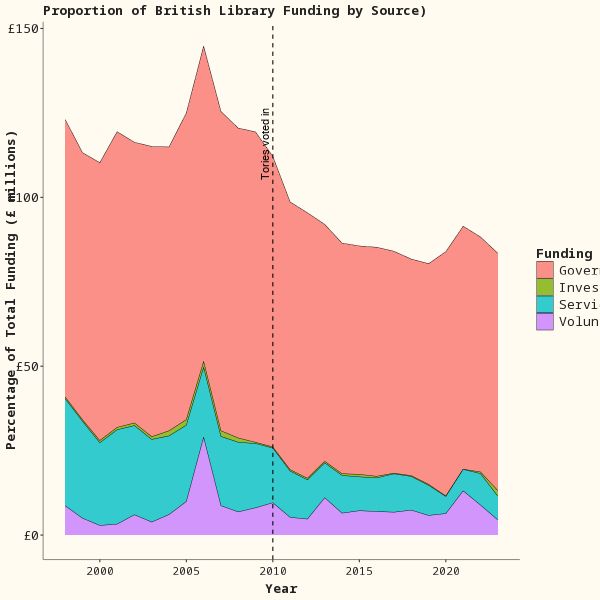
Back to ggplot2 because I was in a rush. British Library Funding
Significant downturn in funding post 2010. As prospective employers may see this one day, I don't speculate on the reason.
code here: pgdatavizandstats.netlify.app/data_visuali...
#RStats | #TidyTuesday | #DataViz
Significant downturn in funding post 2010. As prospective employers may see this one day, I don't speculate on the reason.
code here: pgdatavizandstats.netlify.app/data_visuali...
#RStats | #TidyTuesday | #DataViz
July 15, 2025 at 6:08 PM
Back to ggplot2 because I was in a rush. British Library Funding
Significant downturn in funding post 2010. As prospective employers may see this one day, I don't speculate on the reason.
code here: pgdatavizandstats.netlify.app/data_visuali...
#RStats | #TidyTuesday | #DataViz
Significant downturn in funding post 2010. As prospective employers may see this one day, I don't speculate on the reason.
code here: pgdatavizandstats.netlify.app/data_visuali...
#RStats | #TidyTuesday | #DataViz
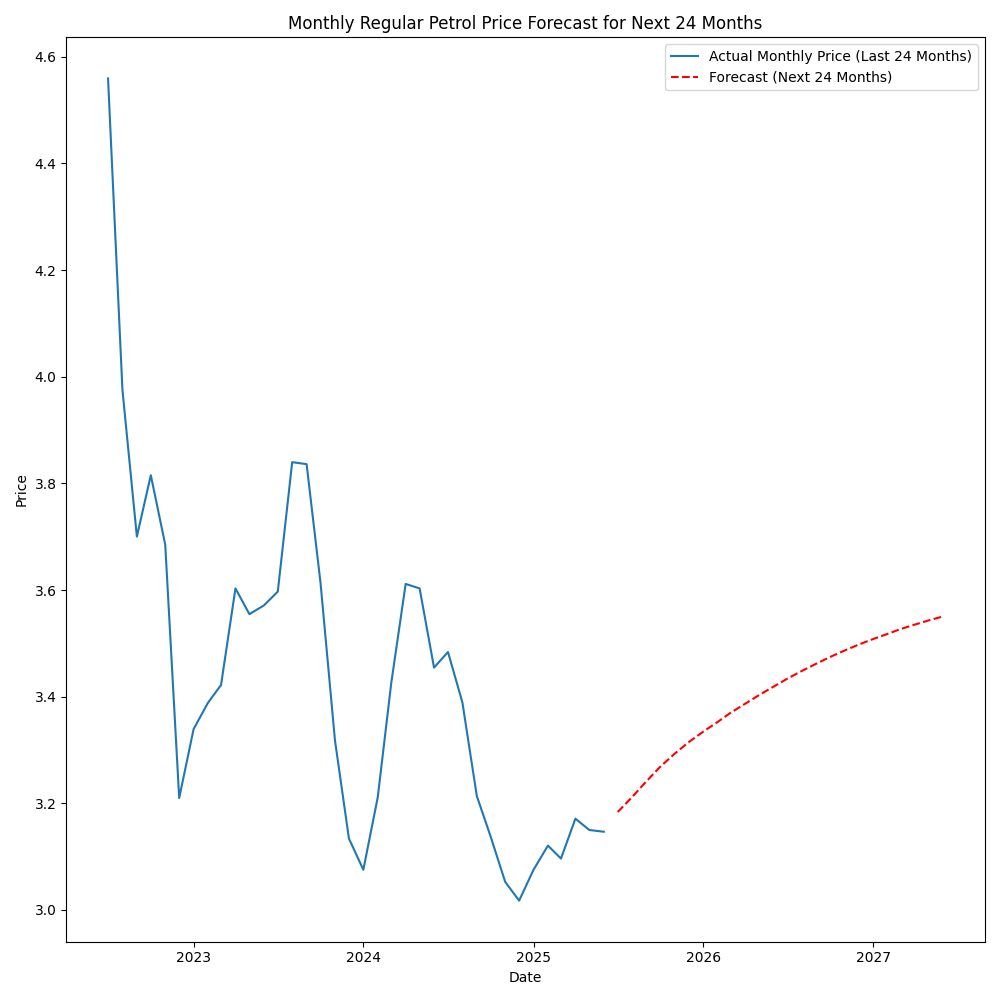
Anyway, tried something a bit more advanced this week, building a Model in Python to predict petrol (Americans it's a liquid - your name is stupid) prices.
Borrowed heavily from here shorturl.at/3q1BR
code here: pgdatavizandstats.netlify.app/data_visuali...
#Python | #TidyTuesday | #PyDayTuesday
Borrowed heavily from here shorturl.at/3q1BR
code here: pgdatavizandstats.netlify.app/data_visuali...
#Python | #TidyTuesday | #PyDayTuesday
July 1, 2025 at 5:22 PM
Anyway, tried something a bit more advanced this week, building a Model in Python to predict petrol (Americans it's a liquid - your name is stupid) prices.
Borrowed heavily from here shorturl.at/3q1BR
code here: pgdatavizandstats.netlify.app/data_visuali...
#Python | #TidyTuesday | #PyDayTuesday
Borrowed heavily from here shorturl.at/3q1BR
code here: pgdatavizandstats.netlify.app/data_visuali...
#Python | #TidyTuesday | #PyDayTuesday