


Petr Bouda
@pbouda.bsky.social
JVM/Java Enthusiast and author of Jeffrey Analyst (https://www.jeffrey-analyst.cafe/)
Reposted by Petr Bouda

📢 Microsoft is hiring a Senior Compiler Engineer to work on the #JVM!
If you have strong compiler / codegen / optimization skills, this could be your next big challenge.
Want a referral? Send me a DM.
#Hiring #CompilerEngineering #Systems #Microsoft #Java #OpenJDK #Java25
If you have strong compiler / codegen / optimization skills, this could be your next big challenge.
Want a referral? Send me a DM.
#Hiring #CompilerEngineering #Systems #Microsoft #Java #OpenJDK #Java25
September 18, 2025 at 5:49 PM
📢 Microsoft is hiring a Senior Compiler Engineer to work on the #JVM!
If you have strong compiler / codegen / optimization skills, this could be your next big challenge.
Want a referral? Send me a DM.
#Hiring #CompilerEngineering #Systems #Microsoft #Java #OpenJDK #Java25
If you have strong compiler / codegen / optimization skills, this could be your next big challenge.
Want a referral? Send me a DM.
#Hiring #CompilerEngineering #Systems #Microsoft #Java #OpenJDK #Java25
🔥 Jeffrey 0.5 is HERE! 🔥
✨ Big Upgrade of Java performance detective. Ready to level up your Java performance game?✨
Look at the current features!
🔗 www.jeffrey-analyst.cafe#features
#Java #Performance #JFR #OpenJDK
✨ Big Upgrade of Java performance detective. Ready to level up your Java performance game?✨
Look at the current features!
🔗 www.jeffrey-analyst.cafe#features
#Java #Performance #JFR #OpenJDK

Jeffrey - Java Profiling Tool
Jeffrey - Java Profiling Tool for JFR Recordings
www.jeffrey-analyst.cafe
July 16, 2025 at 7:44 PM
🔥 Jeffrey 0.5 is HERE! 🔥
✨ Big Upgrade of Java performance detective. Ready to level up your Java performance game?✨
Look at the current features!
🔗 www.jeffrey-analyst.cafe#features
#Java #Performance #JFR #OpenJDK
✨ Big Upgrade of Java performance detective. Ready to level up your Java performance game?✨
Look at the current features!
🔗 www.jeffrey-analyst.cafe#features
#Java #Performance #JFR #OpenJDK
Reposted by Petr Bouda

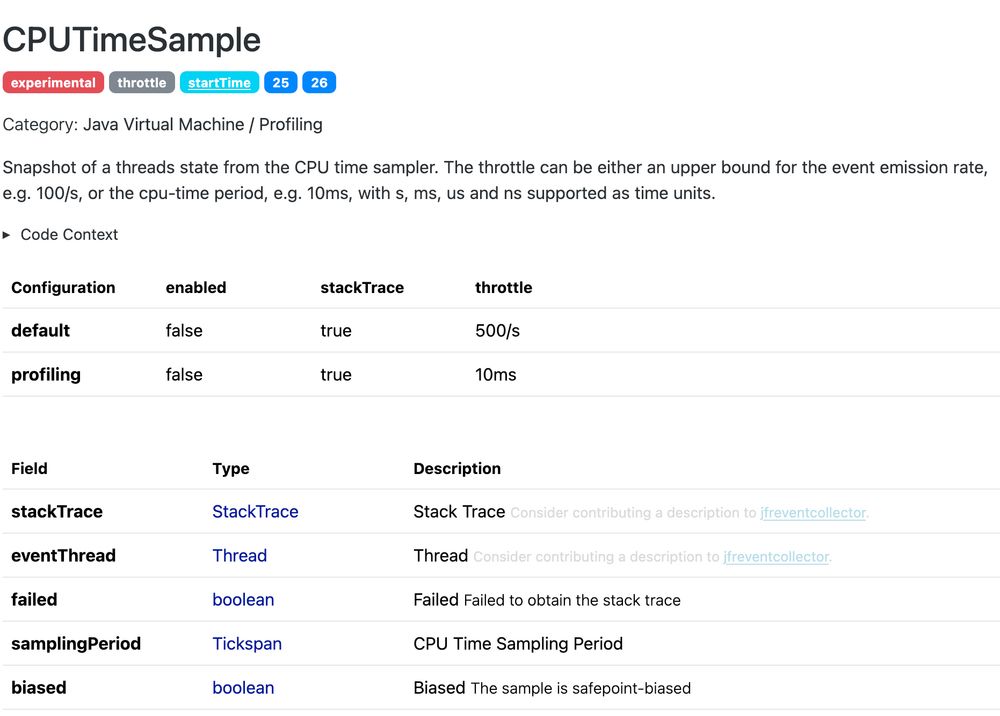
I just updated the JFR events collection (sapmachine.io/jfrevents). It now includes JDK 25 and JDK 26 with my CPUTimeSample event:
June 10, 2025 at 12:44 PM
I just updated the JFR events collection (sapmachine.io/jfrevents). It now includes JDK 25 and JDK 26 with my CPUTimeSample event:
Reposted by Petr Bouda

Insightful session on advanced performance analysis with async-profiler, presented by Andrei Pangin.
🎥 www.youtube.com/watch?v=u7-S...
#Java #Performance #Profiling
🎥 www.youtube.com/watch?v=u7-S...
#Java #Performance #Profiling
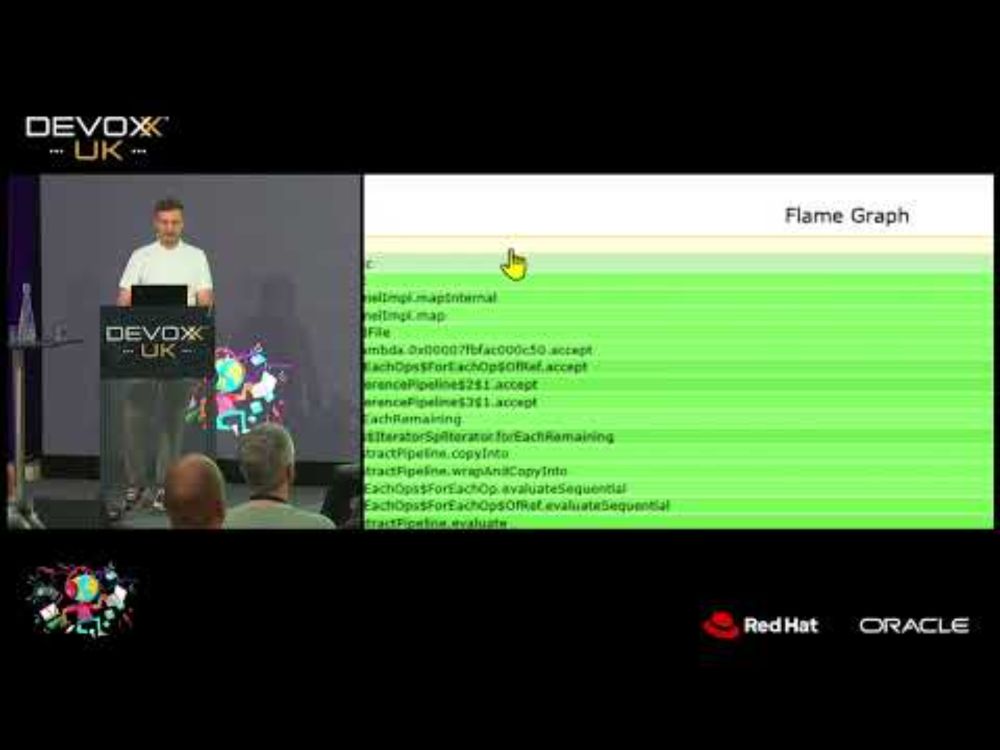
Advanced performance analysis with async-profiler by Andrei Pangin
YouTube video by Devoxx UK
www.youtube.com
May 17, 2025 at 6:00 AM
Insightful session on advanced performance analysis with async-profiler, presented by Andrei Pangin.
🎥 www.youtube.com/watch?v=u7-S...
#Java #Performance #Profiling
🎥 www.youtube.com/watch?v=u7-S...
#Java #Performance #Profiling
Reposted by Petr Bouda

TIL: since jdk22 you can use the JVM option -XX:LogClassLoadingCauseFor=com.mycompany.MyClass in conjunction with -Xlog:class+load+cause* to find out the stacktrace that triggers the load of the specify class.
see github.com/openjdk/jdk/...
see github.com/openjdk/jdk/...
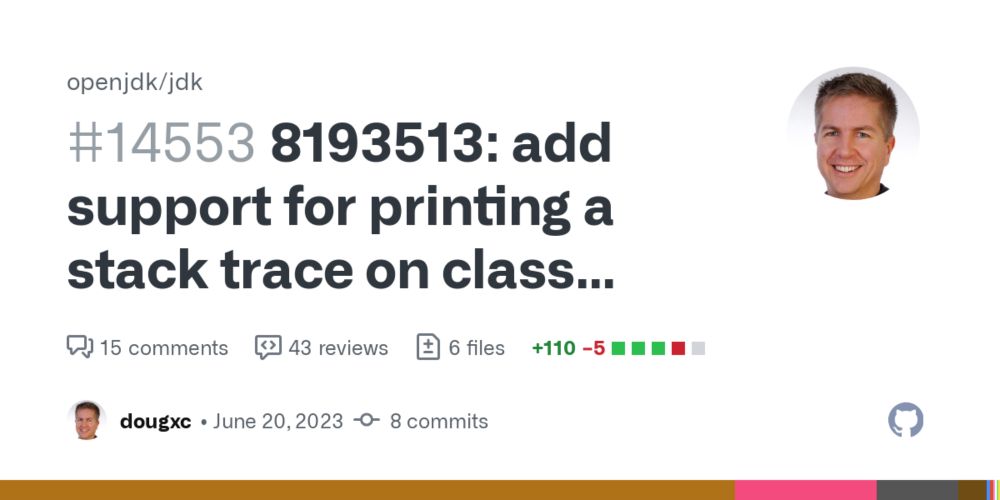
8193513: add support for printing a stack trace on class loading by dougxc · Pull Request #14553 · openjdk/jdk
In the development of libgraal, it has been very useful to see why a given class is loaded (e.g., trying to reduce startup time by avoiding unnecessary eager class loading). One way to do this is t...
github.com
May 13, 2025 at 3:07 PM
TIL: since jdk22 you can use the JVM option -XX:LogClassLoadingCauseFor=com.mycompany.MyClass in conjunction with -Xlog:class+load+cause* to find out the stacktrace that triggers the load of the specify class.
see github.com/openjdk/jdk/...
see github.com/openjdk/jdk/...
