


Josep Padullés Cubino
@padulles.bsky.social
Ramón y Cajal research fellow at the Botanical Institute of Barcelona (IBB), CSIC-MCNB
www.ecology-padulles.net
www.ecology-padulles.net
6/
Another key metric: community evolutionary distinctiveness (CED).
This tells us how many evolutionarily unique or isolated lineages a community contains.
Surprise: North America comes out on top, its forests host especially distinctive plant lineages.
Another key metric: community evolutionary distinctiveness (CED).
This tells us how many evolutionarily unique or isolated lineages a community contains.
Surprise: North America comes out on top, its forests host especially distinctive plant lineages.

November 11, 2025 at 10:31 AM
6/
Another key metric: community evolutionary distinctiveness (CED).
This tells us how many evolutionarily unique or isolated lineages a community contains.
Surprise: North America comes out on top, its forests host especially distinctive plant lineages.
Another key metric: community evolutionary distinctiveness (CED).
This tells us how many evolutionarily unique or isolated lineages a community contains.
Surprise: North America comes out on top, its forests host especially distinctive plant lineages.
5/
Between regions, the biggest evolutionary gap was between west Eurasia and east Eurasia.
Forests in North America and east Eurasia, on the other hand, shared more evolutionary history than we expected.
Between regions, the biggest evolutionary gap was between west Eurasia and east Eurasia.
Forests in North America and east Eurasia, on the other hand, shared more evolutionary history than we expected.

November 11, 2025 at 10:31 AM
5/
Between regions, the biggest evolutionary gap was between west Eurasia and east Eurasia.
Forests in North America and east Eurasia, on the other hand, shared more evolutionary history than we expected.
Between regions, the biggest evolutionary gap was between west Eurasia and east Eurasia.
Forests in North America and east Eurasia, on the other hand, shared more evolutionary history than we expected.
4/
We also looked at phylogenetic turnover, in simple terms, how different the evolutionary histories of forest communities are within and between regions.
East Eurasia showed the most uniform evolutionary makeup, while West Eurasia had the strongest internal differences.
We also looked at phylogenetic turnover, in simple terms, how different the evolutionary histories of forest communities are within and between regions.
East Eurasia showed the most uniform evolutionary makeup, while West Eurasia had the strongest internal differences.

November 11, 2025 at 10:31 AM
4/
We also looked at phylogenetic turnover, in simple terms, how different the evolutionary histories of forest communities are within and between regions.
East Eurasia showed the most uniform evolutionary makeup, while West Eurasia had the strongest internal differences.
We also looked at phylogenetic turnover, in simple terms, how different the evolutionary histories of forest communities are within and between regions.
East Eurasia showed the most uniform evolutionary makeup, while West Eurasia had the strongest internal differences.
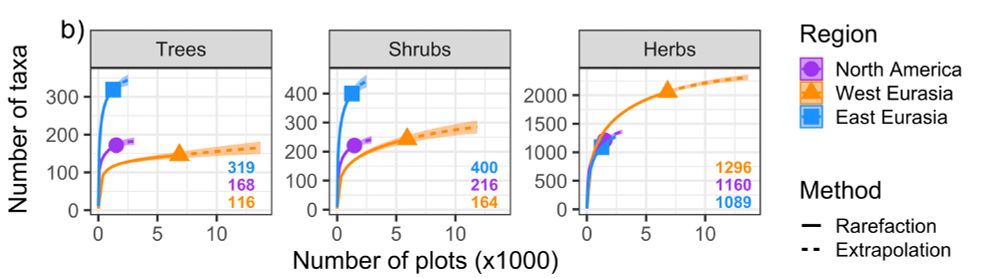
3/
First big takeaway: East Eurasia is the champion of plant species richness, especially when it comes to trees and shrubs.
West Eurasia, meanwhile, shines in herb diversity.
Forests may look similar at first glance, but evolution played out very differently in each region.
First big takeaway: East Eurasia is the champion of plant species richness, especially when it comes to trees and shrubs.
West Eurasia, meanwhile, shines in herb diversity.
Forests may look similar at first glance, but evolution played out very differently in each region.
November 11, 2025 at 10:31 AM
3/
First big takeaway: East Eurasia is the champion of plant species richness, especially when it comes to trees and shrubs.
West Eurasia, meanwhile, shines in herb diversity.
Forests may look similar at first glance, but evolution played out very differently in each region.
First big takeaway: East Eurasia is the champion of plant species richness, especially when it comes to trees and shrubs.
West Eurasia, meanwhile, shines in herb diversity.
Forests may look similar at first glance, but evolution played out very differently in each region.
2/
We pulled together ~9600 vegetation plots from across the Northern Hemisphere.
(Important note: this isn’t a complete sampling of the entire biome; these are the best available plot data, but big gaps remain!)
We pulled together ~9600 vegetation plots from across the Northern Hemisphere.
(Important note: this isn’t a complete sampling of the entire biome; these are the best available plot data, but big gaps remain!)

November 11, 2025 at 10:31 AM
2/
We pulled together ~9600 vegetation plots from across the Northern Hemisphere.
(Important note: this isn’t a complete sampling of the entire biome; these are the best available plot data, but big gaps remain!)
We pulled together ~9600 vegetation plots from across the Northern Hemisphere.
(Important note: this isn’t a complete sampling of the entire biome; these are the best available plot data, but big gaps remain!)
@alichenology.bsky.social
Alguna idea?
Alguna idea?

April 9, 2025 at 11:57 AM
@alichenology.bsky.social
Alguna idea?
Alguna idea?