


Andy Kriebel
@nextleveltableau.bsky.social
Become so good at Tableau that you don't need me • Founder @ Next-Level Tableau • Tableau Visionary Hall of Fame • DataIQ Top 100 Most Influential People in Data • Author & Speaker
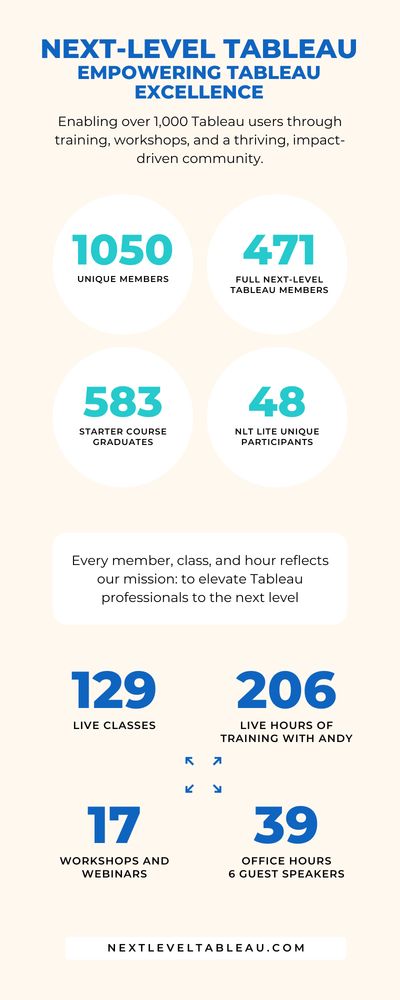
What a year it’s been for the NLT community! 🎉
In 2024, over 1,000 members joined us, showing incredible dedication to mastering Tableau.
To each of you who joined, asked questions, shared ideas, and committed to growing—thank you. Your passion and energy inspire me every single day.
In 2024, over 1,000 members joined us, showing incredible dedication to mastering Tableau.
To each of you who joined, asked questions, shared ideas, and committed to growing—thank you. Your passion and energy inspire me every single day.
December 31, 2024 at 9:01 PM
What a year it’s been for the NLT community! 🎉
In 2024, over 1,000 members joined us, showing incredible dedication to mastering Tableau.
To each of you who joined, asked questions, shared ideas, and committed to growing—thank you. Your passion and energy inspire me every single day.
In 2024, over 1,000 members joined us, showing incredible dedication to mastering Tableau.
To each of you who joined, asked questions, shared ideas, and committed to growing—thank you. Your passion and energy inspire me every single day.
6,108 days ago Tableau changed my life. I'm on a mission to help you change yours too.
Today is your last day to join Next-Level Tableau at 2024 rates and lock them in for life.
Plus, new annual members get a personal coaching session with me.
👉 Sign up: nextleveltableau.com/
Today is your last day to join Next-Level Tableau at 2024 rates and lock them in for life.
Plus, new annual members get a personal coaching session with me.
👉 Sign up: nextleveltableau.com/
December 31, 2024 at 4:01 PM
6,108 days ago Tableau changed my life. I'm on a mission to help you change yours too.
Today is your last day to join Next-Level Tableau at 2024 rates and lock them in for life.
Plus, new annual members get a personal coaching session with me.
👉 Sign up: nextleveltableau.com/
Today is your last day to join Next-Level Tableau at 2024 rates and lock them in for life.
Plus, new annual members get a personal coaching session with me.
👉 Sign up: nextleveltableau.com/
You no longer need complex calculations to configure Trellis charts in Tableau...how?
NLT members will learn this technique Thursday as we kick off 2025 learning.
Bonus: DZV for additional context
Today is your last day to join Next-Level Tableau at 2024 prices.
Sign up at nextleveltableau.com
NLT members will learn this technique Thursday as we kick off 2025 learning.
Bonus: DZV for additional context
Today is your last day to join Next-Level Tableau at 2024 prices.
Sign up at nextleveltableau.com
December 31, 2024 at 12:19 PM
You no longer need complex calculations to configure Trellis charts in Tableau...how?
NLT members will learn this technique Thursday as we kick off 2025 learning.
Bonus: DZV for additional context
Today is your last day to join Next-Level Tableau at 2024 prices.
Sign up at nextleveltableau.com
NLT members will learn this technique Thursday as we kick off 2025 learning.
Bonus: DZV for additional context
Today is your last day to join Next-Level Tableau at 2024 prices.
Sign up at nextleveltableau.com
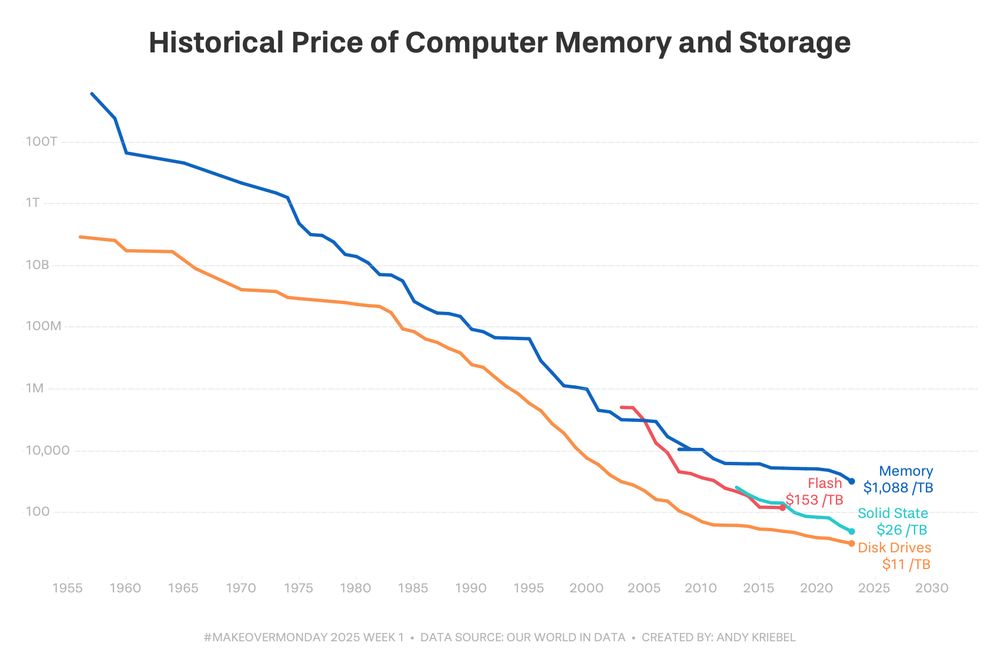
Ever wondered how to create a perfectly formatted custom axes like this in Tableau? I have a secret that will save you hours of complex calculations.
For my latest #MakeoverMonday viz, I cheated. It’s not a hack. It's a workaround.
The solution? Reference lines.
No complex calculations needed.
For my latest #MakeoverMonday viz, I cheated. It’s not a hack. It's a workaround.
The solution? Reference lines.
No complex calculations needed.
December 30, 2024 at 9:26 PM
Ever wondered how to create a perfectly formatted custom axes like this in Tableau? I have a secret that will save you hours of complex calculations.
For my latest #MakeoverMonday viz, I cheated. It’s not a hack. It's a workaround.
The solution? Reference lines.
No complex calculations needed.
For my latest #MakeoverMonday viz, I cheated. It’s not a hack. It's a workaround.
The solution? Reference lines.
No complex calculations needed.
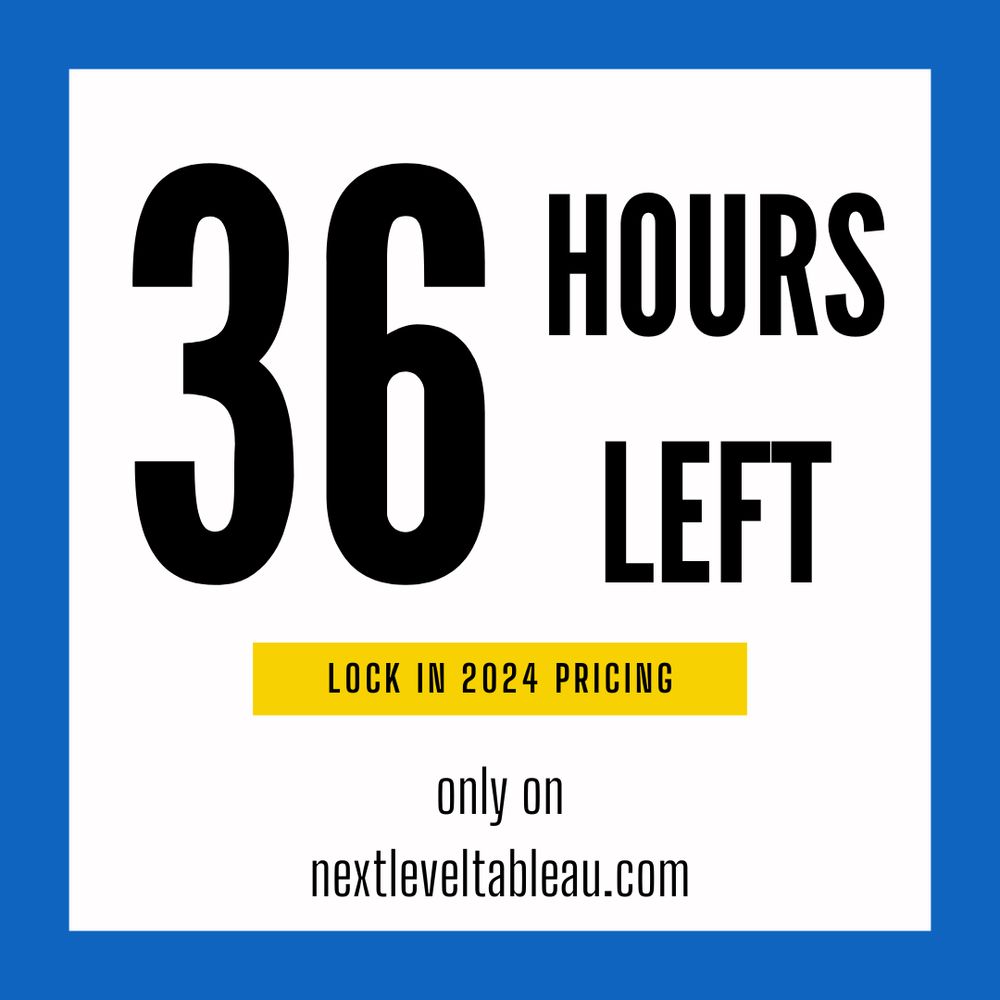
"I wish I paid more for Tableau training" - Said no one ever.
36 hours left to lock in 2024 prices. Forever.
• Monthly: $329 (up from $297)
• Quarterly: $899 (up from $840)
• Annual: $2,697 (up from $2,597)
Sign up annually by December 31st.
Get a free 1-on-1 with me.
Go to nextleveltableau.com
36 hours left to lock in 2024 prices. Forever.
• Monthly: $329 (up from $297)
• Quarterly: $899 (up from $840)
• Annual: $2,697 (up from $2,597)
Sign up annually by December 31st.
Get a free 1-on-1 with me.
Go to nextleveltableau.com
December 30, 2024 at 1:03 PM
"I wish I paid more for Tableau training" - Said no one ever.
36 hours left to lock in 2024 prices. Forever.
• Monthly: $329 (up from $297)
• Quarterly: $899 (up from $840)
• Annual: $2,697 (up from $2,597)
Sign up annually by December 31st.
Get a free 1-on-1 with me.
Go to nextleveltableau.com
36 hours left to lock in 2024 prices. Forever.
• Monthly: $329 (up from $297)
• Quarterly: $899 (up from $840)
• Annual: $2,697 (up from $2,597)
Sign up annually by December 31st.
Get a free 1-on-1 with me.
Go to nextleveltableau.com
296 Tableau users upgraded their skills this month for FREE. Your turn. Merry Christmas! 🎁
The NLT Starter Kit includes 6 premium videos to boost your Tableau skills.
No catch. No cost. Just results.
🎄 Grab yours: starter.nextleveltableau.com/
What's the best free resource you used in 2024? 👇
The NLT Starter Kit includes 6 premium videos to boost your Tableau skills.
No catch. No cost. Just results.
🎄 Grab yours: starter.nextleveltableau.com/
What's the best free resource you used in 2024? 👇
December 25, 2024 at 1:05 PM
296 Tableau users upgraded their skills this month for FREE. Your turn. Merry Christmas! 🎁
The NLT Starter Kit includes 6 premium videos to boost your Tableau skills.
No catch. No cost. Just results.
🎄 Grab yours: starter.nextleveltableau.com/
What's the best free resource you used in 2024? 👇
The NLT Starter Kit includes 6 premium videos to boost your Tableau skills.
No catch. No cost. Just results.
🎄 Grab yours: starter.nextleveltableau.com/
What's the best free resource you used in 2024? 👇
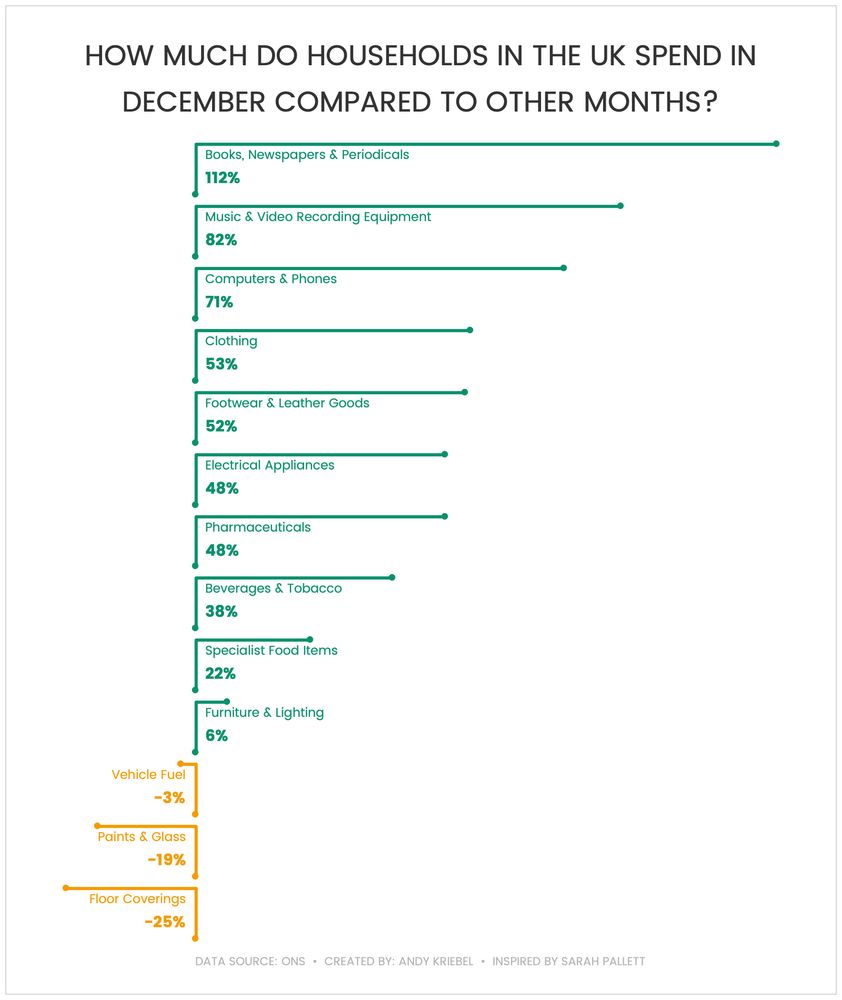
Have I invented a new chart type? Map Layers in Tableau open up endless possibilities.
Here's an L-shaped bar chart I built for #MakeoverMonday week 52.
Check out my TP profile for the workbook.
Here's an L-shaped bar chart I built for #MakeoverMonday week 52.
Check out my TP profile for the workbook.
December 23, 2024 at 8:26 PM
Have I invented a new chart type? Map Layers in Tableau open up endless possibilities.
Here's an L-shaped bar chart I built for #MakeoverMonday week 52.
Check out my TP profile for the workbook.
Here's an L-shaped bar chart I built for #MakeoverMonday week 52.
Check out my TP profile for the workbook.
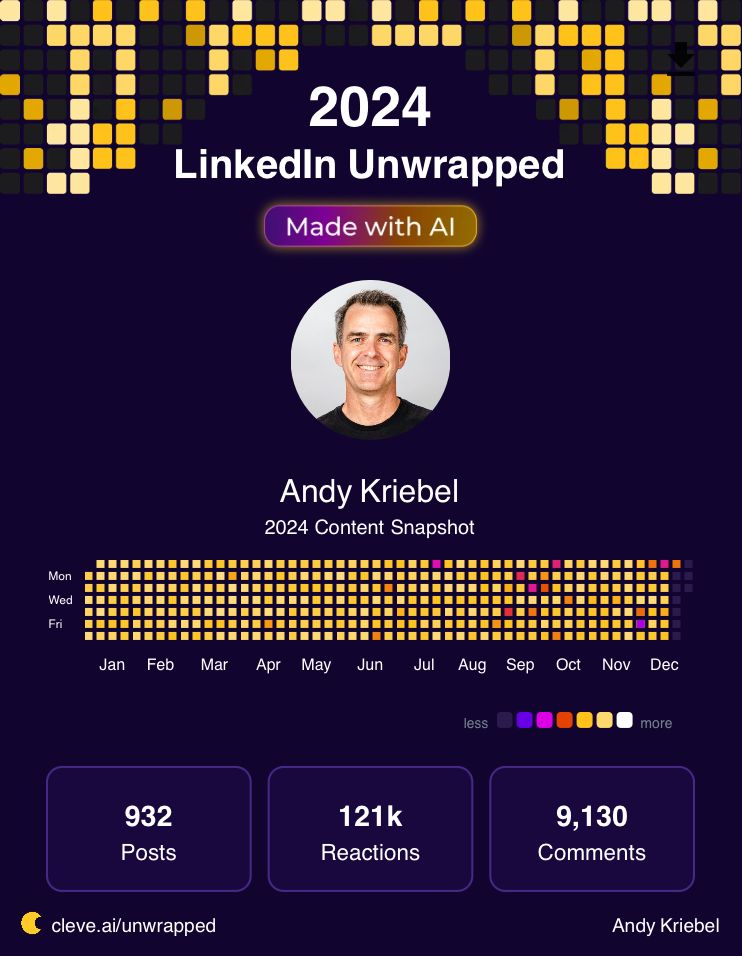
My content strategy for 2024 was simple: write a lot and give tons away (including 129 tutorials and guides).
Would you be up for a webinar about my content creation process?
Would you be up for a webinar about my content creation process?
December 23, 2024 at 4:10 PM
My content strategy for 2024 was simple: write a lot and give tons away (including 129 tutorials and guides).
Would you be up for a webinar about my content creation process?
Would you be up for a webinar about my content creation process?
My content strategy for 2024 was simple: write a lot and give tons away (including 129 tutorials and guides).
Would you be up for a webinar about my content creation process?
Would you be up for a webinar about my content creation process?
December 23, 2024 at 4:10 PM
My content strategy for 2024 was simple: write a lot and give tons away (including 129 tutorials and guides).
Would you be up for a webinar about my content creation process?
Would you be up for a webinar about my content creation process?
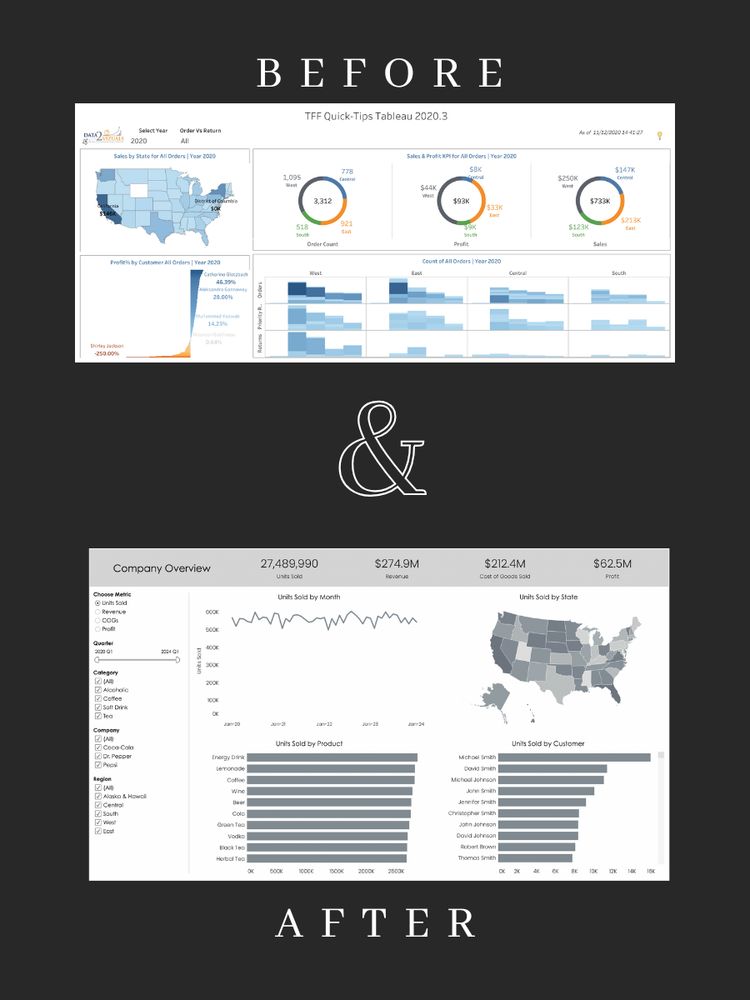
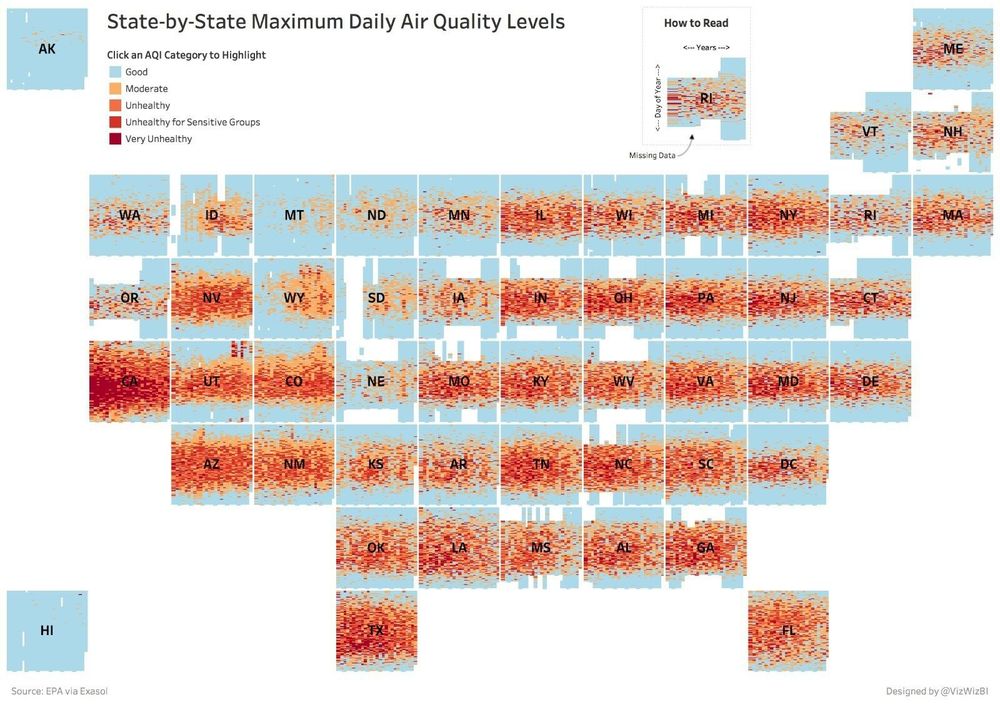
460,000 data points. One chart. Here's how I did it. ✔️
1. Sample the data strategically
2. Build a variety of chart types
3. Iterate on promising designs
4. Select the best approach
5. Import full dataset
6. Polish and publish
The beauty?
This process works for any dataset size.
1. Sample the data strategically
2. Build a variety of chart types
3. Iterate on promising designs
4. Select the best approach
5. Import full dataset
6. Polish and publish
The beauty?
This process works for any dataset size.
December 22, 2024 at 4:03 PM
460,000 data points. One chart. Here's how I did it. ✔️
1. Sample the data strategically
2. Build a variety of chart types
3. Iterate on promising designs
4. Select the best approach
5. Import full dataset
6. Polish and publish
The beauty?
This process works for any dataset size.
1. Sample the data strategically
2. Build a variety of chart types
3. Iterate on promising designs
4. Select the best approach
5. Import full dataset
6. Polish and publish
The beauty?
This process works for any dataset size.
Inspired by Nicholas Lea-Trengrouse's custom calendar visual in PBI, I've rebuilt it in Tableau.
No extensions required. I think you'll love the trick I did with the title so that you can't click on it.
Get the workbook -> public.tableau.com/app/profile/...
No extensions required. I think you'll love the trick I did with the title so that you can't click on it.
Get the workbook -> public.tableau.com/app/profile/...
December 20, 2024 at 2:28 PM
Inspired by Nicholas Lea-Trengrouse's custom calendar visual in PBI, I've rebuilt it in Tableau.
No extensions required. I think you'll love the trick I did with the title so that you can't click on it.
Get the workbook -> public.tableau.com/app/profile/...
No extensions required. I think you'll love the trick I did with the title so that you can't click on it.
Get the workbook -> public.tableau.com/app/profile/...
You data is gold. Yet, you aren't investing in both Tableau 𝗔𝗡𝗗 Power BI to unlock its value.
Getting value from your data comes at a cost.
But not investing costs you even more.
Together, they can transform how you understand and act on your data.
What’s the price of missed insights?
Getting value from your data comes at a cost.
But not investing costs you even more.
Together, they can transform how you understand and act on your data.
What’s the price of missed insights?

December 18, 2024 at 7:00 PM
You data is gold. Yet, you aren't investing in both Tableau 𝗔𝗡𝗗 Power BI to unlock its value.
Getting value from your data comes at a cost.
But not investing costs you even more.
Together, they can transform how you understand and act on your data.
What’s the price of missed insights?
Getting value from your data comes at a cost.
But not investing costs you even more.
Together, they can transform how you understand and act on your data.
What’s the price of missed insights?
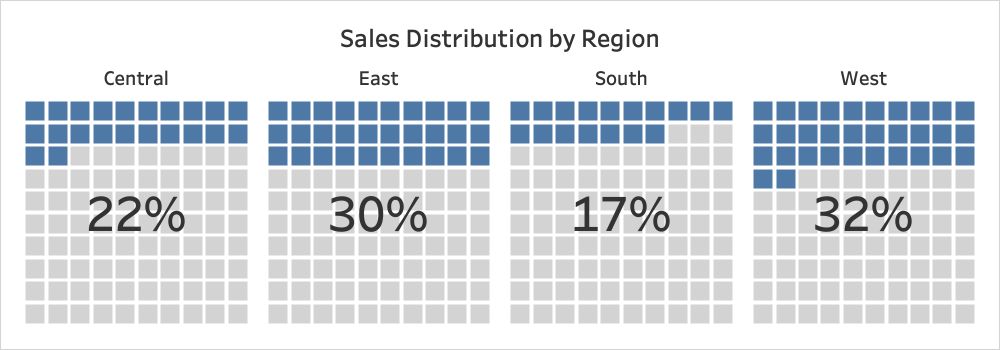
I've cracked the code to perfect waffle charts.
No more complex calculations or misaligned elements.
The magic? Map layers.
Thye give you total control.
Your labels will always align perfectly.
Your charts will look professional every time.
Complete tutorial here: www.vizwiz.com/2024/12/waff...
No more complex calculations or misaligned elements.
The magic? Map layers.
Thye give you total control.
Your labels will always align perfectly.
Your charts will look professional every time.
Complete tutorial here: www.vizwiz.com/2024/12/waff...
December 17, 2024 at 8:48 PM
I've cracked the code to perfect waffle charts.
No more complex calculations or misaligned elements.
The magic? Map layers.
Thye give you total control.
Your labels will always align perfectly.
Your charts will look professional every time.
Complete tutorial here: www.vizwiz.com/2024/12/waff...
No more complex calculations or misaligned elements.
The magic? Map layers.
Thye give you total control.
Your labels will always align perfectly.
Your charts will look professional every time.
Complete tutorial here: www.vizwiz.com/2024/12/waff...
Stop struggling with Tableau tutorials that don’t deliver results.
My FREE Next-Level Tableau Starter Kit changes that.
No fluff. No complexity.
Just step-by-step guidance you can apply today.
👉 Get instant access to the free starter kit: starter.nextleveltableau.com
My FREE Next-Level Tableau Starter Kit changes that.
No fluff. No complexity.
Just step-by-step guidance you can apply today.
👉 Get instant access to the free starter kit: starter.nextleveltableau.com
December 16, 2024 at 10:04 PM
Stop struggling with Tableau tutorials that don’t deliver results.
My FREE Next-Level Tableau Starter Kit changes that.
No fluff. No complexity.
Just step-by-step guidance you can apply today.
👉 Get instant access to the free starter kit: starter.nextleveltableau.com
My FREE Next-Level Tableau Starter Kit changes that.
No fluff. No complexity.
Just step-by-step guidance you can apply today.
👉 Get instant access to the free starter kit: starter.nextleveltableau.com
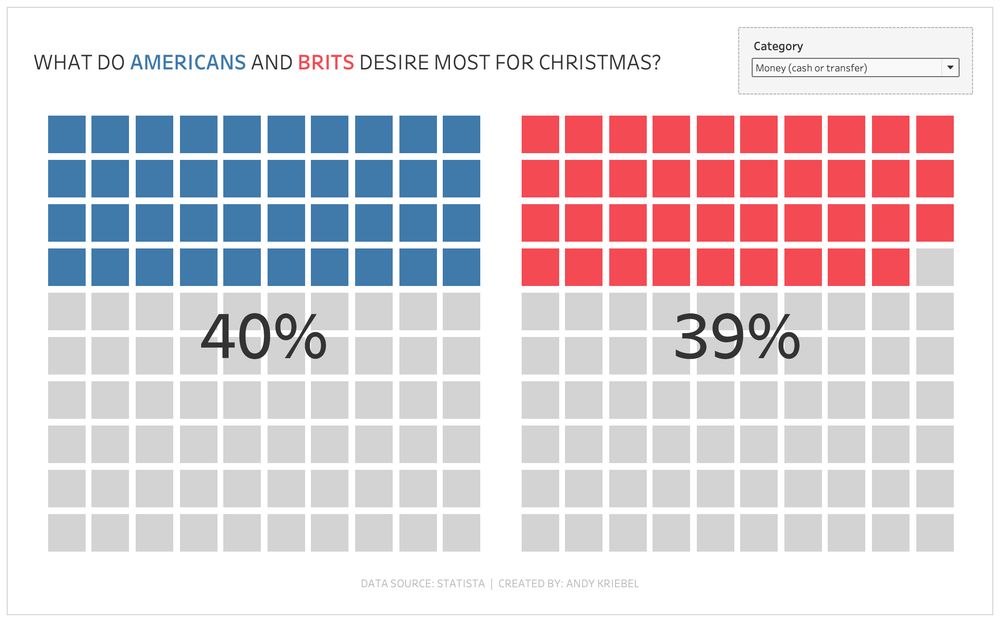
I'm just now realizing the power of map layers for building charts. It's so much easier to build a perfect waffle chart.
Should I create a tutorial for you to follow along?
This is my viz for #MakeoverMonday week 48.
Viz → public.tableau.com/app/profile/...
Should I create a tutorial for you to follow along?
This is my viz for #MakeoverMonday week 48.
Viz → public.tableau.com/app/profile/...
December 16, 2024 at 11:16 AM
I'm just now realizing the power of map layers for building charts. It's so much easier to build a perfect waffle chart.
Should I create a tutorial for you to follow along?
This is my viz for #MakeoverMonday week 48.
Viz → public.tableau.com/app/profile/...
Should I create a tutorial for you to follow along?
This is my viz for #MakeoverMonday week 48.
Viz → public.tableau.com/app/profile/...
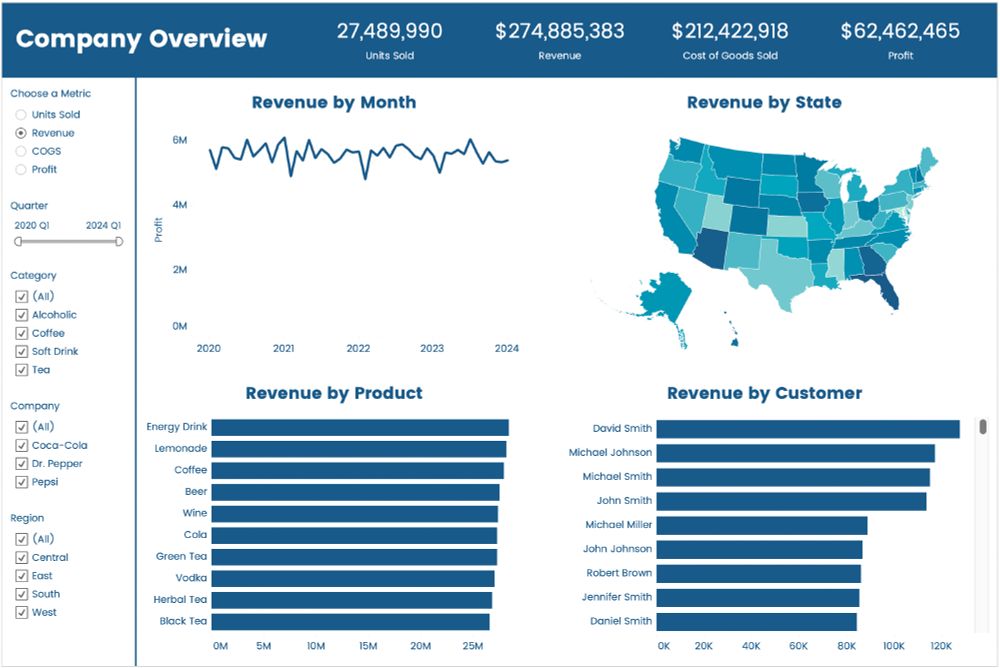
Do this and you’ll be a better designer.
Follow Jennifer Eneh
I absolutely love this!
- Easy to understand
- Beautiful use of color
- Ideal use of whitespace
- Every pixel has a purpose
- Can be used as a template for your data
- Includes all of the context you could need
What do you like?
Follow Jennifer Eneh
I absolutely love this!
- Easy to understand
- Beautiful use of color
- Ideal use of whitespace
- Every pixel has a purpose
- Can be used as a template for your data
- Includes all of the context you could need
What do you like?
December 13, 2024 at 5:15 PM
Do this and you’ll be a better designer.
Follow Jennifer Eneh
I absolutely love this!
- Easy to understand
- Beautiful use of color
- Ideal use of whitespace
- Every pixel has a purpose
- Can be used as a template for your data
- Includes all of the context you could need
What do you like?
Follow Jennifer Eneh
I absolutely love this!
- Easy to understand
- Beautiful use of color
- Ideal use of whitespace
- Every pixel has a purpose
- Can be used as a template for your data
- Includes all of the context you could need
What do you like?
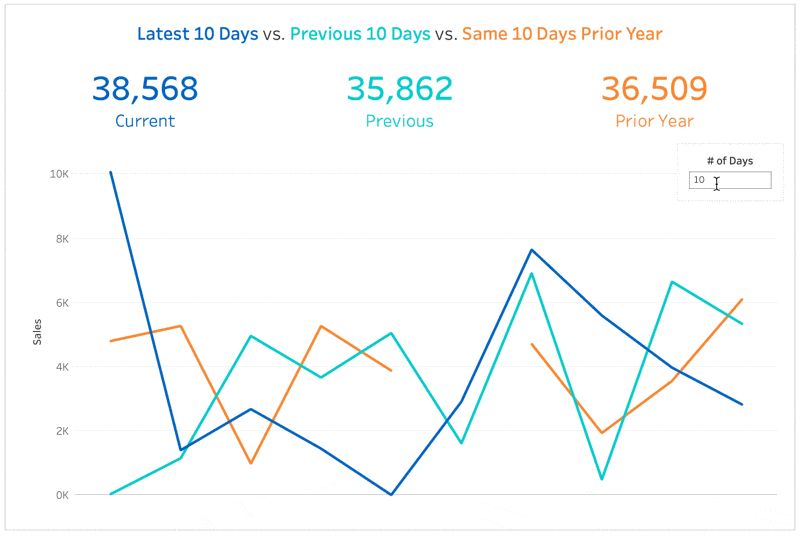
"Your dates comparison are wrong."
That's what your boss says after you present your sales analysis.
Learn how to align:
• Latest N days
• Previous N days
• Same N days prior year
It's not very straightforward in Tableau.
Download the Workbook -> public.tableau.com/app/profile/...
That's what your boss says after you present your sales analysis.
Learn how to align:
• Latest N days
• Previous N days
• Same N days prior year
It's not very straightforward in Tableau.
Download the Workbook -> public.tableau.com/app/profile/...
December 12, 2024 at 5:27 PM
"Your dates comparison are wrong."
That's what your boss says after you present your sales analysis.
Learn how to align:
• Latest N days
• Previous N days
• Same N days prior year
It's not very straightforward in Tableau.
Download the Workbook -> public.tableau.com/app/profile/...
That's what your boss says after you present your sales analysis.
Learn how to align:
• Latest N days
• Previous N days
• Same N days prior year
It's not very straightforward in Tableau.
Download the Workbook -> public.tableau.com/app/profile/...
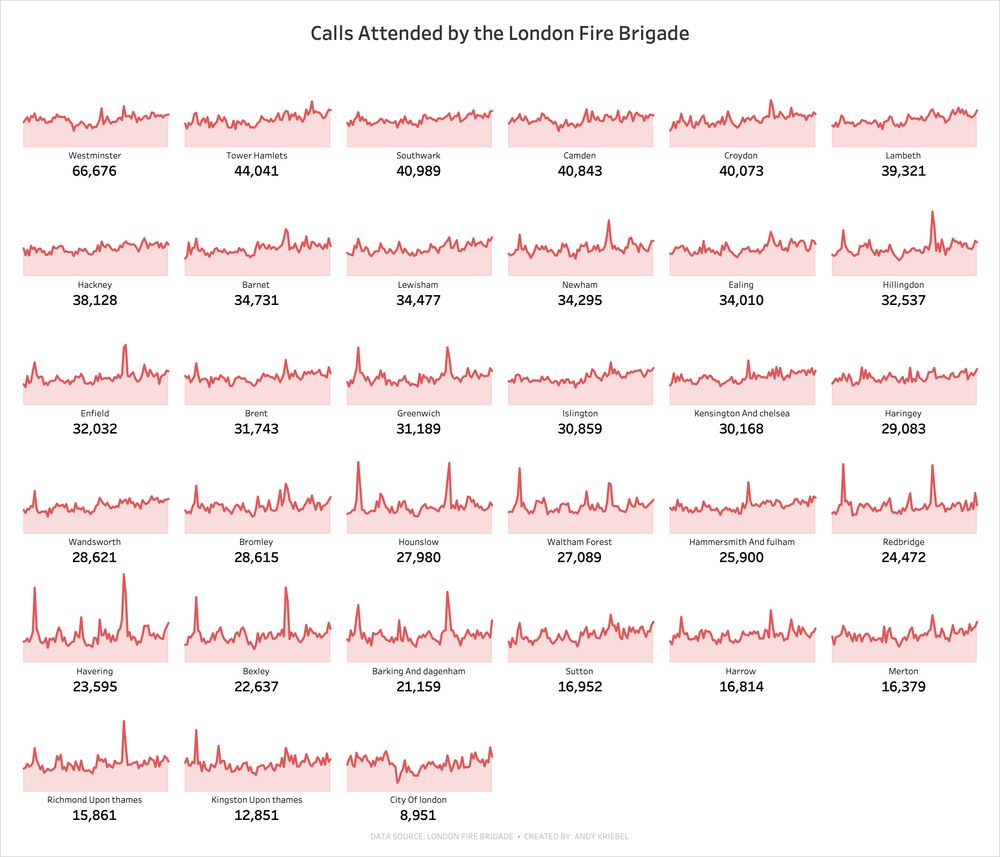
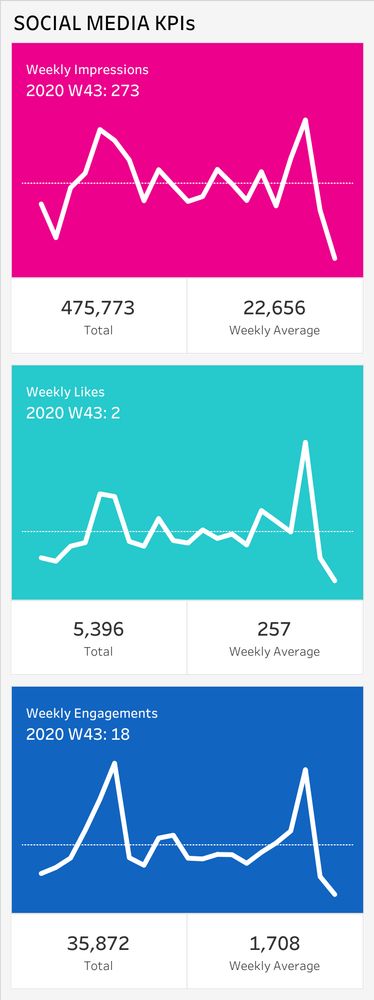
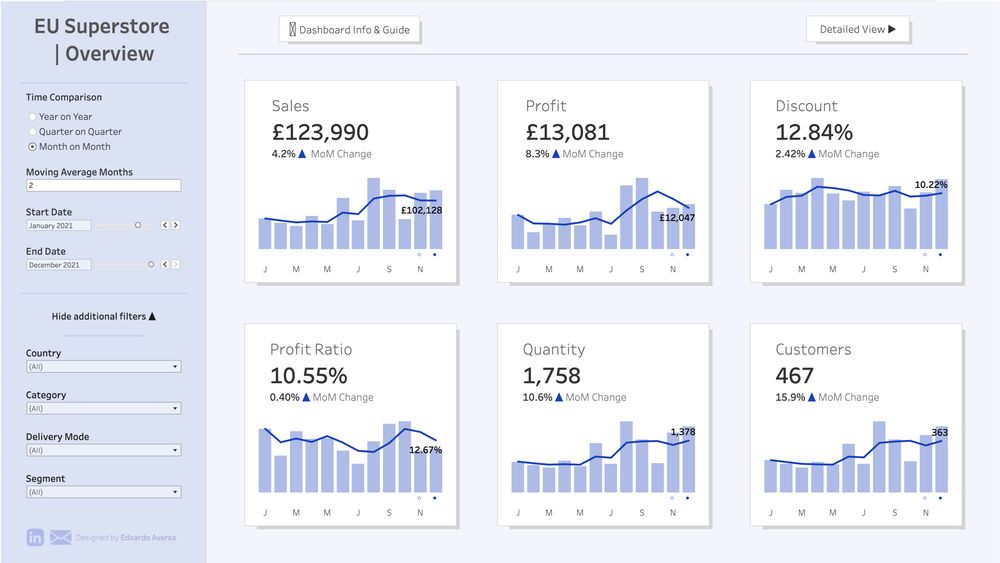
Practing mobile design forces you to make simple charts. Here's what makes this work.
• Small multiples for space
• BANs to summarize the data
• Large fonts to ensure readability
• Colored sections for each metric
• Line charts to show trends over time
What do you like? What could be better?
• Small multiples for space
• BANs to summarize the data
• Large fonts to ensure readability
• Colored sections for each metric
• Line charts to show trends over time
What do you like? What could be better?
December 11, 2024 at 5:00 PM
Practing mobile design forces you to make simple charts. Here's what makes this work.
• Small multiples for space
• BANs to summarize the data
• Large fonts to ensure readability
• Colored sections for each metric
• Line charts to show trends over time
What do you like? What could be better?
• Small multiples for space
• BANs to summarize the data
• Large fonts to ensure readability
• Colored sections for each metric
• Line charts to show trends over time
What do you like? What could be better?
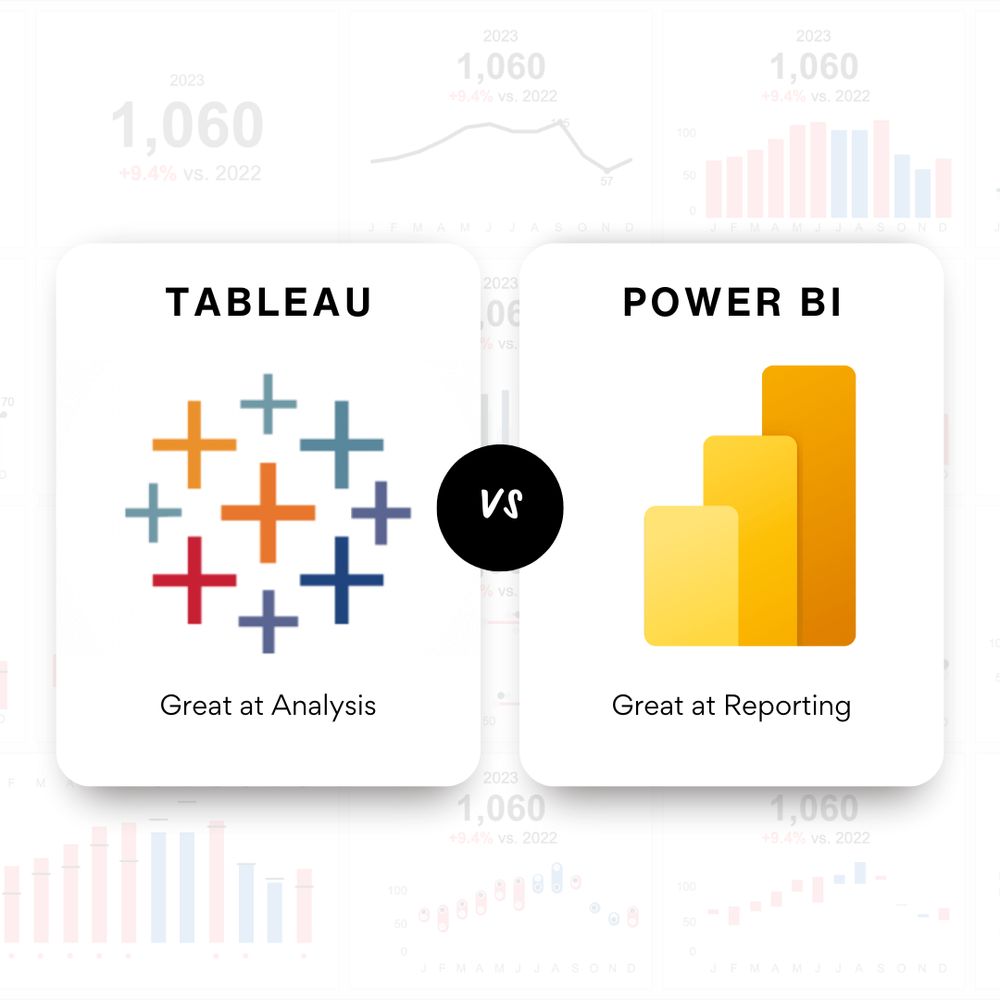
Tableau or Power BI?
There's your first mistake.
It's not "or".
It's "and".
Stop thinking you have to pick one or the other.
Use both.
Tableau is great for analysis.
Power BI is great for reporting.
Tableau and Power BI are two sides of one coin.
Why not use both?
There's your first mistake.
It's not "or".
It's "and".
Stop thinking you have to pick one or the other.
Use both.
Tableau is great for analysis.
Power BI is great for reporting.
Tableau and Power BI are two sides of one coin.
Why not use both?
December 11, 2024 at 1:15 PM
Tableau or Power BI?
There's your first mistake.
It's not "or".
It's "and".
Stop thinking you have to pick one or the other.
Use both.
Tableau is great for analysis.
Power BI is great for reporting.
Tableau and Power BI are two sides of one coin.
Why not use both?
There's your first mistake.
It's not "or".
It's "and".
Stop thinking you have to pick one or the other.
Use both.
Tableau is great for analysis.
Power BI is great for reporting.
Tableau and Power BI are two sides of one coin.
Why not use both?
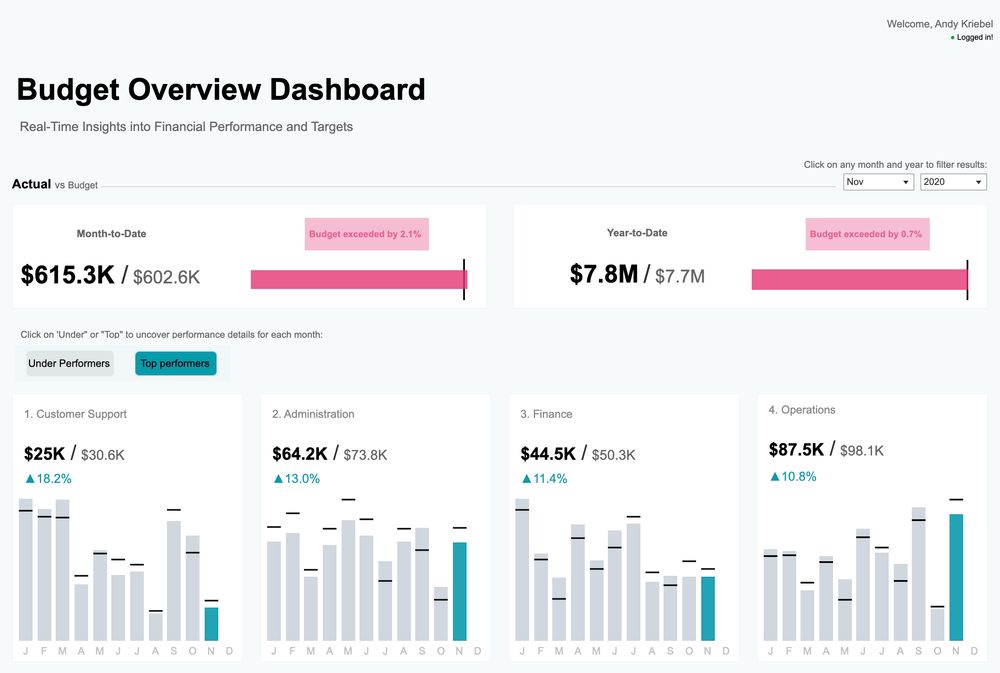
Businesses need simple, effective, easy to understand KPI dashboards. They need to be...
- Beautifully designed
- Easy to understand
- Actionable
- Flexible
What do you like most about this dashboard from Edoardo Aversa?
- Beautifully designed
- Easy to understand
- Actionable
- Flexible
What do you like most about this dashboard from Edoardo Aversa?
December 10, 2024 at 9:30 PM
Businesses need simple, effective, easy to understand KPI dashboards. They need to be...
- Beautifully designed
- Easy to understand
- Actionable
- Flexible
What do you like most about this dashboard from Edoardo Aversa?
- Beautifully designed
- Easy to understand
- Actionable
- Flexible
What do you like most about this dashboard from Edoardo Aversa?
Free Webinar - Build a top-notch Tableau Public profile that will get you notice.
Want to come?
Register at webinar.nextleveltableau.com
Want to come?
Register at webinar.nextleveltableau.com

December 9, 2024 at 7:02 PM
Free Webinar - Build a top-notch Tableau Public profile that will get you notice.
Want to come?
Register at webinar.nextleveltableau.com
Want to come?
Register at webinar.nextleveltableau.com
It doesn't need to take more than one hour to create a useful, simple, interactive dashboard.
Want to learn how? DM me "interactive"
Check it out → public.tableau.com/app/profile/...
Want to learn how? DM me "interactive"
Check it out → public.tableau.com/app/profile/...
December 5, 2024 at 2:48 PM
It doesn't need to take more than one hour to create a useful, simple, interactive dashboard.
Want to learn how? DM me "interactive"
Check it out → public.tableau.com/app/profile/...
Want to learn how? DM me "interactive"
Check it out → public.tableau.com/app/profile/...
Join Aria Voron and me for our FREE webinar "Boost Your Personal Brand Today with Tableau Public"
🗓️ December 10
⏰ 7:30pm GMT / 2:30pm ET
🔗 Register now: webinar.nextleveltableau.com
P.S. When you sign up, I'll send you 10 Tableau Public profiles you should follow today.
🗓️ December 10
⏰ 7:30pm GMT / 2:30pm ET
🔗 Register now: webinar.nextleveltableau.com
P.S. When you sign up, I'll send you 10 Tableau Public profiles you should follow today.

December 3, 2024 at 8:58 PM
Join Aria Voron and me for our FREE webinar "Boost Your Personal Brand Today with Tableau Public"
🗓️ December 10
⏰ 7:30pm GMT / 2:30pm ET
🔗 Register now: webinar.nextleveltableau.com
P.S. When you sign up, I'll send you 10 Tableau Public profiles you should follow today.
🗓️ December 10
⏰ 7:30pm GMT / 2:30pm ET
🔗 Register now: webinar.nextleveltableau.com
P.S. When you sign up, I'll send you 10 Tableau Public profiles you should follow today.
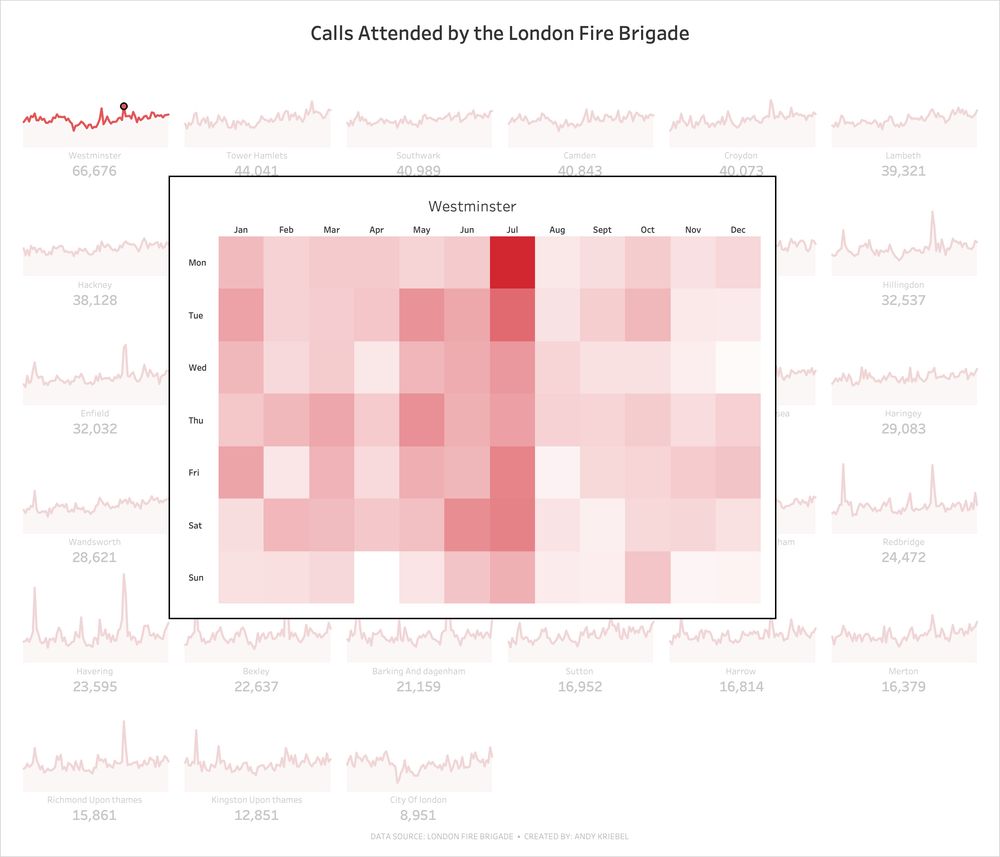
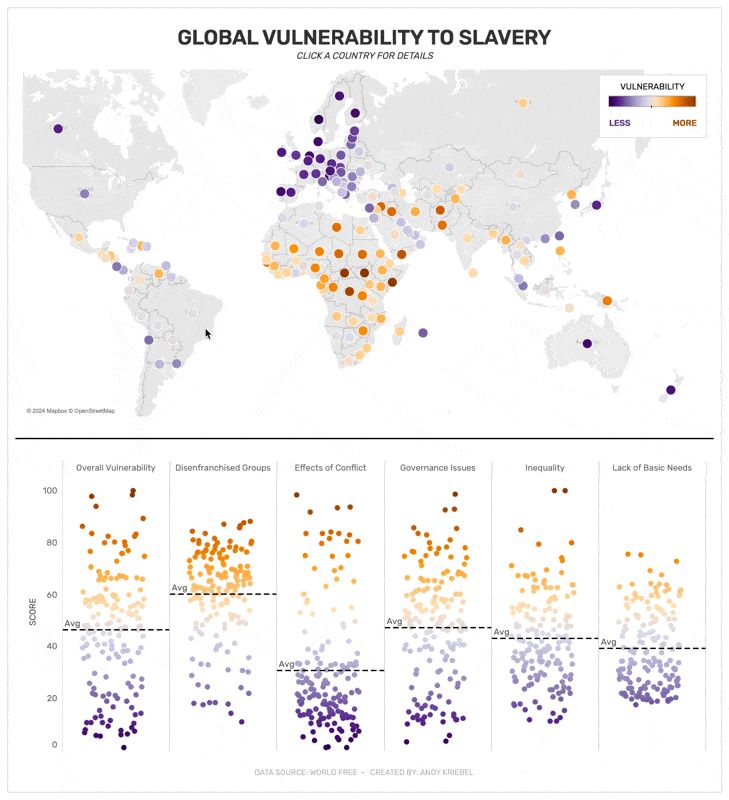
I guarantee that if you consistently participate in #MakeoverMonday your skills will improve dramatically. Here's what I practiced today:
1. Jitter plot
2. Highlighting a mark with a actions
3. A pop up with Dynamic Zone Visibility
What do you like best?
public.tableau.com/app/profile/...
1. Jitter plot
2. Highlighting a mark with a actions
3. A pop up with Dynamic Zone Visibility
What do you like best?
public.tableau.com/app/profile/...
December 2, 2024 at 12:47 PM
I guarantee that if you consistently participate in #MakeoverMonday your skills will improve dramatically. Here's what I practiced today:
1. Jitter plot
2. Highlighting a mark with a actions
3. A pop up with Dynamic Zone Visibility
What do you like best?
public.tableau.com/app/profile/...
1. Jitter plot
2. Highlighting a mark with a actions
3. A pop up with Dynamic Zone Visibility
What do you like best?
public.tableau.com/app/profile/...
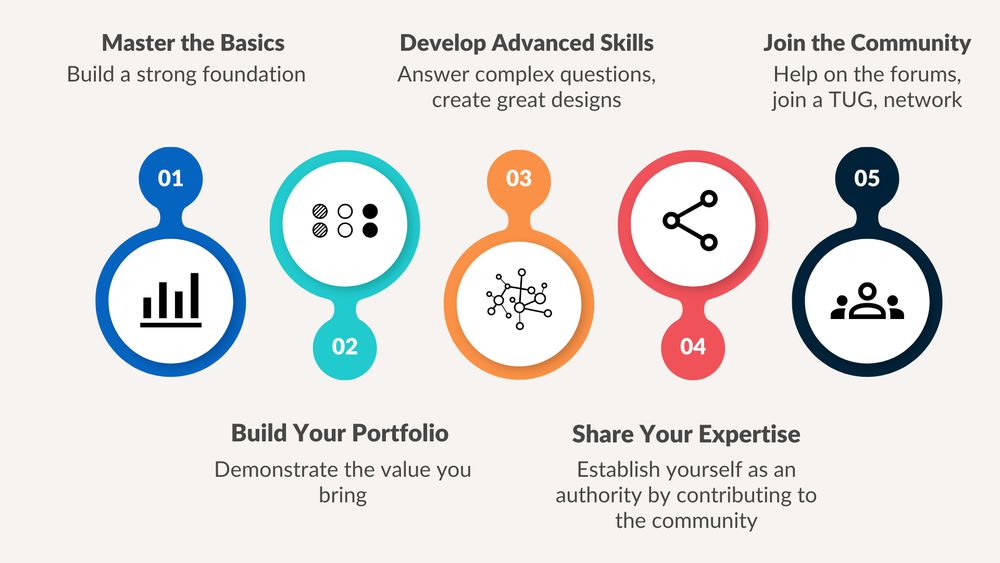
Have you ever looked at Tableau Visionaries and thought, “How can I get there?” Every Visionary started right where you are today. Here’s how you can start creatting your path to Tableau greatness.
mailchi.mp/nextleveltab...
mailchi.mp/nextleveltab...
November 29, 2024 at 1:00 PM
Have you ever looked at Tableau Visionaries and thought, “How can I get there?” Every Visionary started right where you are today. Here’s how you can start creatting your path to Tableau greatness.
mailchi.mp/nextleveltab...
mailchi.mp/nextleveltab...