


NCAA DataSauce
@ncaadatasauce.bsky.social
Visualizing NCAA Division 1 Hockey
As seen on: Princeton Tiger Hockey
As seen on: Princeton Tiger Hockey
ECAC Final Four: Statistical Breakdown (Part 1)📊🏒
The final four teams in ECAC face off in Lake Placid for the title. Here’s how they compare in:
🔥 Goals scored vs. allowed over time
🎯 Shot generation & suppression
📈 Per-game trends in scoring & shots
#ECAC #CollegeHockey #DataViz
The final four teams in ECAC face off in Lake Placid for the title. Here’s how they compare in:
🔥 Goals scored vs. allowed over time
🎯 Shot generation & suppression
📈 Per-game trends in scoring & shots
#ECAC #CollegeHockey #DataViz


March 20, 2025 at 2:08 AM
ECAC Final Four: Statistical Breakdown (Part 1)📊🏒
The final four teams in ECAC face off in Lake Placid for the title. Here’s how they compare in:
🔥 Goals scored vs. allowed over time
🎯 Shot generation & suppression
📈 Per-game trends in scoring & shots
#ECAC #CollegeHockey #DataViz
The final four teams in ECAC face off in Lake Placid for the title. Here’s how they compare in:
🔥 Goals scored vs. allowed over time
🎯 Shot generation & suppression
📈 Per-game trends in scoring & shots
#ECAC #CollegeHockey #DataViz
Hockey East Final Four: Statistical Breakdown (Part 3) 📊🏒
This final set of visuals highlights key depth and special teams trends:
🔢 Production by line—where are teams getting offense?
🚨 Penalty trends—who’s headed to the box most?
⚡ Special teams efficiency
#HockeyEast #CollegeHockey #DataViz
This final set of visuals highlights key depth and special teams trends:
🔢 Production by line—where are teams getting offense?
🚨 Penalty trends—who’s headed to the box most?
⚡ Special teams efficiency
#HockeyEast #CollegeHockey #DataViz


March 19, 2025 at 2:19 PM
Hockey East Final Four: Statistical Breakdown (Part 3) 📊🏒
This final set of visuals highlights key depth and special teams trends:
🔢 Production by line—where are teams getting offense?
🚨 Penalty trends—who’s headed to the box most?
⚡ Special teams efficiency
#HockeyEast #CollegeHockey #DataViz
This final set of visuals highlights key depth and special teams trends:
🔢 Production by line—where are teams getting offense?
🚨 Penalty trends—who’s headed to the box most?
⚡ Special teams efficiency
#HockeyEast #CollegeHockey #DataViz
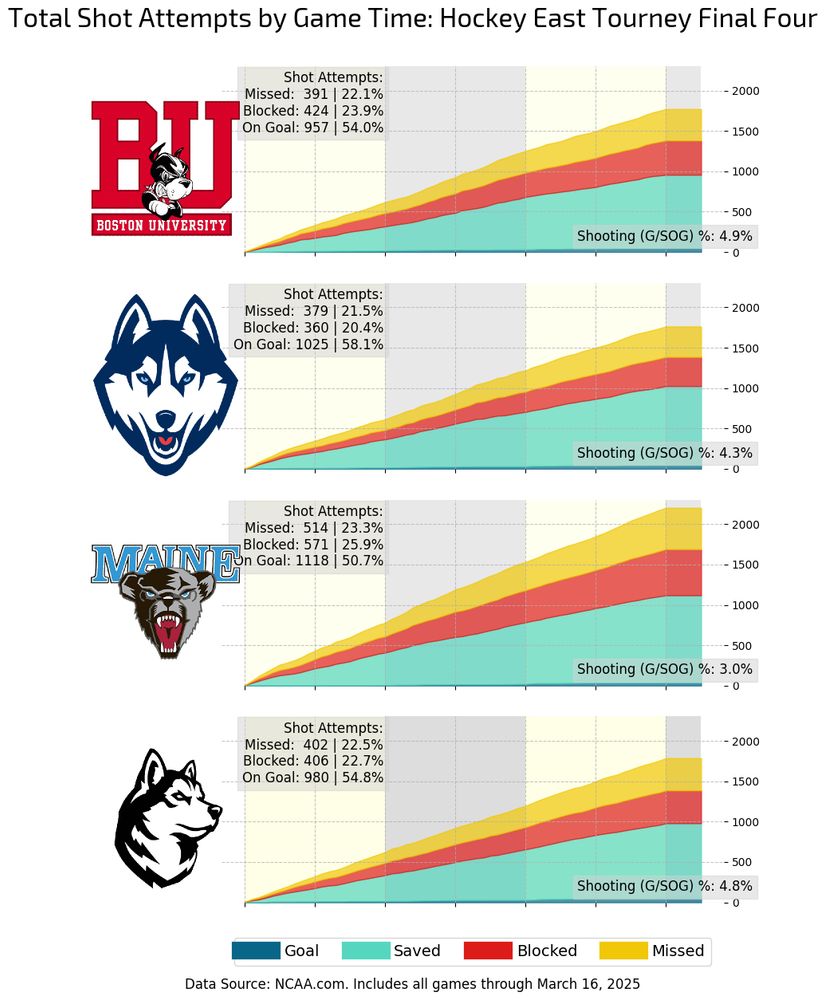
Hockey East Final Four: Statistical Breakdown (Part 2) 📊🏒
This set of visuals examines key details beyond simple goal and shot totals:
🚀 Shot attempt breakdowns—missed, blocked, saved, and on net
🛑 Shot-blocking trends
🔄 Faceoff outcomes—who’s owns the draw?
#HockeyEast #CollegeHockey #DataViz
This set of visuals examines key details beyond simple goal and shot totals:
🚀 Shot attempt breakdowns—missed, blocked, saved, and on net
🛑 Shot-blocking trends
🔄 Faceoff outcomes—who’s owns the draw?
#HockeyEast #CollegeHockey #DataViz


March 19, 2025 at 2:17 PM
Hockey East Final Four: Statistical Breakdown (Part 2) 📊🏒
This set of visuals examines key details beyond simple goal and shot totals:
🚀 Shot attempt breakdowns—missed, blocked, saved, and on net
🛑 Shot-blocking trends
🔄 Faceoff outcomes—who’s owns the draw?
#HockeyEast #CollegeHockey #DataViz
This set of visuals examines key details beyond simple goal and shot totals:
🚀 Shot attempt breakdowns—missed, blocked, saved, and on net
🛑 Shot-blocking trends
🔄 Faceoff outcomes—who’s owns the draw?
#HockeyEast #CollegeHockey #DataViz
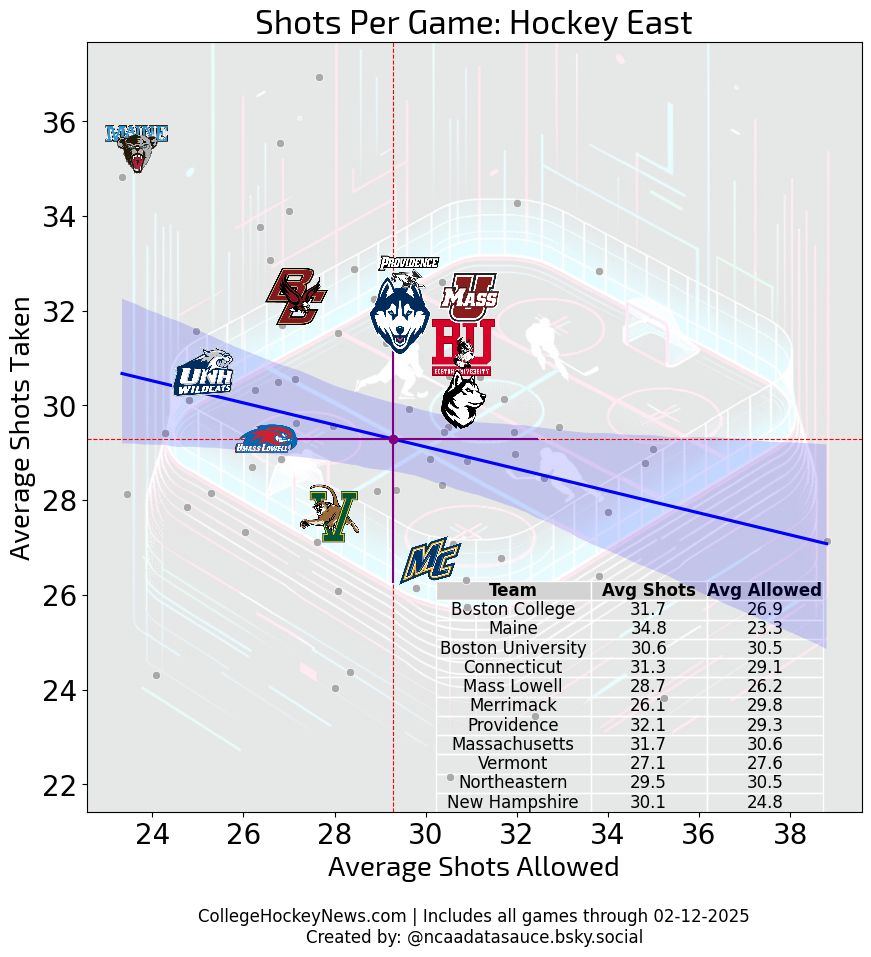
Hockey East Final Four: Statistical Breakdown (Part 1 of 3)📊🏒
The final four teams in Hockey East—BU, UConn, Maine, and Northeastern—face off for the title. Here’s how they compare in:
📈 Per-game trends in scoring & shots
Which team’s numbers stand out?
#HockeyEast #CollegeHockey #DataViz
The final four teams in Hockey East—BU, UConn, Maine, and Northeastern—face off for the title. Here’s how they compare in:
📈 Per-game trends in scoring & shots
Which team’s numbers stand out?
#HockeyEast #CollegeHockey #DataViz


March 19, 2025 at 2:13 PM
Hockey East Final Four: Statistical Breakdown (Part 1 of 3)📊🏒
The final four teams in Hockey East—BU, UConn, Maine, and Northeastern—face off for the title. Here’s how they compare in:
📈 Per-game trends in scoring & shots
Which team’s numbers stand out?
#HockeyEast #CollegeHockey #DataViz
The final four teams in Hockey East—BU, UConn, Maine, and Northeastern—face off for the title. Here’s how they compare in:
📈 Per-game trends in scoring & shots
Which team’s numbers stand out?
#HockeyEast #CollegeHockey #DataViz
B1G Ten: High-Impact Goals
How do Big Ten teams perform in key moments? These charts break down:
🔥 Goals scored & allowed in the first and last 2 minutes
⚡ Quick response goals (within 2 minutes of another goal)
As the regular season closes which teams will handle the pressure? #B1GHockey #DataViz
How do Big Ten teams perform in key moments? These charts break down:
🔥 Goals scored & allowed in the first and last 2 minutes
⚡ Quick response goals (within 2 minutes of another goal)
As the regular season closes which teams will handle the pressure? #B1GHockey #DataViz


February 27, 2025 at 6:27 PM
B1G Ten: High-Impact Goals
How do Big Ten teams perform in key moments? These charts break down:
🔥 Goals scored & allowed in the first and last 2 minutes
⚡ Quick response goals (within 2 minutes of another goal)
As the regular season closes which teams will handle the pressure? #B1GHockey #DataViz
How do Big Ten teams perform in key moments? These charts break down:
🔥 Goals scored & allowed in the first and last 2 minutes
⚡ Quick response goals (within 2 minutes of another goal)
As the regular season closes which teams will handle the pressure? #B1GHockey #DataViz
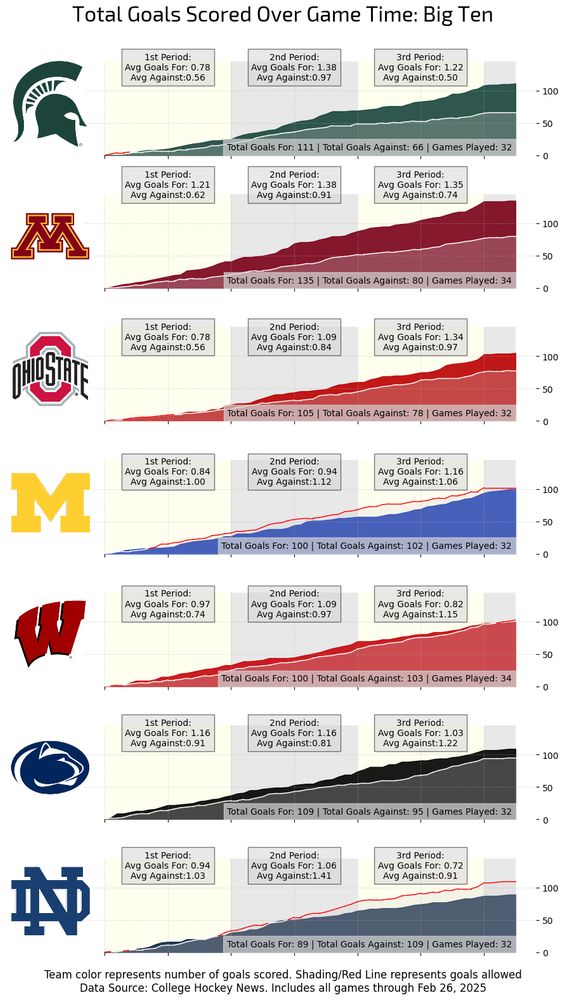
Big Ten Hockey: Final Regular Season Weekend Stats 📊🏒
As teams fight for positioning ahead of the Big Ten Tournament, here’s how they stack up in:
🔥 Goals Scored vs. Allowed
🎯 Goal & Shot Totals by Period
#B1GHockey #CollegeHockey #HockeyAnalysis
As teams fight for positioning ahead of the Big Ten Tournament, here’s how they stack up in:
🔥 Goals Scored vs. Allowed
🎯 Goal & Shot Totals by Period
#B1GHockey #CollegeHockey #HockeyAnalysis


February 27, 2025 at 5:58 PM
Big Ten Hockey: Final Regular Season Weekend Stats 📊🏒
As teams fight for positioning ahead of the Big Ten Tournament, here’s how they stack up in:
🔥 Goals Scored vs. Allowed
🎯 Goal & Shot Totals by Period
#B1GHockey #CollegeHockey #HockeyAnalysis
As teams fight for positioning ahead of the Big Ten Tournament, here’s how they stack up in:
🔥 Goals Scored vs. Allowed
🎯 Goal & Shot Totals by Period
#B1GHockey #CollegeHockey #HockeyAnalysis
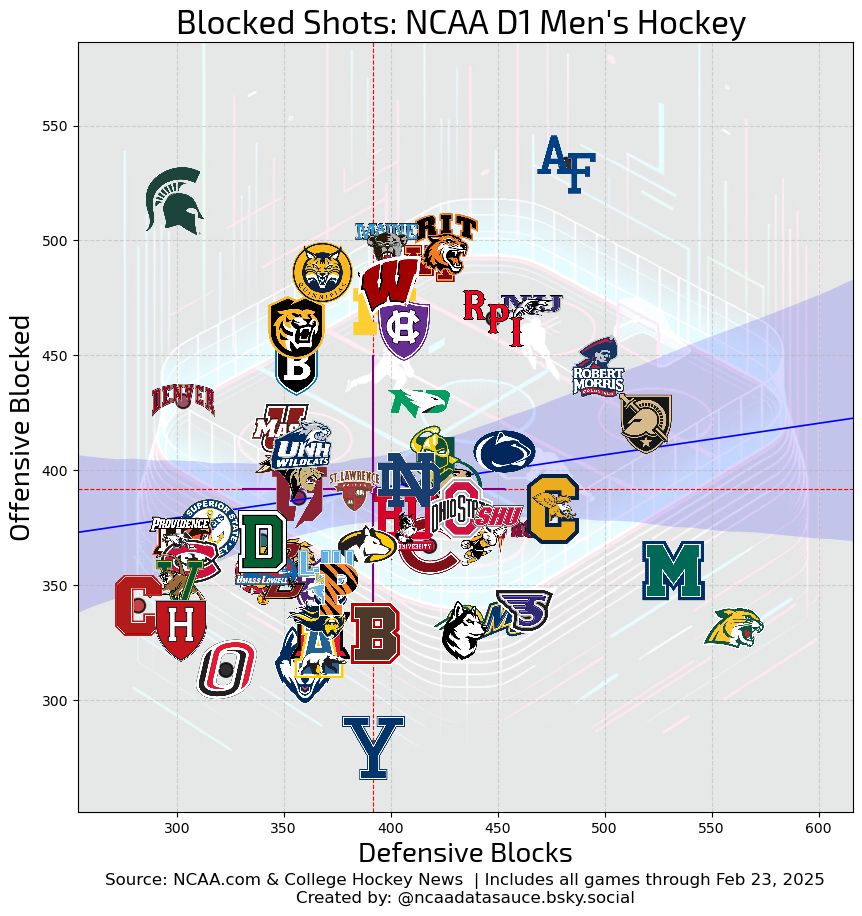
Blocked Shots🏒
📊 Who’s blocking the most shots and getting the most blocked?
🔎 How many shots actually get through per block?
🔥 Which NCAA tournament contenders are thriving in these areas?
Four visualizations break down blocked shot trends across all D1
#CollegeHockey #DataViz #HockeyAnalysis
📊 Who’s blocking the most shots and getting the most blocked?
🔎 How many shots actually get through per block?
🔥 Which NCAA tournament contenders are thriving in these areas?
Four visualizations break down blocked shot trends across all D1
#CollegeHockey #DataViz #HockeyAnalysis


February 26, 2025 at 6:17 PM
Blocked Shots🏒
📊 Who’s blocking the most shots and getting the most blocked?
🔎 How many shots actually get through per block?
🔥 Which NCAA tournament contenders are thriving in these areas?
Four visualizations break down blocked shot trends across all D1
#CollegeHockey #DataViz #HockeyAnalysis
📊 Who’s blocking the most shots and getting the most blocked?
🔎 How many shots actually get through per block?
🔥 Which NCAA tournament contenders are thriving in these areas?
Four visualizations break down blocked shot trends across all D1
#CollegeHockey #DataViz #HockeyAnalysis
How do NCAA tournament teams generate offense?
📊 Goals Over Time
🎯 Shot Attempts
🥅 Shots on Goal
Each chart tracks cumulative totals by game time, breaking down when teams score, shoot, and allow chances. Who’s dictating play, and who’s just hanging on?
#CollegeHockey #DataViz #HockeyAnalysis
📊 Goals Over Time
🎯 Shot Attempts
🥅 Shots on Goal
Each chart tracks cumulative totals by game time, breaking down when teams score, shoot, and allow chances. Who’s dictating play, and who’s just hanging on?
#CollegeHockey #DataViz #HockeyAnalysis


February 20, 2025 at 5:20 PM
How do NCAA tournament teams generate offense?
📊 Goals Over Time
🎯 Shot Attempts
🥅 Shots on Goal
Each chart tracks cumulative totals by game time, breaking down when teams score, shoot, and allow chances. Who’s dictating play, and who’s just hanging on?
#CollegeHockey #DataViz #HockeyAnalysis
📊 Goals Over Time
🎯 Shot Attempts
🥅 Shots on Goal
Each chart tracks cumulative totals by game time, breaking down when teams score, shoot, and allow chances. Who’s dictating play, and who’s just hanging on?
#CollegeHockey #DataViz #HockeyAnalysis
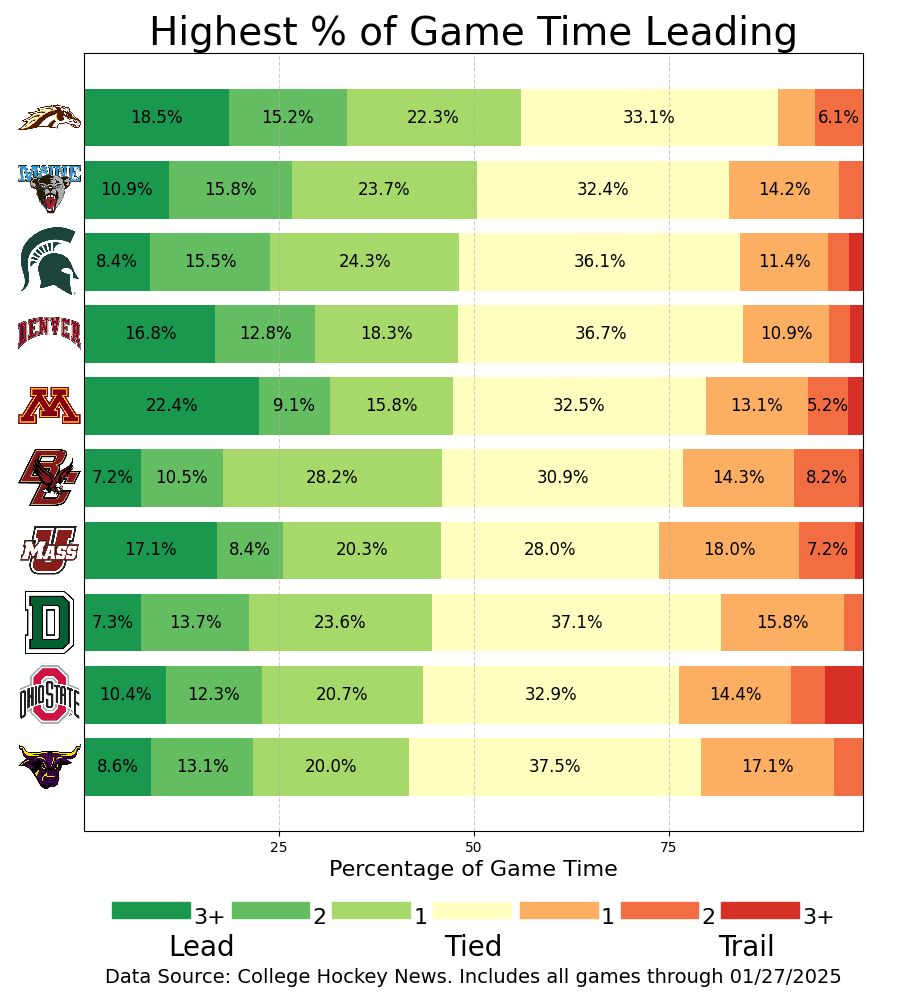
Possible NCAA tournament teams and how they control games.
Three Views:
📊 1. All Games
🏒 2. Conference Games
🌎 3. Non-Conference Games
Bars show the % of game time spent leading, tied, or trailing and margin. Who’s in control, and who’s playing from behind?
#CollegeHockey #DataViz #HockeyAnalysis
Three Views:
📊 1. All Games
🏒 2. Conference Games
🌎 3. Non-Conference Games
Bars show the % of game time spent leading, tied, or trailing and margin. Who’s in control, and who’s playing from behind?
#CollegeHockey #DataViz #HockeyAnalysis


February 20, 2025 at 2:23 AM
Possible NCAA tournament teams and how they control games.
Three Views:
📊 1. All Games
🏒 2. Conference Games
🌎 3. Non-Conference Games
Bars show the % of game time spent leading, tied, or trailing and margin. Who’s in control, and who’s playing from behind?
#CollegeHockey #DataViz #HockeyAnalysis
Three Views:
📊 1. All Games
🏒 2. Conference Games
🌎 3. Non-Conference Games
Bars show the % of game time spent leading, tied, or trailing and margin. Who’s in control, and who’s playing from behind?
#CollegeHockey #DataViz #HockeyAnalysis
These charts show how well each D-I team holds leads and erases deficits.
X-Axis: % of leads given up (higher = worse)
Y-Axis: % of comebacks (higher = better)
Three versions:
📊 All Games
🏒 Conference Games
🌎 Non-Conference Games
Who stands out to you?
#CollegeHockey #DataViz #HockeyAnalysis
X-Axis: % of leads given up (higher = worse)
Y-Axis: % of comebacks (higher = better)
Three versions:
📊 All Games
🏒 Conference Games
🌎 Non-Conference Games
Who stands out to you?
#CollegeHockey #DataViz #HockeyAnalysis


February 18, 2025 at 5:32 PM
These charts show how well each D-I team holds leads and erases deficits.
X-Axis: % of leads given up (higher = worse)
Y-Axis: % of comebacks (higher = better)
Three versions:
📊 All Games
🏒 Conference Games
🌎 Non-Conference Games
Who stands out to you?
#CollegeHockey #DataViz #HockeyAnalysis
X-Axis: % of leads given up (higher = worse)
Y-Axis: % of comebacks (higher = better)
Three versions:
📊 All Games
🏒 Conference Games
🌎 Non-Conference Games
Who stands out to you?
#CollegeHockey #DataViz #HockeyAnalysis
Hockey East: Scoring and Shots on Net
Charts include all regular season games played to date. In Cumulative total charts teams colors represent goals/shots for, shading represents total allowed.
Data courtesy of NCAA [dot] com Play by Play summaries
#NCAAHockey #HockeyVisualization
Charts include all regular season games played to date. In Cumulative total charts teams colors represent goals/shots for, shading represents total allowed.
Data courtesy of NCAA [dot] com Play by Play summaries
#NCAAHockey #HockeyVisualization


February 14, 2025 at 8:13 PM
Hockey East: Scoring and Shots on Net
Charts include all regular season games played to date. In Cumulative total charts teams colors represent goals/shots for, shading represents total allowed.
Data courtesy of NCAA [dot] com Play by Play summaries
#NCAAHockey #HockeyVisualization
Charts include all regular season games played to date. In Cumulative total charts teams colors represent goals/shots for, shading represents total allowed.
Data courtesy of NCAA [dot] com Play by Play summaries
#NCAAHockey #HockeyVisualization
Reposted by NCAA DataSauce

One of the biggest myths in sports is that the game isn’t decided on a spreadsheet.
Fact: the standings are kept on a spreadsheet.
Fact: the standings are kept on a spreadsheet.
February 14, 2025 at 6:17 PM
One of the biggest myths in sports is that the game isn’t decided on a spreadsheet.
Fact: the standings are kept on a spreadsheet.
Fact: the standings are kept on a spreadsheet.
Scoring Over Game Time in the B1G:
Team colors represent cumulative totals, shading represents total allowed.
Data courtesy of NCAA [dot] com play by play summaries
Team colors represent cumulative totals, shading represents total allowed.
Data courtesy of NCAA [dot] com play by play summaries


February 14, 2025 at 5:07 AM
Scoring Over Game Time in the B1G:
Team colors represent cumulative totals, shading represents total allowed.
Data courtesy of NCAA [dot] com play by play summaries
Team colors represent cumulative totals, shading represents total allowed.
Data courtesy of NCAA [dot] com play by play summaries
Game Balance within The B1G Ten.
The difference between overall, out of conference and in conference shows more variation than in any other conference this season.
#NCAAHockey
The difference between overall, out of conference and in conference shows more variation than in any other conference this season.
#NCAAHockey


February 13, 2025 at 11:02 PM
Game Balance within The B1G Ten.
The difference between overall, out of conference and in conference shows more variation than in any other conference this season.
#NCAAHockey
The difference between overall, out of conference and in conference shows more variation than in any other conference this season.
#NCAAHockey
Game Balance breaks down how much time teams spend leading, trailing and tied as a % of total game time.
Here is how all 64 teams in D1 #NCAAHockey shape up overall, out of conference and in conference.
Here is how all 64 teams in D1 #NCAAHockey shape up overall, out of conference and in conference.


February 13, 2025 at 10:57 PM
Game Balance breaks down how much time teams spend leading, trailing and tied as a % of total game time.
Here is how all 64 teams in D1 #NCAAHockey shape up overall, out of conference and in conference.
Here is how all 64 teams in D1 #NCAAHockey shape up overall, out of conference and in conference.
Here are 4 plots that look at teams tendency to score or allow goals just after a power play (either their own or one they fought off)
Can goals scored just after the conclusion of a power play tell us anything?
Are they indicative of momentum from the power play carrying over?
What do you think?
Can goals scored just after the conclusion of a power play tell us anything?
Are they indicative of momentum from the power play carrying over?
What do you think?


February 7, 2025 at 4:39 PM
Here are 4 plots that look at teams tendency to score or allow goals just after a power play (either their own or one they fought off)
Can goals scored just after the conclusion of a power play tell us anything?
Are they indicative of momentum from the power play carrying over?
What do you think?
Can goals scored just after the conclusion of a power play tell us anything?
Are they indicative of momentum from the power play carrying over?
What do you think?
Looking at Outcomes at the Faceoff Circle
Which teams are the most dangerous and most vulnerable after the draw?
The plots show goals for and against within a given window of time after a face off. The first of each set shows the % of total goals. The second the raw count of goals scores/allowed
Which teams are the most dangerous and most vulnerable after the draw?
The plots show goals for and against within a given window of time after a face off. The first of each set shows the % of total goals. The second the raw count of goals scores/allowed


February 7, 2025 at 4:07 AM
Looking at Outcomes at the Faceoff Circle
Which teams are the most dangerous and most vulnerable after the draw?
The plots show goals for and against within a given window of time after a face off. The first of each set shows the % of total goals. The second the raw count of goals scores/allowed
Which teams are the most dangerous and most vulnerable after the draw?
The plots show goals for and against within a given window of time after a face off. The first of each set shows the % of total goals. The second the raw count of goals scores/allowed
Previewing the 2025 Dunkin' Beanpot
Part 2: Penalties, Special Teams & Line By Line Matchups
#collegehockey #hockeystats #ncaahockey #Beanpot
@bostoncollege.bsky.social @bostonu.bsky.social @northeasternu.bsky.social @harvard.edu @ncaa.bsky.social
Part 2: Penalties, Special Teams & Line By Line Matchups
#collegehockey #hockeystats #ncaahockey #Beanpot
@bostoncollege.bsky.social @bostonu.bsky.social @northeasternu.bsky.social @harvard.edu @ncaa.bsky.social


February 2, 2025 at 7:42 PM
Previewing the 2025 Dunkin' Beanpot
Part 2: Penalties, Special Teams & Line By Line Matchups
#collegehockey #hockeystats #ncaahockey #Beanpot
@bostoncollege.bsky.social @bostonu.bsky.social @northeasternu.bsky.social @harvard.edu @ncaa.bsky.social
Part 2: Penalties, Special Teams & Line By Line Matchups
#collegehockey #hockeystats #ncaahockey #Beanpot
@bostoncollege.bsky.social @bostonu.bsky.social @northeasternu.bsky.social @harvard.edu @ncaa.bsky.social
Previewing the 2025 Dunkin' Beanpot
Part 1: Shots and Scoring
#collegehockey #hockeystats #ncaahockey #Beanpot
@bostoncollege.bsky.social @bostonu.bsky.social @northeasternu.bsky.social @harvard.edu @ncaa.bsky.social
Part 1: Shots and Scoring
#collegehockey #hockeystats #ncaahockey #Beanpot
@bostoncollege.bsky.social @bostonu.bsky.social @northeasternu.bsky.social @harvard.edu @ncaa.bsky.social


February 2, 2025 at 7:40 PM
Previewing the 2025 Dunkin' Beanpot
Part 1: Shots and Scoring
#collegehockey #hockeystats #ncaahockey #Beanpot
@bostoncollege.bsky.social @bostonu.bsky.social @northeasternu.bsky.social @harvard.edu @ncaa.bsky.social
Part 1: Shots and Scoring
#collegehockey #hockeystats #ncaahockey #Beanpot
@bostoncollege.bsky.social @bostonu.bsky.social @northeasternu.bsky.social @harvard.edu @ncaa.bsky.social
With just a few non-conference games left let's take a look at how the leagues performed against each other in 24-25
Image 1: # of wins. Pick a league on the left side read across for wins against the others
Image 2: Avg Goals Scored - Goals scored per game based on conference matchup #ncaahockey
Image 1: # of wins. Pick a league on the left side read across for wins against the others
Image 2: Avg Goals Scored - Goals scored per game based on conference matchup #ncaahockey


January 31, 2025 at 6:11 AM
With just a few non-conference games left let's take a look at how the leagues performed against each other in 24-25
Image 1: # of wins. Pick a league on the left side read across for wins against the others
Image 2: Avg Goals Scored - Goals scored per game based on conference matchup #ncaahockey
Image 1: # of wins. Pick a league on the left side read across for wins against the others
Image 2: Avg Goals Scored - Goals scored per game based on conference matchup #ncaahockey
Now let's look at High Impact Goals in Hockey East.
This time we will plot teams based on the percentage of total scoring for the first and last 2 minute goals and by raw goal count for the back to back and quick response plots.
Does looking at by percentage add any depth to the data?
This time we will plot teams based on the percentage of total scoring for the first and last 2 minute goals and by raw goal count for the back to back and quick response plots.
Does looking at by percentage add any depth to the data?


January 27, 2025 at 5:20 AM
Now let's look at High Impact Goals in Hockey East.
This time we will plot teams based on the percentage of total scoring for the first and last 2 minute goals and by raw goal count for the back to back and quick response plots.
Does looking at by percentage add any depth to the data?
This time we will plot teams based on the percentage of total scoring for the first and last 2 minute goals and by raw goal count for the back to back and quick response plots.
Does looking at by percentage add any depth to the data?
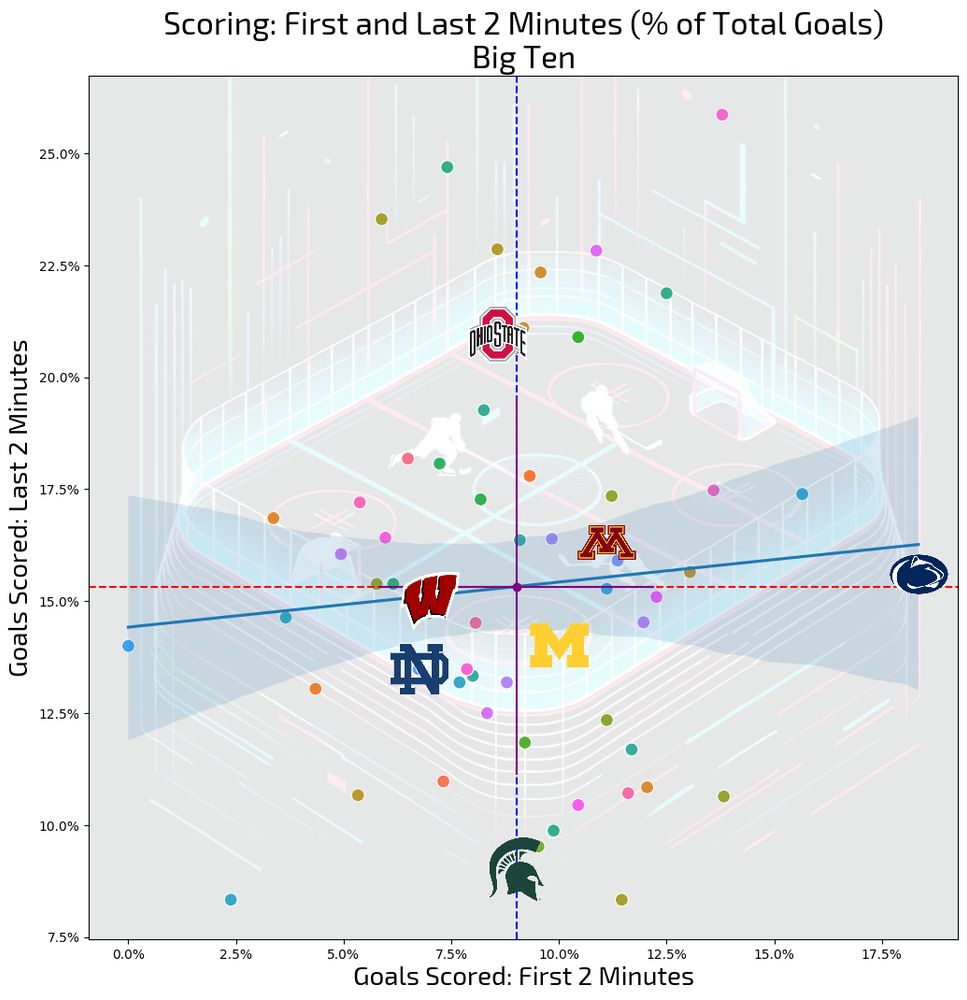
What if anything can 'high impact goals' tell us about overall team performance? I'm defining HIGs as goals scored in the first and last 2 minutes of a period as well as in quick succession, either back to back of in response to an opponent goal.
Let's take a look at the Big Ten so far this season
Let's take a look at the Big Ten so far this season


January 27, 2025 at 5:13 AM
What if anything can 'high impact goals' tell us about overall team performance? I'm defining HIGs as goals scored in the first and last 2 minutes of a period as well as in quick succession, either back to back of in response to an opponent goal.
Let's take a look at the Big Ten so far this season
Let's take a look at the Big Ten so far this season
NCAA Division 1 Game Balance - Which teams seize control of games? Which teams spend their time chasing? Which teams are always in nip and tuck games?


January 27, 2025 at 5:01 AM
NCAA Division 1 Game Balance - Which teams seize control of games? Which teams spend their time chasing? Which teams are always in nip and tuck games?


December 29, 2024 at 4:04 AM
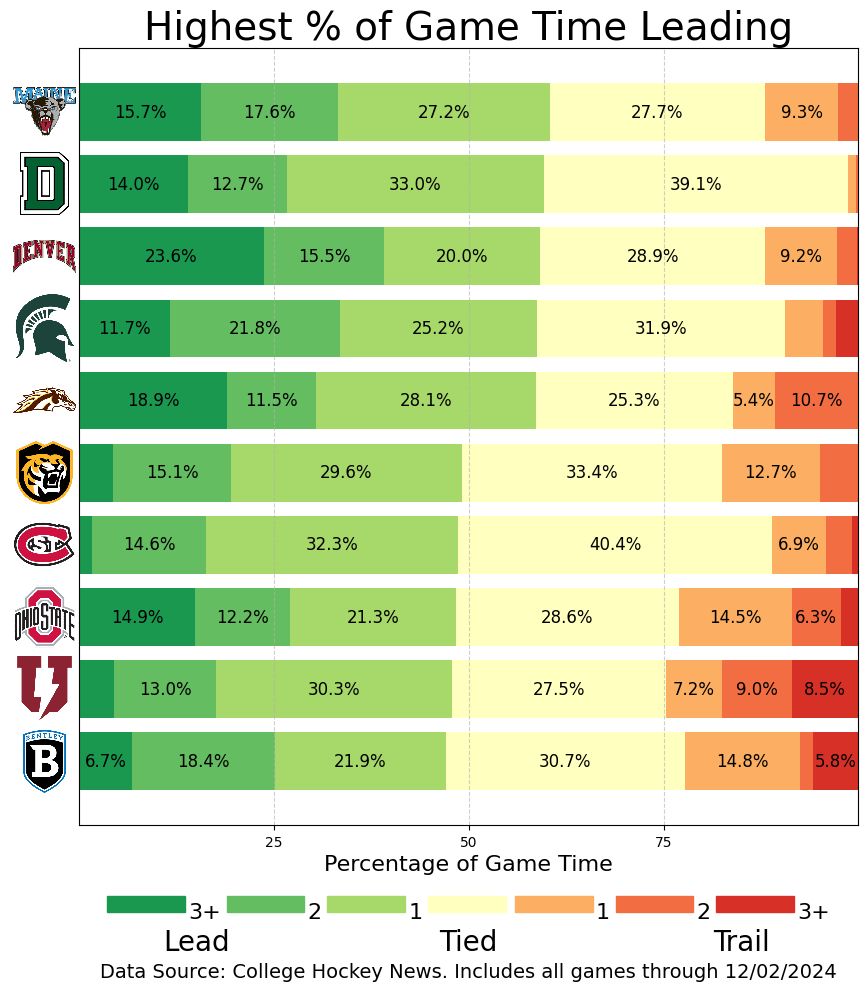
Which teams seize control of games? Which teams spend their time chasing? Which teams are always in nip and tuck games? It's time for a look during the break.
The fourth image ranks all 63 #D1 teams by Time Spent Leading
BC stands out to me, do I need to check my math?
#NCAAHockey #collegehockey
The fourth image ranks all 63 #D1 teams by Time Spent Leading
BC stands out to me, do I need to check my math?
#NCAAHockey #collegehockey


December 23, 2024 at 3:42 AM
Which teams seize control of games? Which teams spend their time chasing? Which teams are always in nip and tuck games? It's time for a look during the break.
The fourth image ranks all 63 #D1 teams by Time Spent Leading
BC stands out to me, do I need to check my math?
#NCAAHockey #collegehockey
The fourth image ranks all 63 #D1 teams by Time Spent Leading
BC stands out to me, do I need to check my math?
#NCAAHockey #collegehockey