


Manuel Razo
@mrazo.bsky.social
Postdoc @ Stanford | Schmidt Science Fellow ’21 | Biophysics & Evolution | Bayes Theorem Advocate | Proudly Mexicano 🇲🇽
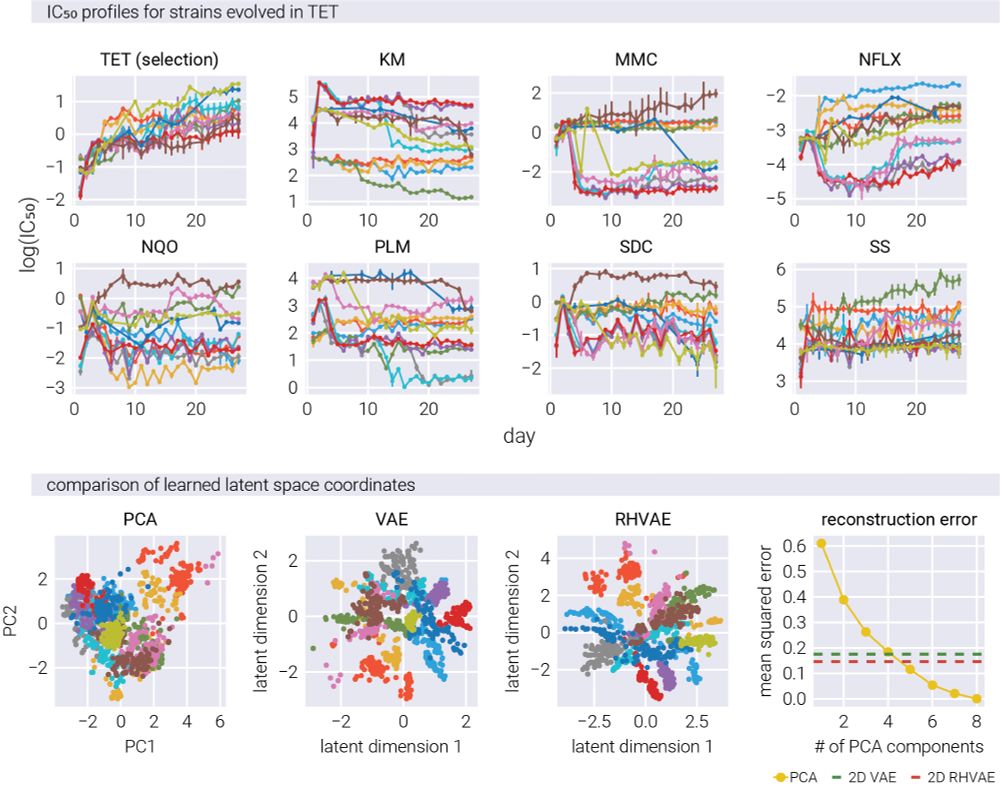
19/n The results? We can represent complex resistance patterns in just two dimensions while preserving key relationships!
May 15, 2025 at 2:33 PM
19/n The results? We can represent complex resistance patterns in just two dimensions while preserving key relationships!
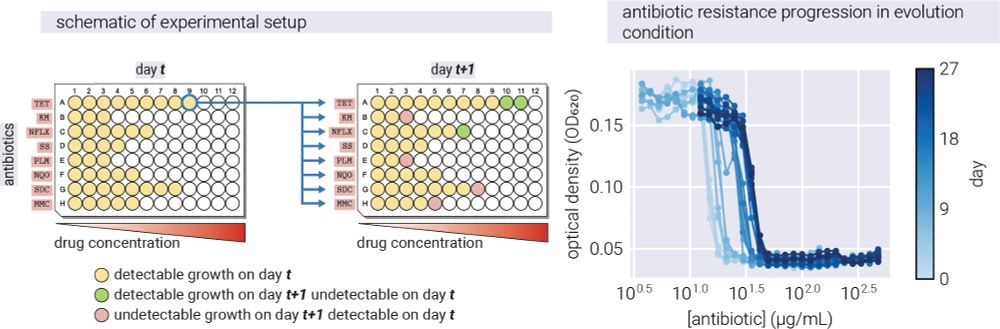
18/n Then we applied it to real-world data: E. coli evolving under different antibiotics. For this, we used the data from the incredible paper by Iwasawa et al. 2022, where they measured the fitness of E. coli evolving under different antibiotics.
May 15, 2025 at 2:33 PM
18/n Then we applied it to real-world data: E. coli evolving under different antibiotics. For this, we used the data from the incredible paper by Iwasawa et al. 2022, where they measured the fitness of E. coli evolving under different antibiotics.
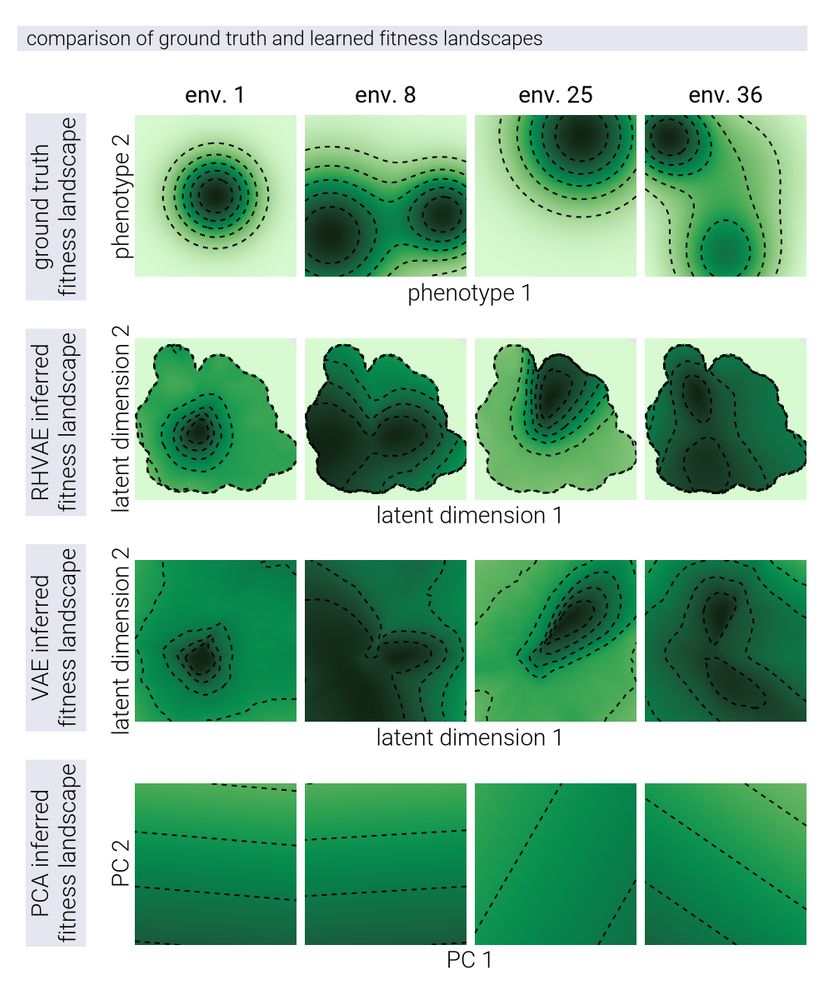
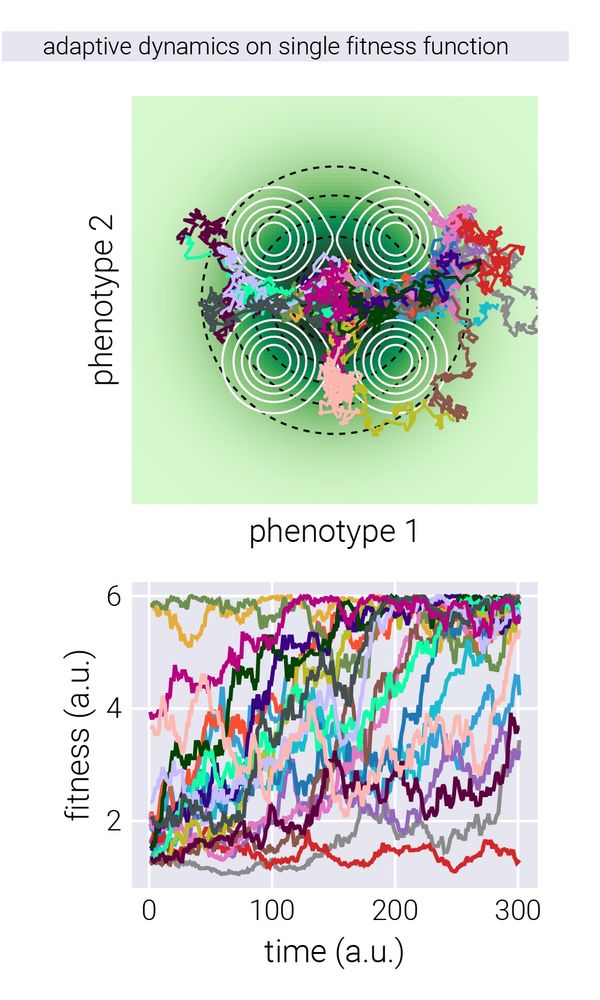
17/n Another cool feature of the RHVAE applied to this problem is that it allowed us to qualitatively reconstruct the underlying fitness landscapes from which the adaptive walks were drawn.
May 15, 2025 at 2:33 PM
17/n Another cool feature of the RHVAE applied to this problem is that it allowed us to qualitatively reconstruct the underlying fitness landscapes from which the adaptive walks were drawn.
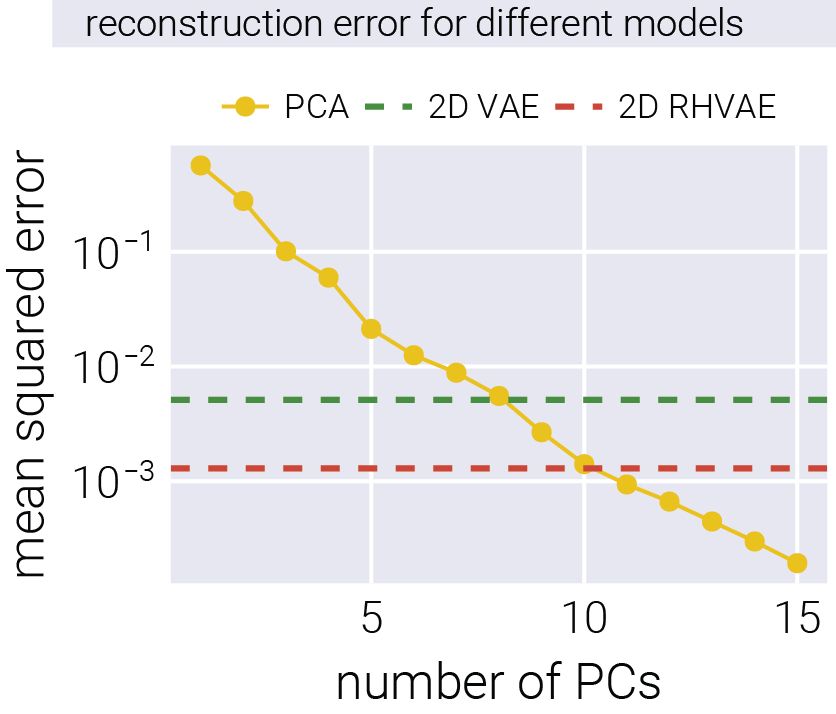
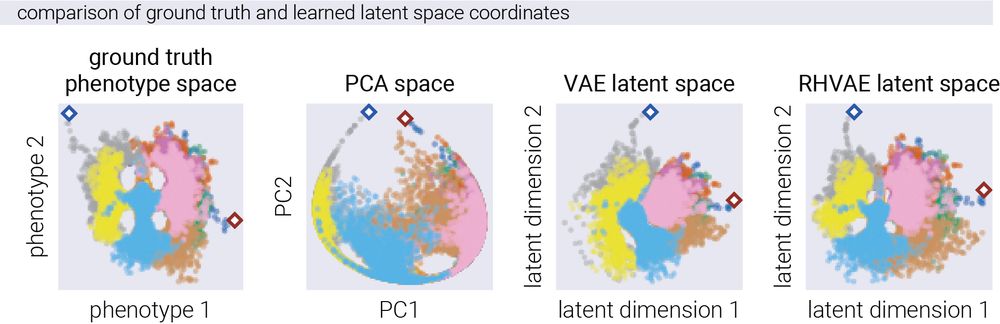
16/n Moreover, with only two non-linear dimensions, the RHVAE has the same reconstruction accuracy as a 10-dimensional PCA!
May 15, 2025 at 2:33 PM
16/n Moreover, with only two non-linear dimensions, the RHVAE has the same reconstruction accuracy as a 10-dimensional PCA!
15/n For this, we compared the performance of a linear model (PCA), a vanilla variational autoencoder (VAE), and our RHVAE. The non-linear models accurately reconstructed the underlying structure and relationships that generated the fitness patterns.
May 15, 2025 at 2:33 PM
15/n For this, we compared the performance of a linear model (PCA), a vanilla variational autoencoder (VAE), and our RHVAE. The non-linear models accurately reconstructed the underlying structure and relationships that generated the fitness patterns.
13/n Given this picture, we can then simulate adaptive walks in this phenotype space, and measure the fitness of the genotypes along the way.
May 15, 2025 at 2:33 PM
13/n Given this picture, we can then simulate adaptive walks in this phenotype space, and measure the fitness of the genotypes along the way.
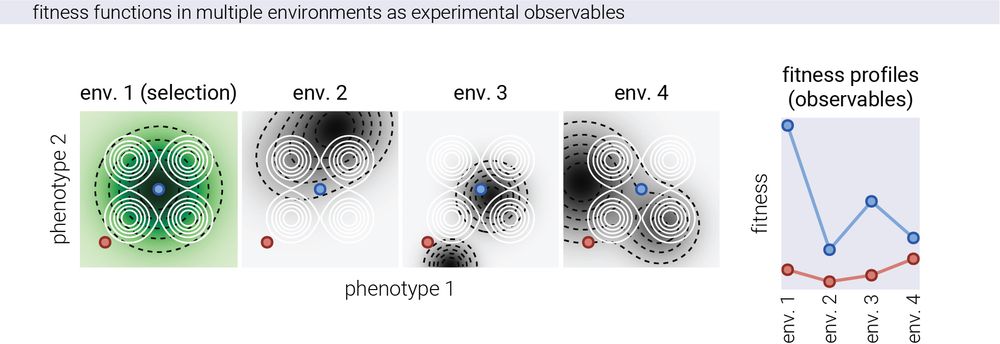
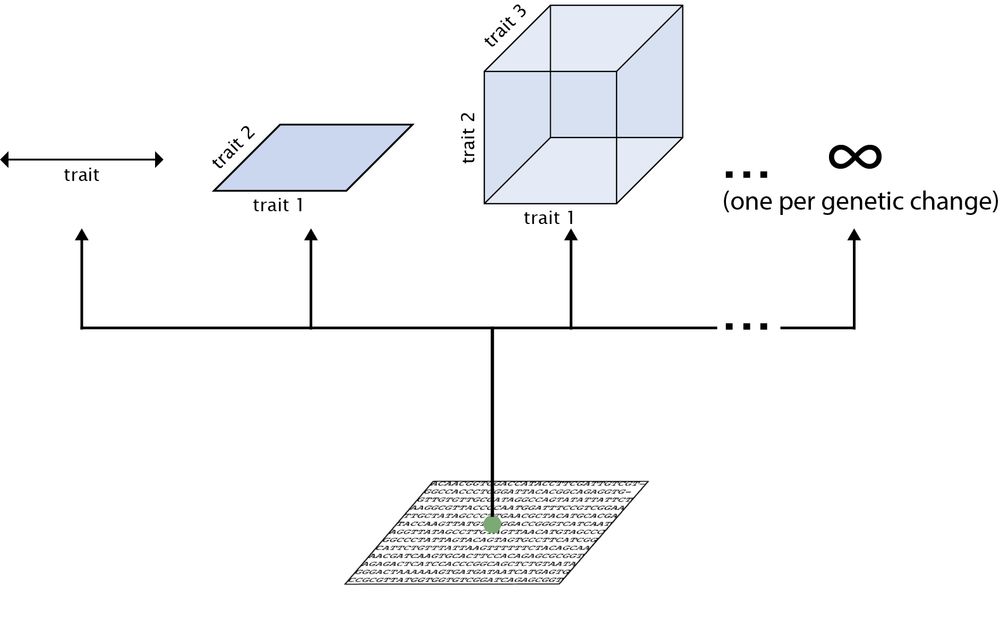
12/n We first tested this on simulated data. For this, we took the conceptual picture of Fisher’s geometric model seriously and imagined organisms with fixed coordinates in phenotype space, while the fitness landscape defined by the environment changes, giving different fitness readouts.
May 15, 2025 at 2:33 PM
12/n We first tested this on simulated data. For this, we took the conceptual picture of Fisher’s geometric model seriously and imagined organisms with fixed coordinates in phenotype space, while the fitness landscape defined by the environment changes, giving different fitness readouts.
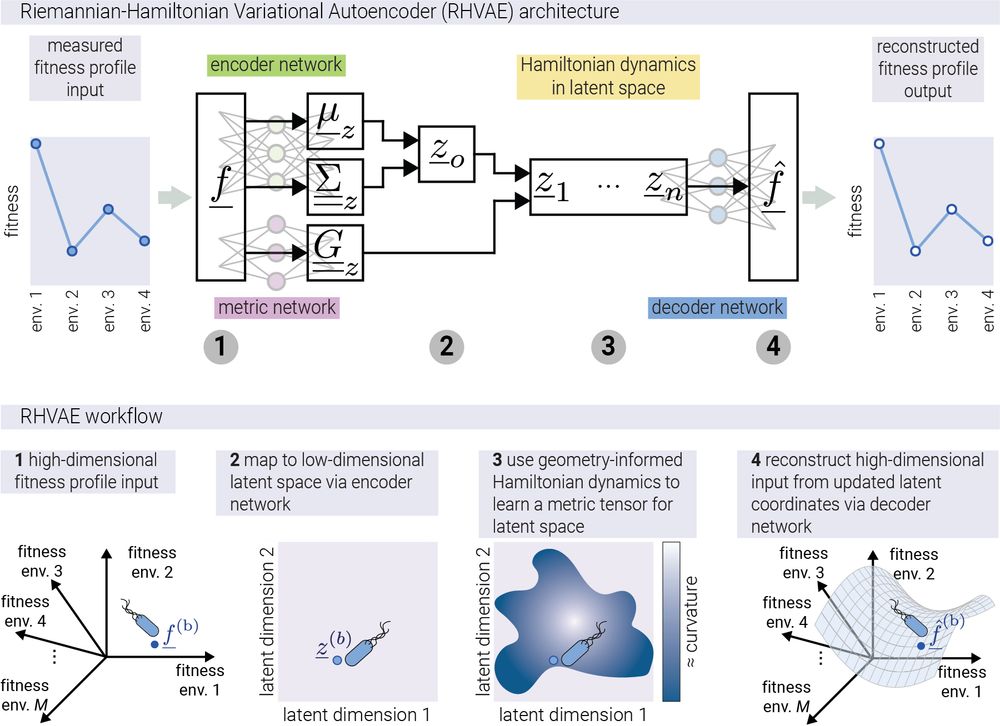
10/n To relax this assumption, we take advantage of the progress in geometric deep learning. More specifically, we use a neural network called a "Riemannian Hamiltonian Variational Autoencoder" (RHVAE) that not only reduces dimensionality but preserves the geometric relationships between data points
May 15, 2025 at 2:33 PM
10/n To relax this assumption, we take advantage of the progress in geometric deep learning. More specifically, we use a neural network called a "Riemannian Hamiltonian Variational Autoencoder" (RHVAE) that not only reduces dimensionality but preserves the geometric relationships between data points
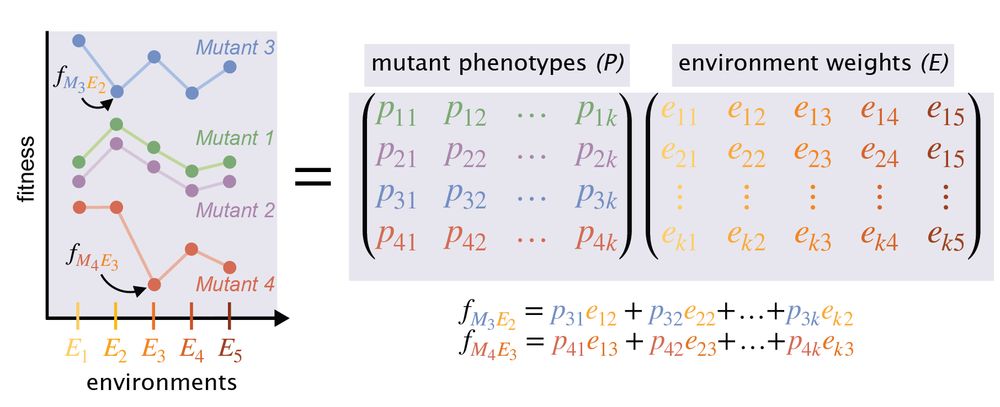
8/n This approach involved a linear decomposition of the fitness matrix via SVD. In other words, the authors assumed that fitness is a linear function of the phenotypic features.
May 15, 2025 at 2:33 PM
8/n This approach involved a linear decomposition of the fitness matrix via SVD. In other words, the authors assumed that fitness is a linear function of the phenotypic features.
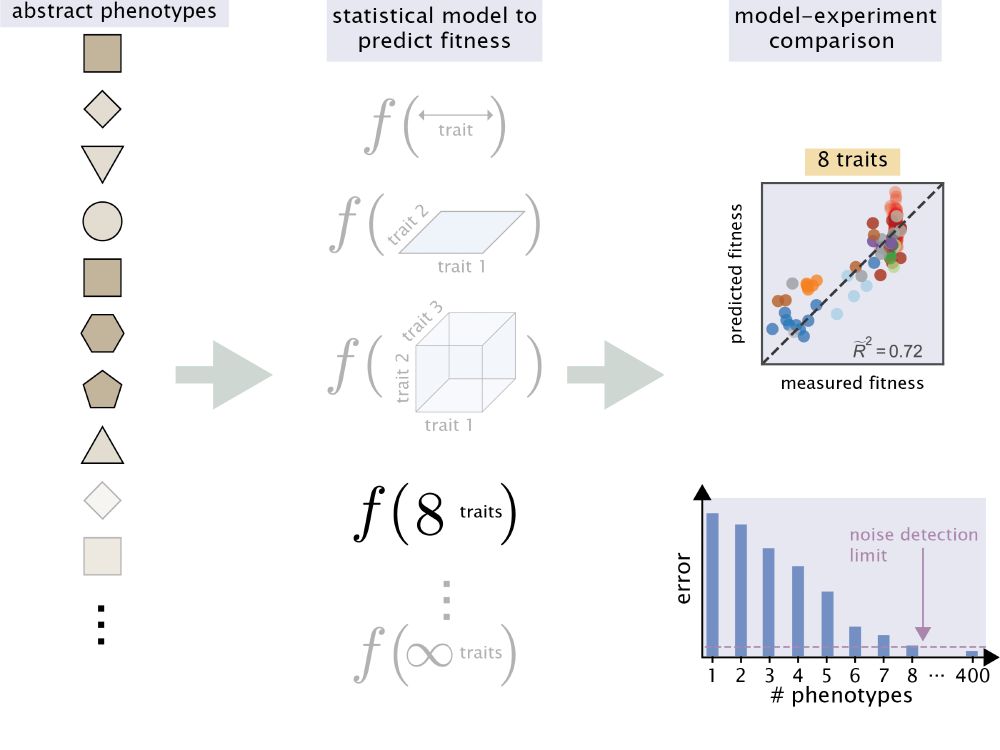
7/n The task is then to use a statistical model that takes as input some abstract phenotypic features and predicts the fitness of the genotype. In this way, Kinsler et al. 2020 found that 8 of these features were sufficient to predict their data
May 15, 2025 at 2:33 PM
7/n The task is then to use a statistical model that takes as input some abstract phenotypic features and predicts the fitness of the genotype. In this way, Kinsler et al. 2020 found that 8 of these features were sufficient to predict their data
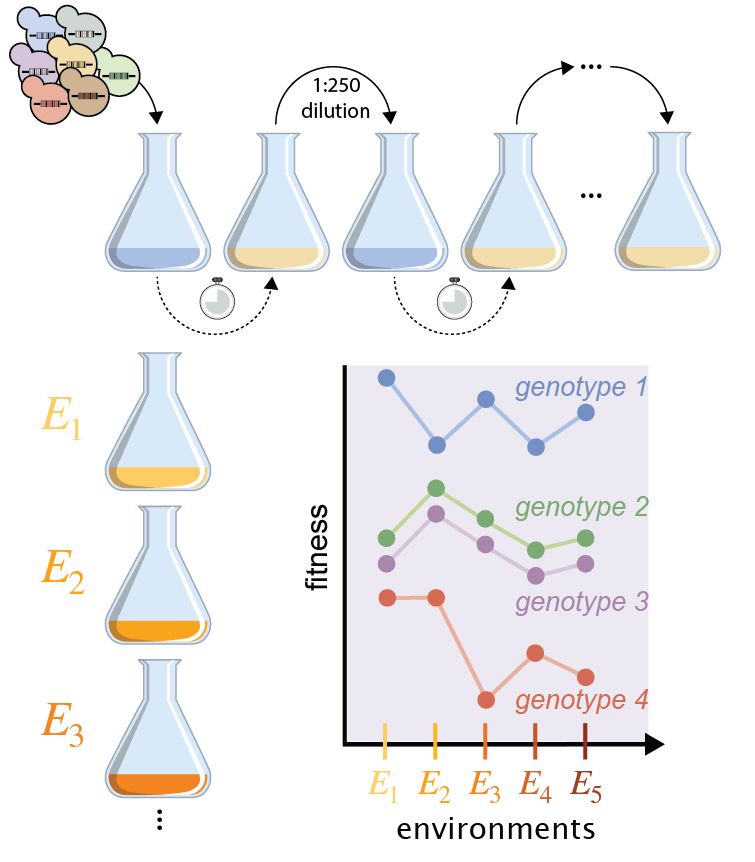
5/n Our lab and others have taken an approach based on our ability to measure fitness in the lab for multiple genotypes in different environments. For example, Kinsler et al. 2020 & Gosh et al. 2025 determined the fitness of many yeast genotypes in different environments.
May 15, 2025 at 2:33 PM
5/n Our lab and others have taken an approach based on our ability to measure fitness in the lab for multiple genotypes in different environments. For example, Kinsler et al. 2020 & Gosh et al. 2025 determined the fitness of many yeast genotypes in different environments.
3/n A simpler question one can ask is: when populations adapts to an environment, are there a limited set of phenotypic changes that dominate the adaptive process? I.e., can we uncover the dimensionality of the adaptive phenotypic landscape we observe in experimental evolution setups?
May 15, 2025 at 2:33 PM
3/n A simpler question one can ask is: when populations adapts to an environment, are there a limited set of phenotypic changes that dominate the adaptive process? I.e., can we uncover the dimensionality of the adaptive phenotypic landscape we observe in experimental evolution setups?