


Joe Moed
@mojo87.bsky.social
Beginner-level ייִדיש and chess, Intermediate-level variant Sudoku creating/solving, and Advanced-level electoral reform nerdery.
That is one POWERFUL spring.

December 10, 2025 at 3:37 AM
That is one POWERFUL spring.
Ugh, well that's wank.

September 5, 2025 at 5:22 PM
Ugh, well that's wank.
Feast your eyes on this FPTP monstrosity. Mind-boggling that the UK used to have Supplementary Vote (kinda like Ranked Ballot) for such elections & *actively* got rid of it!
Nice of the parties to arrange a neat stepped pattern. Though I see Ian Scott not holding up his end of the bargain. Prick.
Nice of the parties to arrange a neat stepped pattern. Though I see Ian Scott not holding up his end of the bargain. Prick.

May 2, 2025 at 4:29 AM
Feast your eyes on this FPTP monstrosity. Mind-boggling that the UK used to have Supplementary Vote (kinda like Ranked Ballot) for such elections & *actively* got rid of it!
Nice of the parties to arrange a neat stepped pattern. Though I see Ian Scott not holding up his end of the bargain. Prick.
Nice of the parties to arrange a neat stepped pattern. Though I see Ian Scott not holding up his end of the bargain. Prick.
I don't think they've called it yet (the dark blue colour means leading, right)?

April 29, 2025 at 6:01 AM
I don't think they've called it yet (the dark blue colour means leading, right)?
Not at present, I believe (although still a lead in seat count, and in prior updates, Mainstreet have been showing LPC majority even when CPC had 2% lead…). The point still stands that LPC structural advantage is significant! As well as this just being one poll of course :)

April 20, 2025 at 1:15 PM
Not at present, I believe (although still a lead in seat count, and in prior updates, Mainstreet have been showing LPC majority even when CPC had 2% lead…). The point still stands that LPC structural advantage is significant! As well as this just being one poll of course :)
Indeed - I believe they don't publish regionals, unfortunately, but it's true their model shows a strong Liberal majority on a 2.7% lead (in fact, as of today, the exact same majority as 338 aggregate shows on a 6% lead!).
www.mainstreetresearch.ca/dashboard/ca...
www.mainstreetresearch.ca/dashboard/ca...


April 16, 2025 at 3:02 PM
Indeed - I believe they don't publish regionals, unfortunately, but it's true their model shows a strong Liberal majority on a 2.7% lead (in fact, as of today, the exact same majority as 338 aggregate shows on a 6% lead!).
www.mainstreetresearch.ca/dashboard/ca...
www.mainstreetresearch.ca/dashboard/ca...
A tragedy in 2 acts over on chess dot com.
THIS is why they say "Never Resign", especially against pissy opponents so concerned about losing "a minute of their life" while playing *A 3-MIN A SIDE CHESS GAME*...
And, dare I say it, especially against entitled USians who bring Canada into it 🤣
THIS is why they say "Never Resign", especially against pissy opponents so concerned about losing "a minute of their life" while playing *A 3-MIN A SIDE CHESS GAME*...
And, dare I say it, especially against entitled USians who bring Canada into it 🤣


April 14, 2025 at 4:18 AM
A tragedy in 2 acts over on chess dot com.
THIS is why they say "Never Resign", especially against pissy opponents so concerned about losing "a minute of their life" while playing *A 3-MIN A SIDE CHESS GAME*...
And, dare I say it, especially against entitled USians who bring Canada into it 🤣
THIS is why they say "Never Resign", especially against pissy opponents so concerned about losing "a minute of their life" while playing *A 3-MIN A SIDE CHESS GAME*...
And, dare I say it, especially against entitled USians who bring Canada into it 🤣
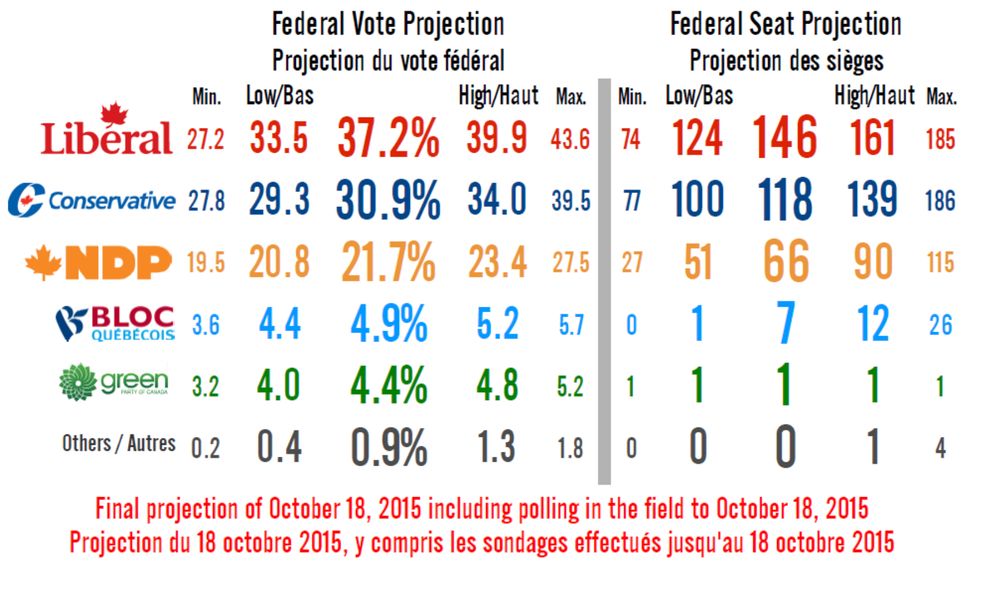
They were a bit further off in 2015 (e.g.: see below from Eric Grenier's ThreeHundredEight before he joined CBC!)
But that's largely down to the 3pt polling miss for LPC - that is to say, arguably polls were to blame, not the models :p
But that's largely down to the 3pt polling miss for LPC - that is to say, arguably polls were to blame, not the models :p
April 11, 2025 at 3:14 AM
They were a bit further off in 2015 (e.g.: see below from Eric Grenier's ThreeHundredEight before he joined CBC!)
But that's largely down to the 3pt polling miss for LPC - that is to say, arguably polls were to blame, not the models :p
But that's largely down to the 3pt polling miss for LPC - that is to say, arguably polls were to blame, not the models :p
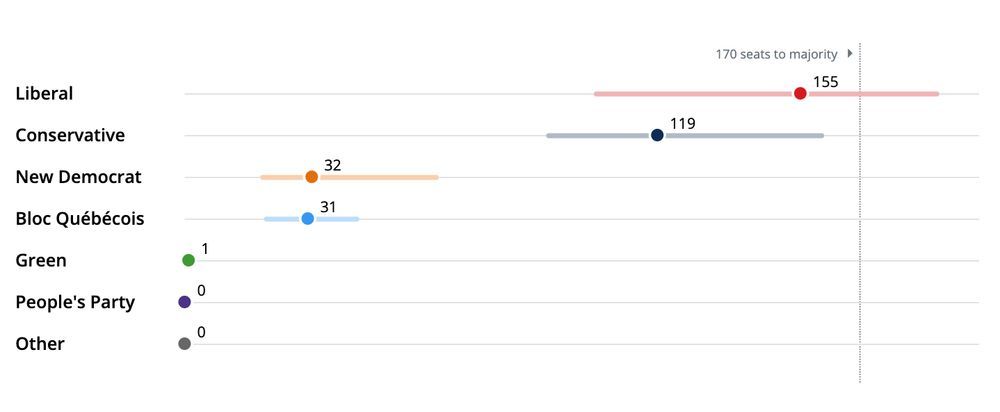
Pretty good - here were CBC Poll Tracker's final predictions in the last two elections (other models would probably have similar results):
2021 projection: L 155, C 119, N 32, B 31
2021 result: L 160, C 119, N 24, B32
2019 projection: L 141, C 121, B 39, N34
2019 result: L 157, C121, B 32, N 24
2021 projection: L 155, C 119, N 32, B 31
2021 result: L 160, C 119, N 24, B32
2019 projection: L 141, C 121, B 39, N34
2019 result: L 157, C121, B 32, N 24


April 11, 2025 at 3:09 AM
Pretty good - here were CBC Poll Tracker's final predictions in the last two elections (other models would probably have similar results):
2021 projection: L 155, C 119, N 32, B 31
2021 result: L 160, C 119, N 24, B32
2019 projection: L 141, C 121, B 39, N34
2019 result: L 157, C121, B 32, N 24
2021 projection: L 155, C 119, N 32, B 31
2021 result: L 160, C 119, N 24, B32
2019 projection: L 141, C 121, B 39, N34
2019 result: L 157, C121, B 32, N 24
The Innovative poll is on the CBC Poll Tracker, you just have to expand the list a bit.


April 8, 2025 at 1:31 AM
The Innovative poll is on the CBC Poll Tracker, you just have to expand the list a bit.
There isn’t a specific breakdown by age and gender, but given this is the split for 18-34s, if you overlay the gender split on that, I would imagine it is more acute among young men, yes…

April 5, 2025 at 12:46 PM
There isn’t a specific breakdown by age and gender, but given this is the split for 18-34s, if you overlay the gender split on that, I would imagine it is more acute among young men, yes…
Can’t decide if this is better or worse! Dadaist Google Translate…

April 4, 2025 at 10:58 PM
Can’t decide if this is better or worse! Dadaist Google Translate…
Not saying I love it, but worth bearing in mind that, depending on regional splits, even a 39-39 tie could be very good for the Liberals.
Here's a projection based on Abacus' regionals - basically CPC only tied due to a 36% lead in AB, which masks the fact they trail by 5% in the rest of Canada!
Here's a projection based on Abacus' regionals - basically CPC only tied due to a 36% lead in AB, which masks the fact they trail by 5% in the rest of Canada!


April 4, 2025 at 5:08 PM
Not saying I love it, but worth bearing in mind that, depending on regional splits, even a 39-39 tie could be very good for the Liberals.
Here's a projection based on Abacus' regionals - basically CPC only tied due to a 36% lead in AB, which masks the fact they trail by 5% in the rest of Canada!
Here's a projection based on Abacus' regionals - basically CPC only tied due to a 36% lead in AB, which masks the fact they trail by 5% in the rest of Canada!
Not an in-depth study or anything, but this chart from Wikipedia gives a good overview! At a high level:
- Polls were fairly stable (no party's average was ever more than 4% from their final result)
- Final poll average was quite close to actual result (+/-2% in most cases)
- Polls were fairly stable (no party's average was ever more than 4% from their final result)
- Final poll average was quite close to actual result (+/-2% in most cases)

April 1, 2025 at 5:01 AM
Not an in-depth study or anything, but this chart from Wikipedia gives a good overview! At a high level:
- Polls were fairly stable (no party's average was ever more than 4% from their final result)
- Final poll average was quite close to actual result (+/-2% in most cases)
- Polls were fairly stable (no party's average was ever more than 4% from their final result)
- Final poll average was quite close to actual result (+/-2% in most cases)
Lower than their recent highs of 6.78% & 6.55% in 2008/2019 respectively, but not materially different than 2021, where they managed 2.33%.

March 31, 2025 at 5:50 PM
Lower than their recent highs of 6.78% & 6.55% in 2008/2019 respectively, but not materially different than 2021, where they managed 2.33%.
I've already shared the data showing pollsters (and projections models based on them) did not materially get it wrong in 2019.
And if we're going down the "they got Brexit wrong" route, I don't think this is going to be a productive conversation.
And if we're going down the "they got Brexit wrong" route, I don't think this is going to be a productive conversation.


March 30, 2025 at 6:48 PM
I've already shared the data showing pollsters (and projections models based on them) did not materially get it wrong in 2019.
And if we're going down the "they got Brexit wrong" route, I don't think this is going to be a productive conversation.
And if we're going down the "they got Brexit wrong" route, I don't think this is going to be a productive conversation.
That article is from two weeks before the election though - LAB declined 2-3% in final weeks of campaign and CON recovered slightly by 1-2%!
Point still stands that the FINAL projections, the only ones anyone's hanging their hat on, got quite close - one or two outliers, mostly CONs 100ish.
Point still stands that the FINAL projections, the only ones anyone's hanging their hat on, got quite close - one or two outliers, mostly CONs 100ish.


March 30, 2025 at 6:43 PM
That article is from two weeks before the election though - LAB declined 2-3% in final weeks of campaign and CON recovered slightly by 1-2%!
Point still stands that the FINAL projections, the only ones anyone's hanging their hat on, got quite close - one or two outliers, mostly CONs 100ish.
Point still stands that the FINAL projections, the only ones anyone's hanging their hat on, got quite close - one or two outliers, mostly CONs 100ish.
This is directly from what I originally shared. Nine major models were active during the election, and those numbers I gave are the median of these projections.
Same thing for 2019 election. Although I miscalculated slightly, the median projection is: CON 343, LAB 223, LD 16, SNP 43
Same thing for 2019 election. Although I miscalculated slightly, the median projection is: CON 343, LAB 223, LD 16, SNP 43


March 30, 2025 at 6:37 PM
This is directly from what I originally shared. Nine major models were active during the election, and those numbers I gave are the median of these projections.
Same thing for 2019 election. Although I miscalculated slightly, the median projection is: CON 343, LAB 223, LD 16, SNP 43
Same thing for 2019 election. Although I miscalculated slightly, the median projection is: CON 343, LAB 223, LD 16, SNP 43
Sorry, but that's simply not true, at least recently in Canada:
2021 final projection: L 155, C 119, N 32, B 31
2021 final result: L 160, C 119, N 24, B32
2019 final projection: L 141, C 121, B 39, N34
2019 final result: L 157, C121, B 32, N 24
2021 final projection: L 155, C 119, N 32, B 31
2021 final result: L 160, C 119, N 24, B32
2019 final projection: L 141, C 121, B 39, N34
2019 final result: L 157, C121, B 32, N 24


March 30, 2025 at 6:24 PM
Sorry, but that's simply not true, at least recently in Canada:
2021 final projection: L 155, C 119, N 32, B 31
2021 final result: L 160, C 119, N 24, B32
2019 final projection: L 141, C 121, B 39, N34
2019 final result: L 157, C121, B 32, N 24
2021 final projection: L 155, C 119, N 32, B 31
2021 final result: L 160, C 119, N 24, B32
2019 final projection: L 141, C 121, B 39, N34
2019 final result: L 157, C121, B 32, N 24
Sure they’re flawed, and by necessity have to make assumptions about turnout & demographics. But the proof is in the pudding - the point I’m making is that, *despite* being imperfect, in Canada at least, recent polls managed to do very well!


March 30, 2025 at 2:30 PM
Sure they’re flawed, and by necessity have to make assumptions about turnout & demographics. But the proof is in the pudding - the point I’m making is that, *despite* being imperfect, in Canada at least, recent polls managed to do very well!
Indeed - FPTP is wack, and there’s no better example of its wackness than the UK 2024 General Election! Which makes it tricky to accurately model results as a side effect, and can make small polling errors translate to large seat projection errors.

March 30, 2025 at 12:24 PM
Indeed - FPTP is wack, and there’s no better example of its wackness than the UK 2024 General Election! Which makes it tricky to accurately model results as a side effect, and can make small polling errors translate to large seat projection errors.
But it might also be due to shifts in how LPC vote is distributed, and who they've gained from?
For example, in ON, latest projection has L 47%, C 38%, N 9%, giving 81/39/1 seats. But in last election, it was 39/35/18%, giving 78/37/5 seats.
For example, in ON, latest projection has L 47%, C 38%, N 9%, giving 81/39/1 seats. But in last election, it was 39/35/18%, giving 78/37/5 seats.

March 30, 2025 at 4:57 AM
But it might also be due to shifts in how LPC vote is distributed, and who they've gained from?
For example, in ON, latest projection has L 47%, C 38%, N 9%, giving 81/39/1 seats. But in last election, it was 39/35/18%, giving 78/37/5 seats.
For example, in ON, latest projection has L 47%, C 38%, N 9%, giving 81/39/1 seats. But in last election, it was 39/35/18%, giving 78/37/5 seats.
Needless to say, a polling miss involving overestimating LPC by 4.3% and underestimaating CPC by 2.4% could have a FAR larger impact on the makeup of Parliament in this election, where things are much closer to start with!


March 30, 2025 at 3:00 AM
Needless to say, a polling miss involving overestimating LPC by 4.3% and underestimaating CPC by 2.4% could have a FAR larger impact on the makeup of Parliament in this election, where things are much closer to start with!
Having said that, the actual national poll numbers were off by a fair amount: LAB averaged 39ish, they ended up on 34.7% (GB only); CONs averaged 22ish, they ended up on 24.4%. But LAB were so far ahead and vote so efficient that the modellers were able to do quite well anyway!

March 30, 2025 at 2:57 AM
Having said that, the actual national poll numbers were off by a fair amount: LAB averaged 39ish, they ended up on 34.7% (GB only); CONs averaged 22ish, they ended up on 24.4%. But LAB were so far ahead and vote so efficient that the modellers were able to do quite well anyway!
Wait what, which polls predicted Tories would be reduced to 20 seats? These were the final calls from the various reputable groups making projections - they ranged from 64-130 seats, with an average of 102, so the Tories were on the high end, but well within the range...

March 30, 2025 at 2:48 AM
Wait what, which polls predicted Tories would be reduced to 20 seats? These were the final calls from the various reputable groups making projections - they ranged from 64-130 seats, with an average of 102, so the Tories were on the high end, but well within the range...