


Bratislav Misic
@misicbata.bsky.social
6️⃣ So far, we considered considered synthetic graphs, but what about real brains?
We implement dMRI brain networks as reservoirs. Again, hierarchical modularity positively contributes to computational performance.
Amazingly, reservoir timescales correlate with empirical timescales derived from MEG.
We implement dMRI brain networks as reservoirs. Again, hierarchical modularity positively contributes to computational performance.
Amazingly, reservoir timescales correlate with empirical timescales derived from MEG.

September 17, 2025 at 5:23 PM
6️⃣ So far, we considered considered synthetic graphs, but what about real brains?
We implement dMRI brain networks as reservoirs. Again, hierarchical modularity positively contributes to computational performance.
Amazingly, reservoir timescales correlate with empirical timescales derived from MEG.
We implement dMRI brain networks as reservoirs. Again, hierarchical modularity positively contributes to computational performance.
Amazingly, reservoir timescales correlate with empirical timescales derived from MEG.
5️⃣ How well do these networks perform multiple tasks simultaneously? We assign memory tasks to half the modules, and non-linear transformation tasks to the other half.
Again, we find that higher-order hierarchical modular networks consistently outperform their lower-order counterparts.
Again, we find that higher-order hierarchical modular networks consistently outperform their lower-order counterparts.

September 17, 2025 at 5:23 PM
5️⃣ How well do these networks perform multiple tasks simultaneously? We assign memory tasks to half the modules, and non-linear transformation tasks to the other half.
Again, we find that higher-order hierarchical modular networks consistently outperform their lower-order counterparts.
Again, we find that higher-order hierarchical modular networks consistently outperform their lower-order counterparts.
4️⃣ To uncover the topological underpinnings of these differences in dynamics, we consider the motif composition of the reservoir.
More complex motifs containing at least three edges are all enriched in higher-order hierarchical modular networks, supporting more complex computations.
More complex motifs containing at least three edges are all enriched in higher-order hierarchical modular networks, supporting more complex computations.

September 17, 2025 at 5:23 PM
4️⃣ To uncover the topological underpinnings of these differences in dynamics, we consider the motif composition of the reservoir.
More complex motifs containing at least three edges are all enriched in higher-order hierarchical modular networks, supporting more complex computations.
More complex motifs containing at least three edges are all enriched in higher-order hierarchical modular networks, supporting more complex computations.
3️⃣ How does hierarchical modularity shape dynamics to improve memory? We compute timescales from nodal time series at criticality.
Higher-order hierarchical modular reservoirs show more variability in timescales, yielding a bigger pool of timescales and richer temporal expansion of input signals.
Higher-order hierarchical modular reservoirs show more variability in timescales, yielding a bigger pool of timescales and richer temporal expansion of input signals.

September 17, 2025 at 5:23 PM
3️⃣ How does hierarchical modularity shape dynamics to improve memory? We compute timescales from nodal time series at criticality.
Higher-order hierarchical modular reservoirs show more variability in timescales, yielding a bigger pool of timescales and richer temporal expansion of input signals.
Higher-order hierarchical modular reservoirs show more variability in timescales, yielding a bigger pool of timescales and richer temporal expansion of input signals.
2️⃣ We start by evaluating the reservoir’s ability to preserve representations of past stimuli with the widely used memory capacity task.
Higher-order hierarchical modular networks consistently perform best, particularly at criticality.
Higher-order hierarchical modular networks consistently perform best, particularly at criticality.

September 17, 2025 at 5:23 PM
2️⃣ We start by evaluating the reservoir’s ability to preserve representations of past stimuli with the widely used memory capacity task.
Higher-order hierarchical modular networks consistently perform best, particularly at criticality.
Higher-order hierarchical modular networks consistently perform best, particularly at criticality.
1️⃣ We use stochastic block models to generate synthetic multi-level hierarchical modular networks.
We then implement them as reservoirs to evaluate their cognitive capacity.
We then implement them as reservoirs to evaluate their cognitive capacity.

September 17, 2025 at 5:23 PM
1️⃣ We use stochastic block models to generate synthetic multi-level hierarchical modular networks.
We then implement them as reservoirs to evaluate their cognitive capacity.
We then implement them as reservoirs to evaluate their cognitive capacity.
Neuromorphic hierarchical modular reservoirs | doi.org/10.1101/2025...
How does hierarchical modularity shape computational function? ⤵️
How does hierarchical modularity shape computational function? ⤵️
September 17, 2025 at 5:23 PM
Neuromorphic hierarchical modular reservoirs | doi.org/10.1101/2025...
How does hierarchical modularity shape computational function? ⤵️
How does hierarchical modularity shape computational function? ⤵️
8️⃣ Finally, we consider spinal- and bulbar-onset subtypes. Epicenters in spinal-onset are mainly in primary motor cortex and paracentral lobule. In bulbar-onset, epicenters are prominent in lower paracentral gyrus and inferior frontal gyrus, aligning with the clinical presentation of the subtypes.

September 16, 2025 at 4:17 PM
8️⃣ Finally, we consider spinal- and bulbar-onset subtypes. Epicenters in spinal-onset are mainly in primary motor cortex and paracentral lobule. In bulbar-onset, epicenters are prominent in lower paracentral gyrus and inferior frontal gyrus, aligning with the clinical presentation of the subtypes.
7️⃣ If cortical epicenters reflect the spatial focus of ALS pathology, do they also correlate with the clinical manifestation? Indeed: epicenter maps are correlated with poor motor function, including abnormal index finger and foot tapping scores, daily physical function, and muscle tone.

September 16, 2025 at 4:17 PM
7️⃣ If cortical epicenters reflect the spatial focus of ALS pathology, do they also correlate with the clinical manifestation? Indeed: epicenter maps are correlated with poor motor function, including abnormal index finger and foot tapping scores, daily physical function, and muscle tone.
6️⃣ We next ask whether the network epicenters of ALS atrophy are enriched for specific biological processes, cellular components, and cell types.

September 16, 2025 at 4:17 PM
6️⃣ We next ask whether the network epicenters of ALS atrophy are enriched for specific biological processes, cellular components, and cell types.
5️⃣ We next investigate whether spreading is more likely between regions that share biological features, including (1) gene expression, (2) neurotransmitter receptors, (3) laminar differentiation, (4) metabolism, and (5) hemodynamics.

September 16, 2025 at 4:17 PM
5️⃣ We next investigate whether spreading is more likely between regions that share biological features, including (1) gene expression, (2) neurotransmitter receptors, (3) laminar differentiation, (4) metabolism, and (5) hemodynamics.
4️⃣ We apply two methods to back-reconstruct the spreading trajectory and infer the most likely cortical location of the epicenter: (1) a network-based node ranking method, and (2) a susceptible-infected-removed (SIR) dynamical model.
Epicenter rankings are consistent with ALS pathological staging.
Epicenter rankings are consistent with ALS pathological staging.

September 16, 2025 at 4:17 PM
4️⃣ We apply two methods to back-reconstruct the spreading trajectory and infer the most likely cortical location of the epicenter: (1) a network-based node ranking method, and (2) a susceptible-infected-removed (SIR) dynamical model.
Epicenter rankings are consistent with ALS pathological staging.
Epicenter rankings are consistent with ALS pathological staging.
3️⃣ We next assess the extent to which the spatial patterning of atrophy is related to structural connectivity.
Regional atrophy is correlated with the mean atrophy of its structurally connected neighbours, consistent with the notion of network spread of pathology.
Regional atrophy is correlated with the mean atrophy of its structurally connected neighbours, consistent with the notion of network spread of pathology.

September 16, 2025 at 4:17 PM
3️⃣ We next assess the extent to which the spatial patterning of atrophy is related to structural connectivity.
Regional atrophy is correlated with the mean atrophy of its structurally connected neighbours, consistent with the notion of network spread of pathology.
Regional atrophy is correlated with the mean atrophy of its structurally connected neighbours, consistent with the notion of network spread of pathology.
2️⃣ We analyze the Canadian ALS Neuroimaging Consortium (CALSNIC) dataset. Atrophy is concentrated in pre-central gyrus, as well as bilateral corticospinal tracts, bilateral anterior thalamic radiation, and bilateral superior longitudinal fasciculus bundles.

September 16, 2025 at 4:17 PM
2️⃣ We analyze the Canadian ALS Neuroimaging Consortium (CALSNIC) dataset. Atrophy is concentrated in pre-central gyrus, as well as bilateral corticospinal tracts, bilateral anterior thalamic radiation, and bilateral superior longitudinal fasciculus bundles.
1️⃣ Accounts of ALS revolve around two notions: network spreading of pathogenic proteins via synapses, and intrinsic local vulnerability of specific cells.
Both may be true: pathogenic spread via synaptic contacts is amplified by local vulnerability, guiding the network spread of atrophy.
Both may be true: pathogenic spread via synaptic contacts is amplified by local vulnerability, guiding the network spread of atrophy.

September 16, 2025 at 4:17 PM
1️⃣ Accounts of ALS revolve around two notions: network spreading of pathogenic proteins via synapses, and intrinsic local vulnerability of specific cells.
Both may be true: pathogenic spread via synaptic contacts is amplified by local vulnerability, guiding the network spread of atrophy.
Both may be true: pathogenic spread via synaptic contacts is amplified by local vulnerability, guiding the network spread of atrophy.
Network spreading and local biological vulnerability in amyotrophic lateral sclerosis |
doi.org/10.1038/s420...
How do brain network structure and local biological features shape the spatial patterning of atrophy in ALS? @asafarahani.bsky.social investigates ⤵️
doi.org/10.1038/s420...
How do brain network structure and local biological features shape the spatial patterning of atrophy in ALS? @asafarahani.bsky.social investigates ⤵️
September 16, 2025 at 4:17 PM
Network spreading and local biological vulnerability in amyotrophic lateral sclerosis |
doi.org/10.1038/s420...
How do brain network structure and local biological features shape the spatial patterning of atrophy in ALS? @asafarahani.bsky.social investigates ⤵️
doi.org/10.1038/s420...
How do brain network structure and local biological features shape the spatial patterning of atrophy in ALS? @asafarahani.bsky.social investigates ⤵️
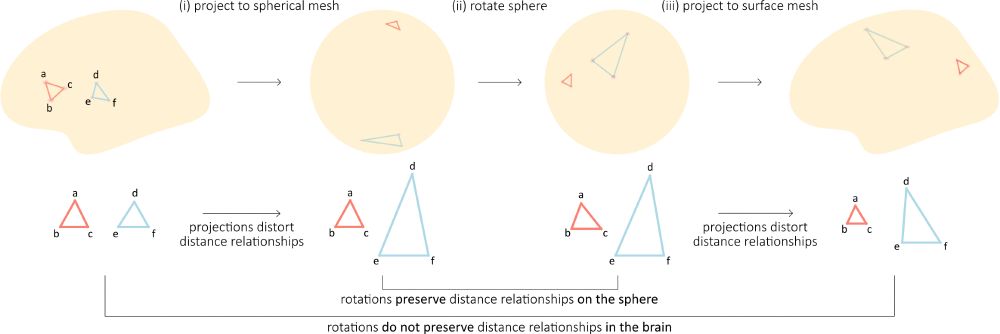
4️⃣ As an aside, we also take a deep dive into how spherical projections distort local spatial autocorrelation.

September 10, 2025 at 1:07 PM
4️⃣ As an aside, we also take a deep dive into how spherical projections distort local spatial autocorrelation.
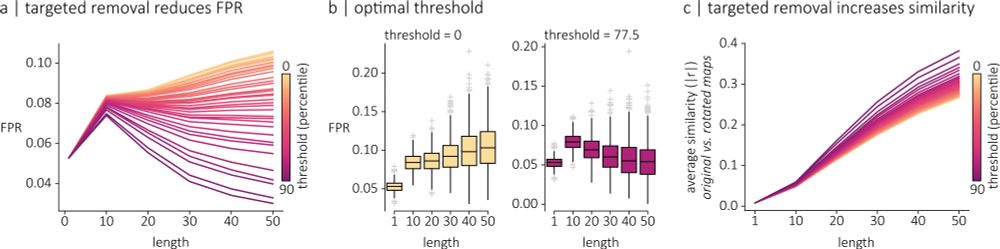
3️⃣ Finally, we show how targeted removal of high-error surrogate maps can be used to reduce the false positive rates.
September 10, 2025 at 1:07 PM
3️⃣ Finally, we show how targeted removal of high-error surrogate maps can be used to reduce the false positive rates.
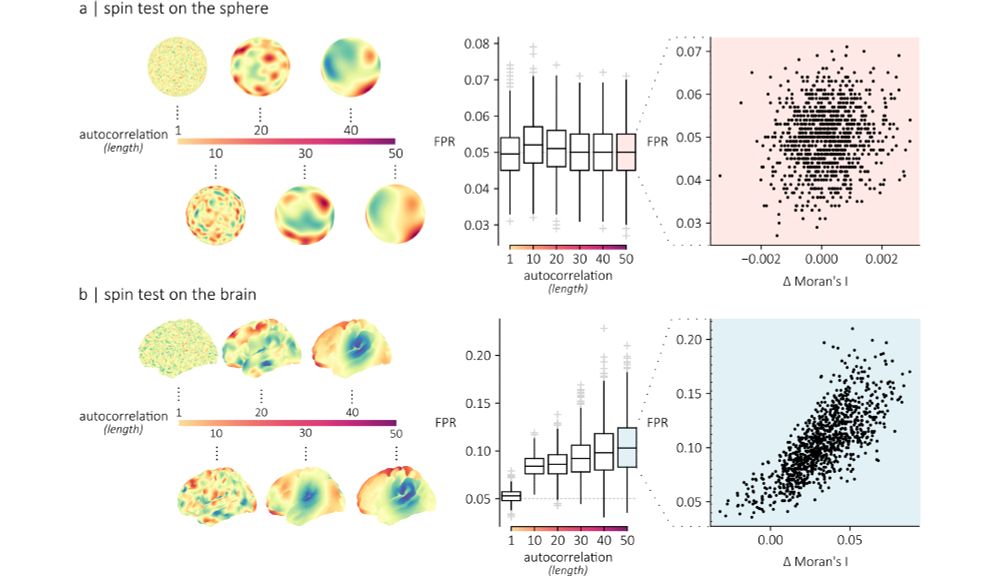
2️⃣ We show that these errors directly result in greater false positive rates.
September 10, 2025 at 1:07 PM
2️⃣ We show that these errors directly result in greater false positive rates.
1️⃣ We find that false positive rates in spatial permutation tests can be traced back to the initial step of projecting a brain surface to a sphere.
Namely, the projection to a spherical mesh distorts distance relationships between vertices of the cortical surface mesh.
Namely, the projection to a spherical mesh distorts distance relationships between vertices of the cortical surface mesh.

September 10, 2025 at 1:07 PM
1️⃣ We find that false positive rates in spatial permutation tests can be traced back to the initial step of projecting a brain surface to a sphere.
Namely, the projection to a spherical mesh distorts distance relationships between vertices of the cortical surface mesh.
Namely, the projection to a spherical mesh distorts distance relationships between vertices of the cortical surface mesh.
The effect of spherical projections on spin tests for brain maps | doi.org/10.1162/IMAG...
Spin tests are the de facto null model for map-to-map comparisons in brain imaging. Why don't they perfectly control false positives? @vincebaz.bsky.social explores ⤵️
Spin tests are the de facto null model for map-to-map comparisons in brain imaging. Why don't they perfectly control false positives? @vincebaz.bsky.social explores ⤵️
September 10, 2025 at 1:07 PM
The effect of spherical projections on spin tests for brain maps | doi.org/10.1162/IMAG...
Spin tests are the de facto null model for map-to-map comparisons in brain imaging. Why don't they perfectly control false positives? @vincebaz.bsky.social explores ⤵️
Spin tests are the de facto null model for map-to-map comparisons in brain imaging. Why don't they perfectly control false positives? @vincebaz.bsky.social explores ⤵️
7⃣ Finally, we show that ASL-derived perfusion can be used to delineate arterial territories in a data-driven manner. We use these arterial territories to map a semantic space for how different vascular systems support different patterns of regional cognitive specialization.

August 8, 2025 at 2:24 PM
7⃣ Finally, we show that ASL-derived perfusion can be used to delineate arterial territories in a data-driven manner. We use these arterial territories to map a semantic space for how different vascular systems support different patterns of regional cognitive specialization.
6⃣ Disease vulnerability: cortical atrophy in multiple neurodegenerative diseases (late-onset Alzheimer's disease, TDP-43C, and dementia with Lewy bodies) is greatest in low-perfusion areas, highlighting the utility of perfusion as an indicator of transdiagnostic vulnerability.

August 8, 2025 at 2:24 PM
6⃣ Disease vulnerability: cortical atrophy in multiple neurodegenerative diseases (late-onset Alzheimer's disease, TDP-43C, and dementia with Lewy bodies) is greatest in low-perfusion areas, highlighting the utility of perfusion as an indicator of transdiagnostic vulnerability.
5⃣ In healthy aging, perfusion maps onto individual differences in physiological changes in aging. Interestingly, age-related reductions in perfusion are greatest in arterial border-zones.

August 8, 2025 at 2:24 PM
5⃣ In healthy aging, perfusion maps onto individual differences in physiological changes in aging. Interestingly, age-related reductions in perfusion are greatest in arterial border-zones.
4⃣ Looking across individuals, blood perfusion is dynamic throughout the lifespan, and follows micro-architectural changes in development.

August 8, 2025 at 2:24 PM
4⃣ Looking across individuals, blood perfusion is dynamic throughout the lifespan, and follows micro-architectural changes in development.