


Prof. Michael Fuhrer
@michaelsfuhrer.bsky.social
Epidemic epistemic trespassing. Knows a lot about graphene.
Monash Uni. Directed fleet.org.au. Fellow @scienceacademy.bsky.social.
Plays bass for www.instagram.com/push_the_trigger
Bird photos at www.flickr.com/photos/off-world
Monash Uni. Directed fleet.org.au. Fellow @scienceacademy.bsky.social.
Plays bass for www.instagram.com/push_the_trigger
Bird photos at www.flickr.com/photos/off-world
Last note:
It's still a surprisingly high amount of covid!
"Flu" is three co-circulating strains, and covid was detected more than any individual flu strain. It's quite possible it was the most detected individual virus. (RSV is two strains, RV is many...)
6/
It's still a surprisingly high amount of covid!
"Flu" is three co-circulating strains, and covid was detected more than any individual flu strain. It's quite possible it was the most detected individual virus. (RSV is two strains, RV is many...)
6/

November 10, 2025 at 6:47 AM
Last note:
It's still a surprisingly high amount of covid!
"Flu" is three co-circulating strains, and covid was detected more than any individual flu strain. It's quite possible it was the most detected individual virus. (RSV is two strains, RV is many...)
6/
It's still a surprisingly high amount of covid!
"Flu" is three co-circulating strains, and covid was detected more than any individual flu strain. It's quite possible it was the most detected individual virus. (RSV is two strains, RV is many...)
6/
A few caveats to interpreting those numbers.
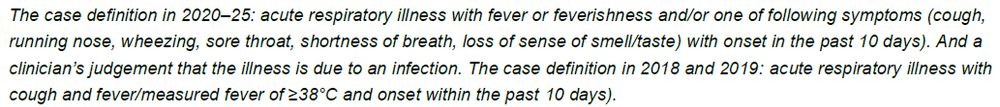
(1) These are symptomatic infections, so some infections will be missed. Case definition is below. This won't capture a mild bout of sniffles. On the other hand, rhinoviruses were detected 6 times as often as covid, so it does include some "colds"!
2/
(1) These are symptomatic infections, so some infections will be missed. Case definition is below. This won't capture a mild bout of sniffles. On the other hand, rhinoviruses were detected 6 times as often as covid, so it does include some "colds"!
2/
November 10, 2025 at 6:47 AM
A few caveats to interpreting those numbers.
(1) These are symptomatic infections, so some infections will be missed. Case definition is below. This won't capture a mild bout of sniffles. On the other hand, rhinoviruses were detected 6 times as often as covid, so it does include some "colds"!
2/
(1) These are symptomatic infections, so some infections will be missed. Case definition is below. This won't capture a mild bout of sniffles. On the other hand, rhinoviruses were detected 6 times as often as covid, so it does include some "colds"!
2/
WellKiwis has wrapped up their respiratory virus surveillance this year in Wellington, NZ.
During 31 Mar - 19 Oct 2025, they detected:
2,328 identified single viruses (some samples had >1)
of which:
191 (8.2%) were SARS-CoV-2
382 (16.4%) were influenza
➡️Twice as many flu as covid detections!
1/
During 31 Mar - 19 Oct 2025, they detected:
2,328 identified single viruses (some samples had >1)
of which:
191 (8.2%) were SARS-CoV-2
382 (16.4%) were influenza
➡️Twice as many flu as covid detections!
1/

November 10, 2025 at 6:47 AM
WellKiwis has wrapped up their respiratory virus surveillance this year in Wellington, NZ.
During 31 Mar - 19 Oct 2025, they detected:
2,328 identified single viruses (some samples had >1)
of which:
191 (8.2%) were SARS-CoV-2
382 (16.4%) were influenza
➡️Twice as many flu as covid detections!
1/
During 31 Mar - 19 Oct 2025, they detected:
2,328 identified single viruses (some samples had >1)
of which:
191 (8.2%) were SARS-CoV-2
382 (16.4%) were influenza
➡️Twice as many flu as covid detections!
1/
There are some interesting bits of information in here.
Clearly the numbers reflect both incidence and severity.
In ages 5-9, flu detections outnumber covid by a factor of 12 (😮)
In ages 70+, they are approximately equal.
Clearly the numbers reflect both incidence and severity.
In ages 5-9, flu detections outnumber covid by a factor of 12 (😮)
In ages 70+, they are approximately equal.

November 9, 2025 at 1:24 AM
There are some interesting bits of information in here.
Clearly the numbers reflect both incidence and severity.
In ages 5-9, flu detections outnumber covid by a factor of 12 (😮)
In ages 70+, they are approximately equal.
Clearly the numbers reflect both incidence and severity.
In ages 5-9, flu detections outnumber covid by a factor of 12 (😮)
In ages 70+, they are approximately equal.
BTW here are the numbers for all Australia for the year to date, broken out by state and age group.
www.health.gov.au/sites/defaul...
www.health.gov.au/sites/defaul...

November 9, 2025 at 1:24 AM
BTW here are the numbers for all Australia for the year to date, broken out by state and age group.
www.health.gov.au/sites/defaul...
www.health.gov.au/sites/defaul...
The WellKiwis infection survey in Wellington, NZ also has twice as many influenza infections as covid infections from 31 March to 19 October 2025. So I think it's quite plausible symptomatic flu:covid infections are running around 2:1 in 2025.
www.wellkiwis.co.nz/news-and-fin...
www.wellkiwis.co.nz/news-and-fin...

November 7, 2025 at 7:45 AM
The WellKiwis infection survey in Wellington, NZ also has twice as many influenza infections as covid infections from 31 March to 19 October 2025. So I think it's quite plausible symptomatic flu:covid infections are running around 2:1 in 2025.
www.wellkiwis.co.nz/news-and-fin...
www.wellkiwis.co.nz/news-and-fin...
Yes! (I knew this would be confusing 😀)

October 31, 2025 at 5:50 AM
Yes! (I knew this would be confusing 😀)
1) You are welcome to look up the studies for yourself.
2) Leslie was talking about wearing masks in public, not the healthcare setting.
2) Leslie was talking about wearing masks in public, not the healthcare setting.

October 31, 2025 at 1:14 AM
1) You are welcome to look up the studies for yourself.
2) Leslie was talking about wearing masks in public, not the healthcare setting.
2) Leslie was talking about wearing masks in public, not the healthcare setting.
The authors didn't even discuss the fringe "immunity theft" hypothesis (Covid-19 is damaging immune response to other diseases).
But the robust finding of a net negative impact of the pandemic on other inf. diseases argues strongly against "immunity theft".
(No, Covid isn't airborne AIDS)
3/3
But the robust finding of a net negative impact of the pandemic on other inf. diseases argues strongly against "immunity theft".
(No, Covid isn't airborne AIDS)
3/3

October 31, 2025 at 1:09 AM
The authors didn't even discuss the fringe "immunity theft" hypothesis (Covid-19 is damaging immune response to other diseases).
But the robust finding of a net negative impact of the pandemic on other inf. diseases argues strongly against "immunity theft".
(No, Covid isn't airborne AIDS)
3/3
But the robust finding of a net negative impact of the pandemic on other inf. diseases argues strongly against "immunity theft".
(No, Covid isn't airborne AIDS)
3/3
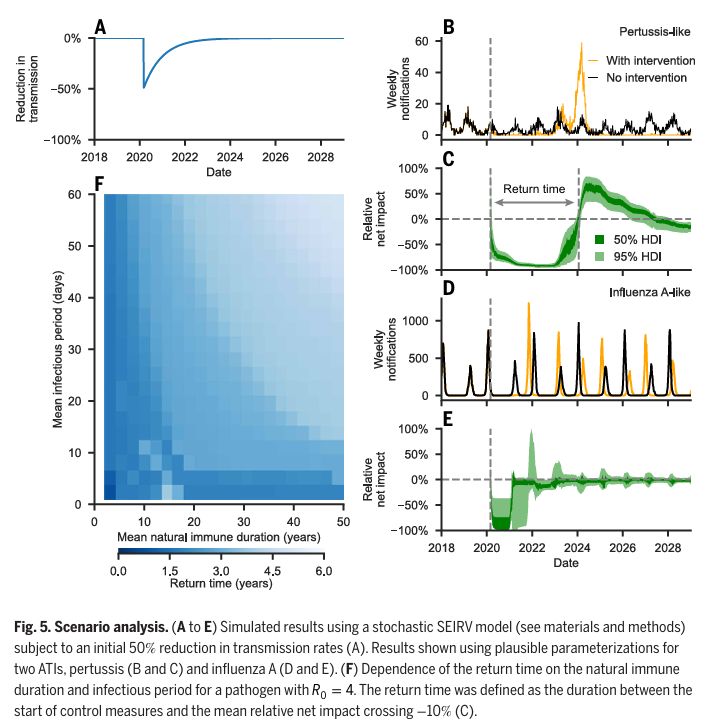
The authors also identify some disease scenarios where a short-term positive net impact is observed ("pertussis-like" in figure below) but the long-term impact is still negative.
2/
2/
October 31, 2025 at 1:09 AM
The authors also identify some disease scenarios where a short-term positive net impact is observed ("pertussis-like" in figure below) but the long-term impact is still negative.
2/
2/
The Australian Bureau of Statistics has quietly noted a grim milestone today; more deaths due to influenza than due to Covid-19 were recorded in August (and also so far in September) in Australia this year, first time since March 2020.
www.abs.gov.au/statistics/h...
www.abs.gov.au/statistics/h...

October 30, 2025 at 12:52 AM
The Australian Bureau of Statistics has quietly noted a grim milestone today; more deaths due to influenza than due to Covid-19 were recorded in August (and also so far in September) in Australia this year, first time since March 2020.
www.abs.gov.au/statistics/h...
www.abs.gov.au/statistics/h...
Here are the two datasets aligned in time. How can the huge peak in hospitalizations occur during a time of historic lows in emergency department visits for respiratory diseases?
3/
3/

October 29, 2025 at 3:59 AM
Here are the two datasets aligned in time. How can the huge peak in hospitalizations occur during a time of historic lows in emergency department visits for respiratory diseases?
3/
3/
Yet the Covid-19 Resources Canada model is showing Covid-19 hospitalizations at levels near 2022 peaks.
It is simply impossible for 2022 levels of hospitalizations for disease to go unnoticed.
2/
It is simply impossible for 2022 levels of hospitalizations for disease to go unnoticed.
2/

October 29, 2025 at 3:59 AM
Yet the Covid-19 Resources Canada model is showing Covid-19 hospitalizations at levels near 2022 peaks.
It is simply impossible for 2022 levels of hospitalizations for disease to go unnoticed.
2/
It is simply impossible for 2022 levels of hospitalizations for disease to go unnoticed.
2/
This model is producing simply implausible results.
For example, emergency department visits for *all* respiratory disease are at historic lows (lower then the same month in 2016-2019). (Note: this does not depend on covid-19 testing!)
1/
www.kflaphi.ca/viral-respir...
For example, emergency department visits for *all* respiratory disease are at historic lows (lower then the same month in 2016-2019). (Note: this does not depend on covid-19 testing!)
1/
www.kflaphi.ca/viral-respir...

October 29, 2025 at 3:59 AM
This model is producing simply implausible results.
For example, emergency department visits for *all* respiratory disease are at historic lows (lower then the same month in 2016-2019). (Note: this does not depend on covid-19 testing!)
1/
www.kflaphi.ca/viral-respir...
For example, emergency department visits for *all* respiratory disease are at historic lows (lower then the same month in 2016-2019). (Note: this does not depend on covid-19 testing!)
1/
www.kflaphi.ca/viral-respir...
I should point out: One reason that it's silly to try to make such a model as I've done in this thread is that other countries don't show any consistent covid seasonality at all. So again, there's *no* expectation that my silly model will be predictive!
Netherlands infection survey below.
Netherlands infection survey below.

October 19, 2025 at 9:44 PM
I should point out: One reason that it's silly to try to make such a model as I've done in this thread is that other countries don't show any consistent covid seasonality at all. So again, there's *no* expectation that my silly model will be predictive!
Netherlands infection survey below.
Netherlands infection survey below.
There are some differences in seasonality in the other hCoVs. Also for other viruses, including rhinoviruses, which might be important as they interfere with covid.


October 19, 2025 at 9:29 PM
There are some differences in seasonality in the other hCoVs. Also for other viruses, including rhinoviruses, which might be important as they interfere with covid.
But we can see how it does. To the extent that it does well, covid is boring: it is "seasonal" by definition (time is the only explanatory variable in the model) and completely predictable. To the extent it does poorly, other factors matter.
4/
4/

October 18, 2025 at 10:30 PM
But we can see how it does. To the extent that it does well, covid is boring: it is "seasonal" by definition (time is the only explanatory variable in the model) and completely predictable. To the extent it does poorly, other factors matter.
4/
4/
There's NO expectation that this should be correct!
The exponential decay almost has to be wrong sometime in the future. (My expectation was that it would have stopped before 2025!)
No accounting for variants, vaccine match, vaccine uptake, etc. etc.
3/
The exponential decay almost has to be wrong sometime in the future. (My expectation was that it would have stopped before 2025!)
No accounting for variants, vaccine match, vaccine uptake, etc. etc.
3/
October 18, 2025 at 10:30 PM
There's NO expectation that this should be correct!
The exponential decay almost has to be wrong sometime in the future. (My expectation was that it would have stopped before 2025!)
No accounting for variants, vaccine match, vaccine uptake, etc. etc.
3/
The exponential decay almost has to be wrong sometime in the future. (My expectation was that it would have stopped before 2025!)
No accounting for variants, vaccine match, vaccine uptake, etc. etc.
3/
The model is just an exponential decay fit to 2022-2025, multiplied by a "seasonal" factor for each epi-week of the year, taken from average of 2023 and 2024.
2/
2/
October 18, 2025 at 10:30 PM
The model is just an exponential decay fit to 2022-2025, multiplied by a "seasonal" factor for each epi-week of the year, taken from average of 2023 and 2024.
2/
2/
I made a really silly model for predicting future covid waves.
The model is: "Covid will do what it does every year, but a little less". Purely observational, no epidemiology in it at all.
I think it's useful as a null hypothesis - any causal prediction/explanation should have to do better.
1/
The model is: "Covid will do what it does every year, but a little less". Purely observational, no epidemiology in it at all.
I think it's useful as a null hypothesis - any causal prediction/explanation should have to do better.
1/
October 18, 2025 at 10:30 PM
I made a really silly model for predicting future covid waves.
The model is: "Covid will do what it does every year, but a little less". Purely observational, no epidemiology in it at all.
I think it's useful as a null hypothesis - any causal prediction/explanation should have to do better.
1/
The model is: "Covid will do what it does every year, but a little less". Purely observational, no epidemiology in it at all.
I think it's useful as a null hypothesis - any causal prediction/explanation should have to do better.
1/
Last: Astute observers probably noticed that non-covid hospital/ICU occupancy *dips* during a covid wave.
Why? I don't know. Two guesses: Triage in admissions during covid surges to conserve hospital beds, or, incidental hospitalization "with" covid. Maybe there are other explanations?
13/13
Why? I don't know. Two guesses: Triage in admissions during covid surges to conserve hospital beds, or, incidental hospitalization "with" covid. Maybe there are other explanations?
13/13
October 16, 2025 at 2:13 AM
Last: Astute observers probably noticed that non-covid hospital/ICU occupancy *dips* during a covid wave.
Why? I don't know. Two guesses: Triage in admissions during covid surges to conserve hospital beds, or, incidental hospitalization "with" covid. Maybe there are other explanations?
13/13
Why? I don't know. Two guesses: Triage in admissions during covid surges to conserve hospital beds, or, incidental hospitalization "with" covid. Maybe there are other explanations?
13/13
None of this is to say that Covid-19 isn't still a problem. Year-round, it is still causing a burden of disease and death comparable to influenza (all three circulating strains together!) which is a huge new burden of disease. Get vaccinated yearly!
10/
10/
October 16, 2025 at 2:13 AM
None of this is to say that Covid-19 isn't still a problem. Year-round, it is still causing a burden of disease and death comparable to influenza (all three circulating strains together!) which is a huge new burden of disease. Get vaccinated yearly!
10/
10/
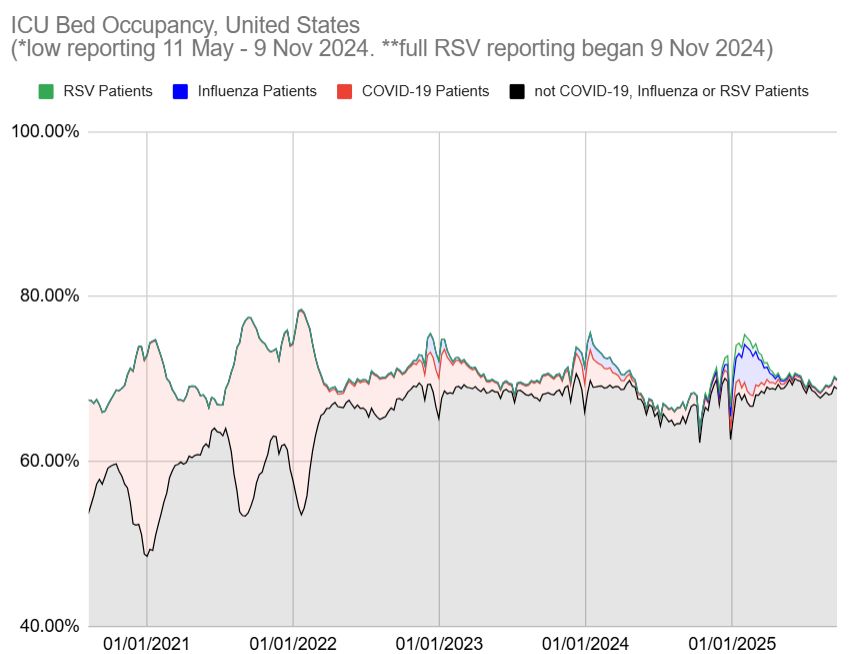
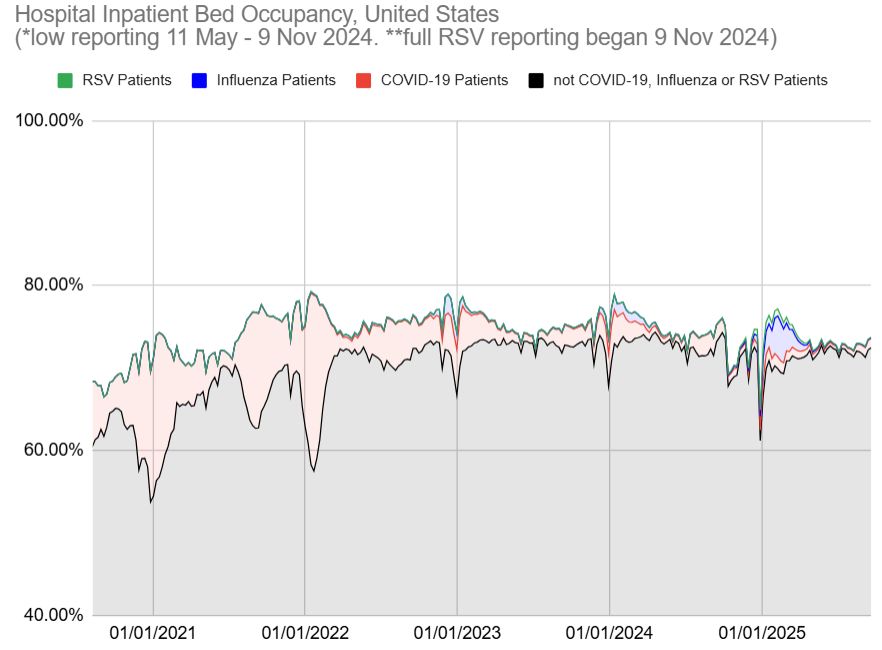
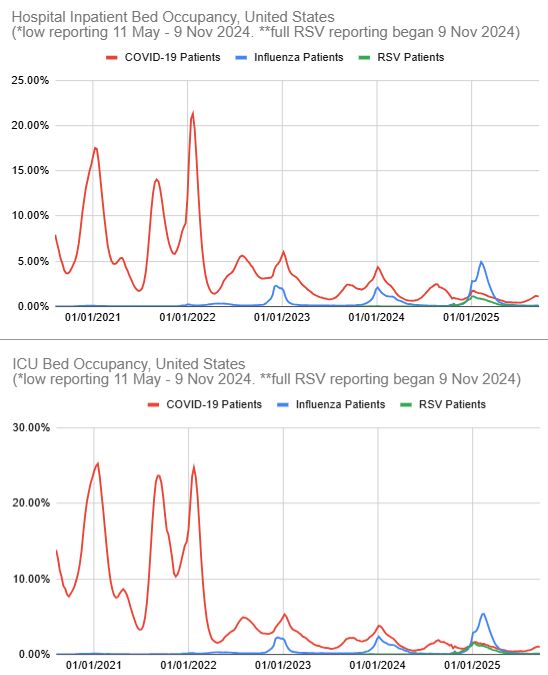
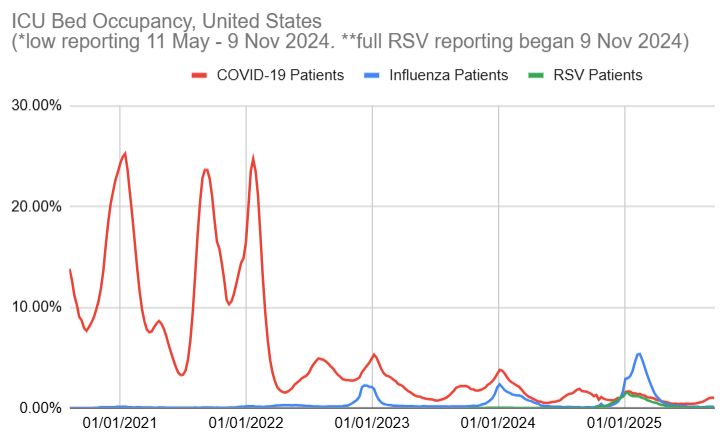
Looking at just the Covid-19, influenza, and RSV occupancies tells a similar story: Covid-19 nowadays causes waves of hospital/ICU occupancy smaller than seasonal flu and comparable to seasonal RSV.
6/
6/

October 16, 2025 at 2:13 AM
Looking at just the Covid-19, influenza, and RSV occupancies tells a similar story: Covid-19 nowadays causes waves of hospital/ICU occupancy smaller than seasonal flu and comparable to seasonal RSV.
6/
6/
This past winter 2024-25 was the worst flu season in a decade, and that shows up here - there was a winter wave of all-cause hospital/ICU occupancy in 2024-25, well explained by flu patients (blue) plus some Covid-19 and RSV.
5/
5/


October 16, 2025 at 2:13 AM
This past winter 2024-25 was the worst flu season in a decade, and that shows up here - there was a winter wave of all-cause hospital/ICU occupancy in 2024-25, well explained by flu patients (blue) plus some Covid-19 and RSV.
5/
5/
But as the pandemic has subsided, occupancy by Covid-19 patients has dropped, and so have the size of the waves of all-cause occupancy. There are no missed, undetected waves of Covid-19 patients in hospital/ICU due to reduced testing (though testing probably has reduced).
4/
4/


October 16, 2025 at 2:13 AM
But as the pandemic has subsided, occupancy by Covid-19 patients has dropped, and so have the size of the waves of all-cause occupancy. There are no missed, undetected waves of Covid-19 patients in hospital/ICU due to reduced testing (though testing probably has reduced).
4/
4/