


Maxojir
@maxojir.bsky.social
Abide in Christ
I'm Michael. I maintain a free-to-access database of energy & resource graphs along with making YouTube videos & streams covering the same subjects. Now working on the hopefully to-be 2D animated series Dreamwar.
I'm Michael. I maintain a free-to-access database of energy & resource graphs along with making YouTube videos & streams covering the same subjects. Now working on the hopefully to-be 2D animated series Dreamwar.

Updated some birth rate (TFR) graphs for a few countries with the latest data indicators. Available among hundreds of other graphs of all kinds in the Drive folder linked in my pinned post.
#demographics #BirthRate #population #TFR #FertilityRate #Argentina #Italy #Itallia #Mexico #Egypt #Masr
#demographics #BirthRate #population #TFR #FertilityRate #Argentina #Italy #Itallia #Mexico #Egypt #Masr


August 4, 2025 at 6:44 AM
Updated some birth rate (TFR) graphs for a few countries with the latest data indicators. Available among hundreds of other graphs of all kinds in the Drive folder linked in my pinned post.
#demographics #BirthRate #population #TFR #FertilityRate #Argentina #Italy #Itallia #Mexico #Egypt #Masr
#demographics #BirthRate #population #TFR #FertilityRate #Argentina #Italy #Itallia #Mexico #Egypt #Masr
Screenshots from the EIA power grid monitor. USA broke its electricity demand record today, hitting a grid load of 752 gigawatts an hour ago, and a height of 756 just before that. Prior record was 743 set two years ago in August of 2023. #Electricity #Energy #USA #HeatWave #RecordHigh


July 28, 2025 at 11:50 PM
Screenshots from the EIA power grid monitor. USA broke its electricity demand record today, hitting a grid load of 752 gigawatts an hour ago, and a height of 756 just before that. Prior record was 743 set two years ago in August of 2023. #Electricity #Energy #USA #HeatWave #RecordHigh
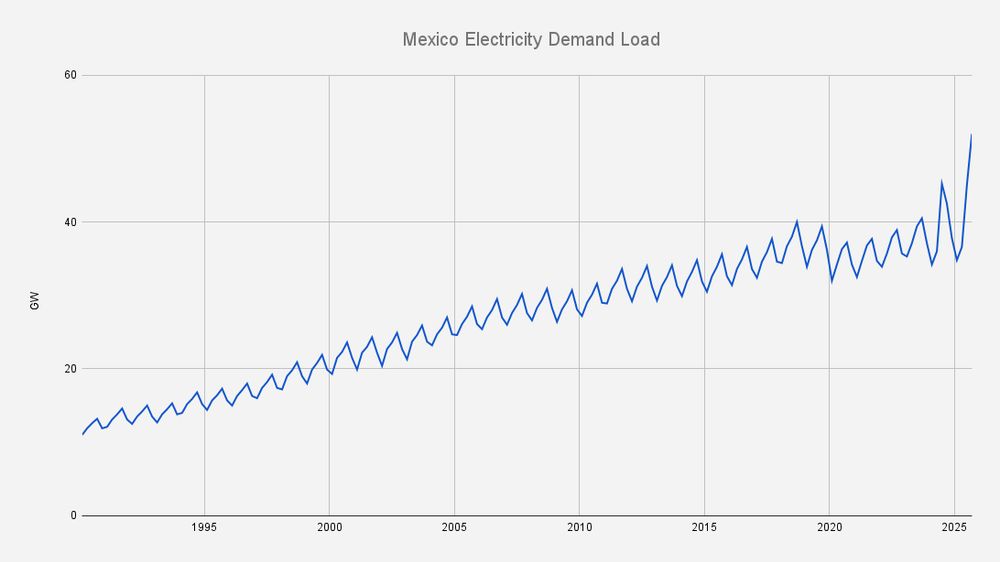
Mexico hit a new record for average electricity demand load across its grid. Seeing a 53 Gigawatt average earlier this month, AND setting a new 1-hour/single-point demand record of 81 at one point on a specific day, beating the prior single-point record of 76. #Mexico #Energy #Electricity
July 27, 2025 at 2:53 AM
Mexico hit a new record for average electricity demand load across its grid. Seeing a 53 Gigawatt average earlier this month, AND setting a new 1-hour/single-point demand record of 81 at one point on a specific day, beating the prior single-point record of 76. #Mexico #Energy #Electricity
I'll upload different types of graphs again soon.
For now, a population projection comparison chart for India, with prior assumptions based on data from a few years ago, vs their new trajectory updated with their 2025 data. #India #Demographics #Population #PopulationPeak #BirthRate
For now, a population projection comparison chart for India, with prior assumptions based on data from a few years ago, vs their new trajectory updated with their 2025 data. #India #Demographics #Population #PopulationPeak #BirthRate

July 25, 2025 at 5:46 AM
I'll upload different types of graphs again soon.
For now, a population projection comparison chart for India, with prior assumptions based on data from a few years ago, vs their new trajectory updated with their 2025 data. #India #Demographics #Population #PopulationPeak #BirthRate
For now, a population projection comparison chart for India, with prior assumptions based on data from a few years ago, vs their new trajectory updated with their 2025 data. #India #Demographics #Population #PopulationPeak #BirthRate
2 Updated Population curves for comparison on a stacked graph. China's current trajectory (with TFR of 1.0) vs their adjusted curve if their birth rate falls further to 0.8 like Korea & Taiwan. #China #Population #PopulationDecline #Demographics #PopulationCollapse #DemographicCollapse

July 21, 2025 at 5:31 AM
2 Updated Population curves for comparison on a stacked graph. China's current trajectory (with TFR of 1.0) vs their adjusted curve if their birth rate falls further to 0.8 like Korea & Taiwan. #China #Population #PopulationDecline #Demographics #PopulationCollapse #DemographicCollapse
Stacked graph of 3 USA demographic curves. 1st - prior assumptions of a plateau around 373 million, 2nd most updated one, peaking near 367 then slow decline, & a "reduced immigration" scenario (25% reduced intake due to changing policies & attitudes) #USA #demographics #population #PopulationDecline

July 20, 2025 at 7:11 AM
Stacked graph of 3 USA demographic curves. 1st - prior assumptions of a plateau around 373 million, 2nd most updated one, peaking near 367 then slow decline, & a "reduced immigration" scenario (25% reduced intake due to changing policies & attitudes) #USA #demographics #population #PopulationDecline
Re-working data after some time, even the US is now on course to eventually undergo population decline (although a gradual one) instead of a plateau like formerly believed. Here's both the prior & updated projections for comparison. #USA #demographics #population #BirthRate #populationdecline


July 17, 2025 at 1:41 AM
Re-working data after some time, even the US is now on course to eventually undergo population decline (although a gradual one) instead of a plateau like formerly believed. Here's both the prior & updated projections for comparison. #USA #demographics #population #BirthRate #populationdecline
Made graphs for some of the smaller oil producing states, however big they may have been in the past; ones whose production has been & is conventional, no shale ( Louisiana has shale gas, but not oil).
#oilandgas #energy #oilproduction #Louisiana #Kansas #California #Illinois
#oilandgas #energy #oilproduction #Louisiana #Kansas #California #Illinois


July 10, 2025 at 6:16 AM
Made graphs for some of the smaller oil producing states, however big they may have been in the past; ones whose production has been & is conventional, no shale ( Louisiana has shale gas, but not oil).
#oilandgas #energy #oilproduction #Louisiana #Kansas #California #Illinois
#oilandgas #energy #oilproduction #Louisiana #Kansas #California #Illinois
Some more states' oil production graphs showing conventional vs shale. Offshore is the only avenue in the US were conventional output is still rising, elsewhere it's conventional depletion underlying balloons of shale. #oilandgas #energy #shale #NorthDakota #NewMexico #Oklahoma #GulfOfMexico


July 9, 2025 at 6:52 AM
Some more states' oil production graphs showing conventional vs shale. Offshore is the only avenue in the US were conventional output is still rising, elsewhere it's conventional depletion underlying balloons of shale. #oilandgas #energy #shale #NorthDakota #NewMexico #Oklahoma #GulfOfMexico
While shale comprises the majority of Texas's output now, there is still between 700 and 800 thousand barrels per day of conventional oil production underlying it, declining in the background by a few percent per year. #oilandgas #Texas #shale #shaleoil

July 7, 2025 at 8:24 AM
While shale comprises the majority of Texas's output now, there is still between 700 and 800 thousand barrels per day of conventional oil production underlying it, declining in the background by a few percent per year. #oilandgas #Texas #shale #shaleoil
Algeria's potential/likely oil & gas baring regions (beige & red) were never fully explored, all production has come from fields in the already-explored area (red). New oil & gas surveys and exploratory drilling have just now begun expanding further. #oilandgas #energy #Algeria #Africa #NorthAfrica

June 28, 2025 at 8:32 AM
Algeria's potential/likely oil & gas baring regions (beige & red) were never fully explored, all production has come from fields in the already-explored area (red). New oil & gas surveys and exploratory drilling have just now begun expanding further. #oilandgas #energy #Algeria #Africa #NorthAfrica
Although slowing down, global oil demand still is increasing, now just over 104 million barrels per day as of this summer. #oilandgas #oil #energy #petroleum #commodities

June 27, 2025 at 6:46 AM
Although slowing down, global oil demand still is increasing, now just over 104 million barrels per day as of this summer. #oilandgas #oil #energy #petroleum #commodities
Some countries have very visible historical markers on their CO2 emissions charts. With France, you can see the swift drop that started in the 1970s carrying through the 80s, as they massively switched from coal to Nuclear power for electricity. #CO2 #Nuclear #France #nuclearpower #energy #climate

June 19, 2025 at 7:05 AM
Venezuela is one of the countries whose oil production goes back the longest, beginning back in the early half of the 1920s. Various higher periods allude to it's true capability levels, but repeating national collapses have kept it withheld. #oilandgas #energy #Venezuela #petroleum #history

June 16, 2025 at 8:51 AM
Venezuela is one of the countries whose oil production goes back the longest, beginning back in the early half of the 1920s. Various higher periods allude to it's true capability levels, but repeating national collapses have kept it withheld. #oilandgas #energy #Venezuela #petroleum #history
The Philippines remains the nation with the largest contribution from geothermal. Rapid electricity demand growth has shrunk its percentage, but geothermal still accounts for 8% of the country's power supply #Philippines #energy #geothermal #renewables #renewableenergy

June 14, 2025 at 9:16 AM
The Philippines remains the nation with the largest contribution from geothermal. Rapid electricity demand growth has shrunk its percentage, but geothermal still accounts for 8% of the country's power supply #Philippines #energy #geothermal #renewables #renewableenergy

Brasil is continuing to restore oil production formerly shut down for long maintenance, as well activating new expansions, now up to 3.81 million barrels per day and likely going over 4 soon. #oilandgas #energy #Brazil #petroleum #commodities

June 9, 2025 at 7:55 AM
Brasil is continuing to restore oil production formerly shut down for long maintenance, as well activating new expansions, now up to 3.81 million barrels per day and likely going over 4 soon. #oilandgas #energy #Brazil #petroleum #commodities
Kazakhstan's oil production continues to grow, as capacity expansions at the Tengiz field come online, along with other smaller projects, with the country's total output now at 2.21 million barrels per day. #oilandgas #energy #Kazakhstan #Oil #petroleum #CentralAsia

June 5, 2025 at 7:50 AM
Kazakhstan's oil production continues to grow, as capacity expansions at the Tengiz field come online, along with other smaller projects, with the country's total output now at 2.21 million barrels per day. #oilandgas #energy #Kazakhstan #Oil #petroleum #CentralAsia
A lesser-known indicator of the upcoming Chinese invasion of Taiwan, is Taiwan quietly shutting down their nuclear powerplants (just in case they get struck). Now dialed down below 5% grid contribution #Taiwan #China #energy #electricity #ChinaTaiwan #TaiwanInvasion

June 3, 2025 at 8:15 AM
A lesser-known indicator of the upcoming Chinese invasion of Taiwan, is Taiwan quietly shutting down their nuclear powerplants (just in case they get struck). Now dialed down below 5% grid contribution #Taiwan #China #energy #electricity #ChinaTaiwan #TaiwanInvasion
While stereotyped otherwise, Latin American countries' birth rates have also crashed. Chile in particular now is looking at a steep population decline starting around 2035, and likely to lose half its population in a span of 40 years. #Chile #LatinAmerica #SouthAmerica #demographics #birthrate

June 1, 2025 at 7:37 AM
While stereotyped otherwise, Latin American countries' birth rates have also crashed. Chile in particular now is looking at a steep population decline starting around 2035, and likely to lose half its population in a span of 40 years. #Chile #LatinAmerica #SouthAmerica #demographics #birthrate
While most mentally associate the metal with ammunition, the overwhelming majority of the metal Lead is actually used to make Lead-Acid batteries for ground vehicle engines (cars, trucks, lorries, construction vehicles). #Lead #commodities #Pb #metals #FactOfTheDay

May 31, 2025 at 6:29 AM
While most mentally associate the metal with ammunition, the overwhelming majority of the metal Lead is actually used to make Lead-Acid batteries for ground vehicle engines (cars, trucks, lorries, construction vehicles). #Lead #commodities #Pb #metals #FactOfTheDay
While Vietnam likely still has a moderate amount of offshore oil remaining, it's unable to explore in most areas because of China building artificial island throughout the South China Sea and then forcibly claiming all the waters around them. #oilandgas #energy #petroleum #Vietnam #southeastasia

May 29, 2025 at 7:41 AM
While Vietnam likely still has a moderate amount of offshore oil remaining, it's unable to explore in most areas because of China building artificial island throughout the South China Sea and then forcibly claiming all the waters around them. #oilandgas #energy #petroleum #Vietnam #southeastasia
A large part of the remaining power generation component of oil demand is mainly due to Saudi Arabia, which is still generating roughly 1/3 of its electricity from oil-fired power plants.
#oilandgas #SaudiArabia #energy #electricity #powerplants #middleeast
#oilandgas #SaudiArabia #energy #electricity #powerplants #middleeast

May 27, 2025 at 7:51 AM
A large part of the remaining power generation component of oil demand is mainly due to Saudi Arabia, which is still generating roughly 1/3 of its electricity from oil-fired power plants.
#oilandgas #SaudiArabia #energy #electricity #powerplants #middleeast
#oilandgas #SaudiArabia #energy #electricity #powerplants #middleeast
Thailand's fertility rate continues to drop, now falling to 0.86 children per woman as of this year. #demographics #population #birthrate #birthrates #Thailand #southeastasia

May 26, 2025 at 6:59 AM
Thailand's fertility rate continues to drop, now falling to 0.86 children per woman as of this year. #demographics #population #birthrate #birthrates #Thailand #southeastasia