


@marketmaker2757.bsky.social
Account is dedicated toward speaking out against Election interference mis/disinformation by highlighting methodological and measurement flaws
Advantage gambler
Advantage gambler
Found it in the 2024 CSV through this link. Thanks!

November 16, 2025 at 5:32 PM
Found it in the 2024 CSV through this link. Thanks!

November 16, 2025 at 5:06 PM

@grassrootsspeak.bsky.social I see you’ve doubled down on this in your latest release. Can you explain why you think it’s weird that these percentages remained consistent?
Basic arithmetic says they should remain consistent based on the total number of RV and the average number of RV
Basic arithmetic says they should remain consistent based on the total number of RV and the average number of RV

November 11, 2025 at 11:29 PM
@grassrootsspeak.bsky.social I see you’ve doubled down on this in your latest release. Can you explain why you think it’s weird that these percentages remained consistent?
Basic arithmetic says they should remain consistent based on the total number of RV and the average number of RV
Basic arithmetic says they should remain consistent based on the total number of RV and the average number of RV
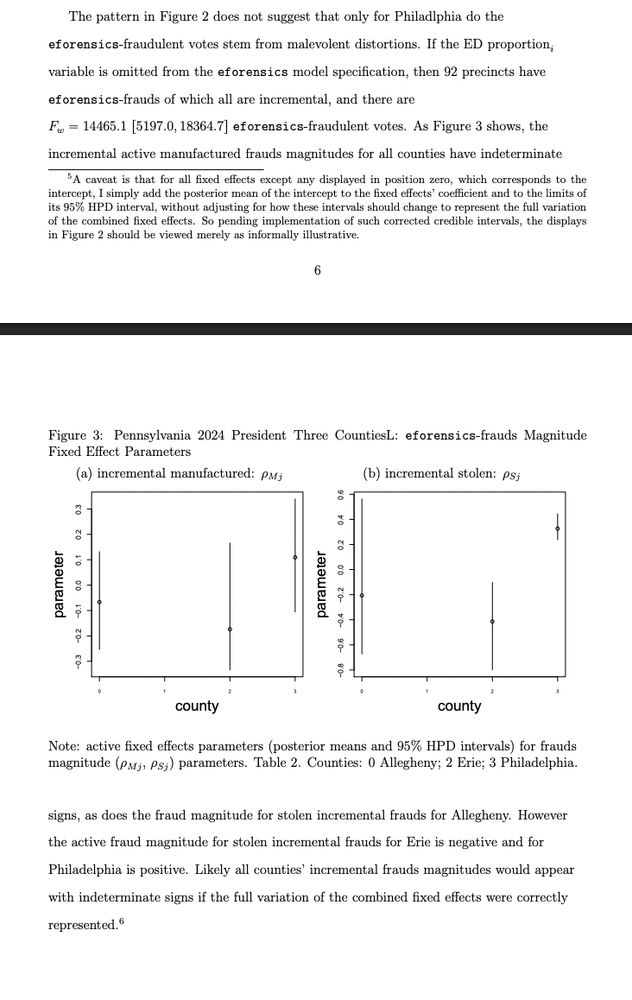
And what he says would happen precisely happens in the full report, although again the figures here are only illustrative (same footnote) and not exact, but directionally correct and not anything close to what ETA reported in their lawsuit for Allegegny


November 11, 2025 at 5:58 PM
And what he says would happen precisely happens in the full report, although again the figures here are only illustrative (same footnote) and not exact, but directionally correct and not anything close to what ETA reported in their lawsuit for Allegegny
Adding these screenshots for context. Allegheny is in position 0 here and apparently the footnote does not apply if I am interpreting correctly. But the last paragraph is key

November 11, 2025 at 5:18 PM
Adding these screenshots for context. Allegheny is in position 0 here and apparently the footnote does not apply if I am interpreting correctly. But the last paragraph is key
Funny enough. The edited fake circles didn’t make it into the lawsuit

November 10, 2025 at 9:03 PM
Funny enough. The edited fake circles didn’t make it into the lawsuit
They are doing the more votes than voters thing

November 7, 2025 at 2:53 AM
They are doing the more votes than voters thing
Im pretty sure they screwed this CI up

November 7, 2025 at 12:59 AM
Im pretty sure they screwed this CI up
Heaven forbid a democrat wins a D+15 state by 15 😂

November 6, 2025 at 3:55 PM
Heaven forbid a democrat wins a D+15 state by 15 😂
Smfh head man. Just take the L

November 6, 2025 at 3:48 PM
Smfh head man. Just take the L
Okay, if I understand correctly, you’re saying for the specific day you’re talking about (could you share which day), the number on the ticker doesn’t match the number from the file you were provided?

October 20, 2025 at 8:34 PM
Okay, if I understand correctly, you’re saying for the specific day you’re talking about (could you share which day), the number on the ticker doesn’t match the number from the file you were provided?
I screenshotted the wrong November report. The other one has the correct total, but it's a little easier to derive where the total is on this one

October 20, 2025 at 8:04 PM
I screenshotted the wrong November report. The other one has the correct total, but it's a little easier to derive where the total is on this one
@grassrootsspeak.bsky.social
Could you please clarify where exactly your figures come from?
I have posted screenshots of the official county numbers from October and November from St. Lucie. I have also posted the Book closing report figure from the state. They are contradicting
Could you please clarify where exactly your figures come from?
I have posted screenshots of the official county numbers from October and November from St. Lucie. I have also posted the Book closing report figure from the state. They are contradicting


October 20, 2025 at 8:00 PM
@grassrootsspeak.bsky.social
Could you please clarify where exactly your figures come from?
I have posted screenshots of the official county numbers from October and November from St. Lucie. I have also posted the Book closing report figure from the state. They are contradicting
Could you please clarify where exactly your figures come from?
I have posted screenshots of the official county numbers from October and November from St. Lucie. I have also posted the Book closing report figure from the state. They are contradicting
Adding this so people know your CVAP claim is legit.

October 20, 2025 at 2:34 AM
Adding this so people know your CVAP claim is legit.
1716 October and November 2024 splits


October 18, 2025 at 3:43 PM
1716 October and November 2024 splits

Histogram below is neither non human or abnormal

October 9, 2025 at 3:46 PM
Histogram below is neither non human or abnormal
Partial regression plots when you add 2020 vote share as a control. Omits about 200 precincts because they did not have matches from the 2020 results file

October 9, 2025 at 3:46 AM
Partial regression plots when you add 2020 vote share as a control. Omits about 200 precincts because they did not have matches from the 2020 results file
statewide machine and statewide all precincts.


October 9, 2025 at 3:46 AM
statewide machine and statewide all precincts.
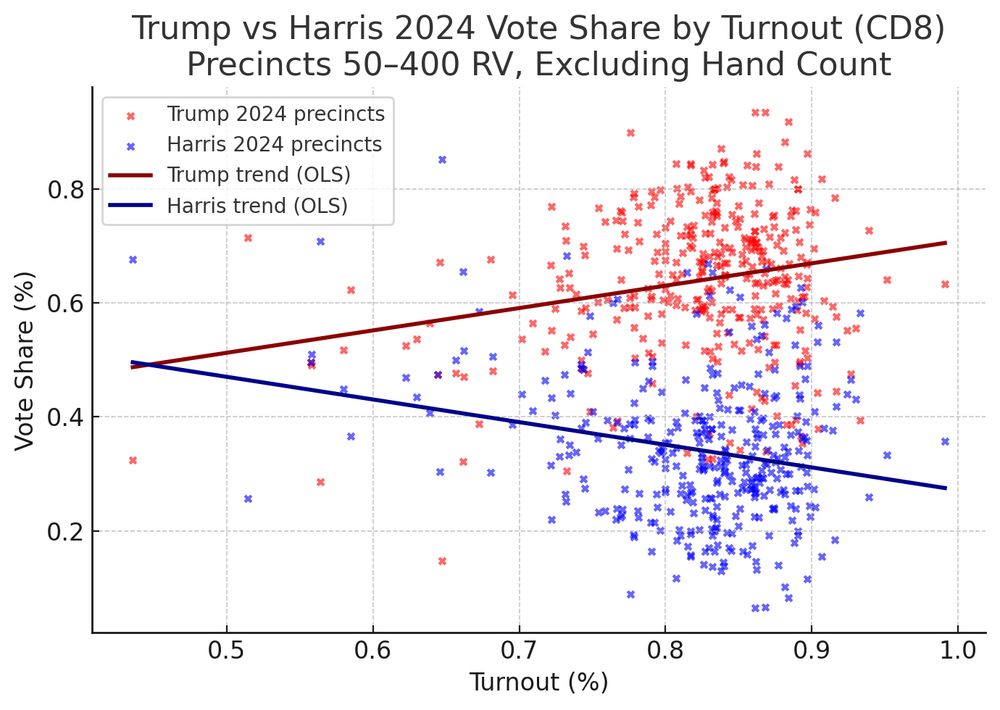
These are their lines, the fake lines. my lines are real

October 9, 2025 at 1:09 AM
These are their lines, the fake lines. my lines are real
Why does your "non partisan organization" continue to make obviously fake trend lines
October 9, 2025 at 12:54 AM
Why does your "non partisan organization" continue to make obviously fake trend lines
I realized this morning there are buttons within the analysis that provide versions of the plots with the r square and equation.
Of course it’s just a straightforward regression… the assumption of independence is violated but never discussed.
The R squared is probably fine
Of course it’s just a straightforward regression… the assumption of independence is violated but never discussed.
The R squared is probably fine

October 6, 2025 at 2:34 PM
I realized this morning there are buttons within the analysis that provide versions of the plots with the r square and equation.
Of course it’s just a straightforward regression… the assumption of independence is violated but never discussed.
The R squared is probably fine
Of course it’s just a straightforward regression… the assumption of independence is violated but never discussed.
The R squared is probably fine

3/ That said, I ran the precinct level model this morning. The results are consistent: turnout alone looks correlated with Trump share, but the effect disappears once you control for party registration or racial composition.

October 2, 2025 at 9:19 PM
3/ That said, I ran the precinct level model this morning. The results are consistent: turnout alone looks correlated with Trump share, but the effect disappears once you control for party registration or racial composition.