


Alan McConchie
@mappingmashups.net
Was @mappingmashups on Twitter. Now I’m all-in on Mastodon, so go follow me there: https://subdued.social/@alan
Just here to run the socials for @stamen.com and to nag you all to join Mastodon.
Advocate of the #BellinghamWA hashtag
Just here to run the socials for @stamen.com and to nag you all to join Mastodon.
Advocate of the #BellinghamWA hashtag
We managed to go 7 years since the last proposal to partition #California. I just updated #Wikipedia with a map of the latest Republican plan to split off inland California from the coastal counties. (And no, it's never going to happen).
en.wikipedia.org/wiki/Partiti...
en.wikipedia.org/wiki/Partiti...

August 28, 2025 at 5:52 PM
We managed to go 7 years since the last proposal to partition #California. I just updated #Wikipedia with a map of the latest Republican plan to split off inland California from the coastal counties. (And no, it's never going to happen).
en.wikipedia.org/wiki/Partiti...
en.wikipedia.org/wiki/Partiti...
A great article from @sightline.org about how Proportional Representation would benefit Whatcom County: www.sightline.org/2025/04/10/w...
#BellinghamWA
#BellinghamWA

April 10, 2025 at 5:54 PM
A great article from @sightline.org about how Proportional Representation would benefit Whatcom County: www.sightline.org/2025/04/10/w...
#BellinghamWA
#BellinghamWA
Final update of this chart for day 43, now that the results have been finalized and the Electoral College has met. In the end, Trump has 49.9% of the total vote. The 4.7 million vote gap between Trump and Harris on election night narrowed to 2.3 million by the time all the votes were counted.

December 18, 2024 at 11:16 PM
Final update of this chart for day 43, now that the results have been finalized and the Electoral College has met. In the end, Trump has 49.9% of the total vote. The 4.7 million vote gap between Trump and Harris on election night narrowed to 2.3 million by the time all the votes were counted.
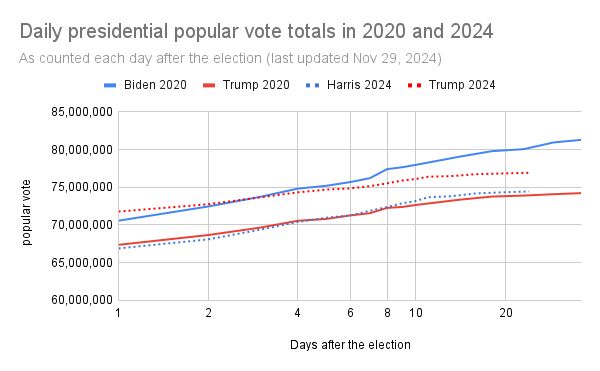
Updated for day 24. The curves are no longer growing logarithmically so I removed the trendline. I think we're very close to the final numbers now.

November 29, 2024 at 10:12 PM
Updated for day 24. The curves are no longer growing logarithmically so I removed the trendline. I think we're very close to the final numbers now.
I updated the chart of popular vote totals for day 20. The lines for 2024 continue to flatten out, suggesting that we are counting votes faster this time than in 2020.
Although it's hard to see on the chart, Harris's 2024 votes (so far) have now passed Trump's final totals from 2020.
Although it's hard to see on the chart, Harris's 2024 votes (so far) have now passed Trump's final totals from 2020.


November 25, 2024 at 11:48 PM
I updated the chart of popular vote totals for day 20. The lines for 2024 continue to flatten out, suggesting that we are counting votes faster this time than in 2020.
Although it's hard to see on the chart, Harris's 2024 votes (so far) have now passed Trump's final totals from 2020.
Although it's hard to see on the chart, Harris's 2024 votes (so far) have now passed Trump's final totals from 2020.
Updated for day 16:

November 21, 2024 at 9:16 PM
Updated for day 16:
And here is the same popular vote count chart, plotted on a logarithmic scale, with a trend line fitted to each data series. Adjusting the X axis like this means that the trend shows up as a straight line.

November 19, 2024 at 7:06 PM
And here is the same popular vote count chart, plotted on a logarithmic scale, with a trend line fitted to each data series. Adjusting the X axis like this means that the trend shows up as a straight line.
Here's the presidential popular vote chart for day 14, compared with where the totals were at this time in 2020.
The gap between Trump and Harris continues to narrow (and Trump is about to drop below 50% of the total vote according to Wikipedia).
The gap between Trump and Harris continues to narrow (and Trump is about to drop below 50% of the total vote according to Wikipedia).

November 19, 2024 at 7:06 PM
Here's the presidential popular vote chart for day 14, compared with where the totals were at this time in 2020.
The gap between Trump and Harris continues to narrow (and Trump is about to drop below 50% of the total vote according to Wikipedia).
The gap between Trump and Harris continues to narrow (and Trump is about to drop below 50% of the total vote according to Wikipedia).
I updated my popular vote count chart for Day 11:

November 16, 2024 at 8:33 PM
I updated my popular vote count chart for Day 11:
Updated for day 8:

November 13, 2024 at 6:19 PM
Updated for day 8:
After the election, I saw a ton of hot-takes comparing the 2020 and 2024 popular vote totals. But are still millions of votes left to count, especially in places like California.
So I made a chart comparing 2024 so far with the same point in 2020, so you can see how many more votes to expect:
So I made a chart comparing 2024 so far with the same point in 2020, so you can see how many more votes to expect:

November 11, 2024 at 8:45 PM
After the election, I saw a ton of hot-takes comparing the 2020 and 2024 popular vote totals. But are still millions of votes left to count, especially in places like California.
So I made a chart comparing 2024 so far with the same point in 2020, so you can see how many more votes to expect:
So I made a chart comparing 2024 so far with the same point in 2020, so you can see how many more votes to expect:
Last month I gave a talk at the State of the Map US conference about our work migrating our famous @stamen.bsky.social OpenStreetMap-based map styles to a modern platform in partnership with Stadia Maps. Now you can watch the recorded video of the talk on YouTube:
www.youtube.com/watch?v=qewW...
www.youtube.com/watch?v=qewW...

July 3, 2024 at 6:27 PM
Last month I gave a talk at the State of the Map US conference about our work migrating our famous @stamen.bsky.social OpenStreetMap-based map styles to a modern platform in partnership with Stadia Maps. Now you can watch the recorded video of the talk on YouTube:
www.youtube.com/watch?v=qewW...
www.youtube.com/watch?v=qewW...

June 27, 2024 at 10:21 PM