


Maike Morrison
@maikemorrison.bsky.social
Building mathematical tools to answer biological questions
Ecology & evolution, sometimes microbiomes & cancer
Omidyar Fellow @SFIscience.bsky.social
Former PhD student with Noah Rosenberg, Stanford University
MaikeMorrison.com
Ecology & evolution, sometimes microbiomes & cancer
Omidyar Fellow @SFIscience.bsky.social
Former PhD student with Noah Rosenberg, Stanford University
MaikeMorrison.com
Thanks! Totally! We have a preprint using a similar framework to look at mutational signature heterogeneity across tumors (collab with @nalcala.bsky.social doi.org/10.1101/2023...) and we also used this framework to look at heterogeneity of immune cell infiltration (analysis not published yet).

Variability of mutational signatures is a footprint of carcinogens
Understanding the genomic impact of carcinogens is fundamental to cancer biology and prevention. However, recent coordinated efforts to detect such fingerprints have been largely unsuccessful, challen...
doi.org
March 17, 2025 at 6:59 PM
Thanks! Totally! We have a preprint using a similar framework to look at mutational signature heterogeneity across tumors (collab with @nalcala.bsky.social doi.org/10.1101/2023...) and we also used this framework to look at heterogeneity of immune cell infiltration (analysis not published yet).
March 14, 2025 at 8:51 PM
8/8 FAVA is the culmination of many conversations and collaborations. Thanks especially to my co-authors, @ksxue.bsky.social and Noah Rosenberg–I truly feel like I won the collaborator/mentor lottery. And thanks to you for reading! Paper is here if you want to read more: doi.org/10.1073/pnas...
PNAS
Proceedings of the National Academy of Sciences (PNAS), a peer reviewed journal of the National Academy of Sciences (NAS) - an authoritative source of high-impact, original research that broadly spans...
doi.org
March 14, 2025 at 8:46 PM
8/8 FAVA is the culmination of many conversations and collaborations. Thanks especially to my co-authors, @ksxue.bsky.social and Noah Rosenberg–I truly feel like I won the collaborator/mentor lottery. And thanks to you for reading! Paper is here if you want to read more: doi.org/10.1073/pnas...
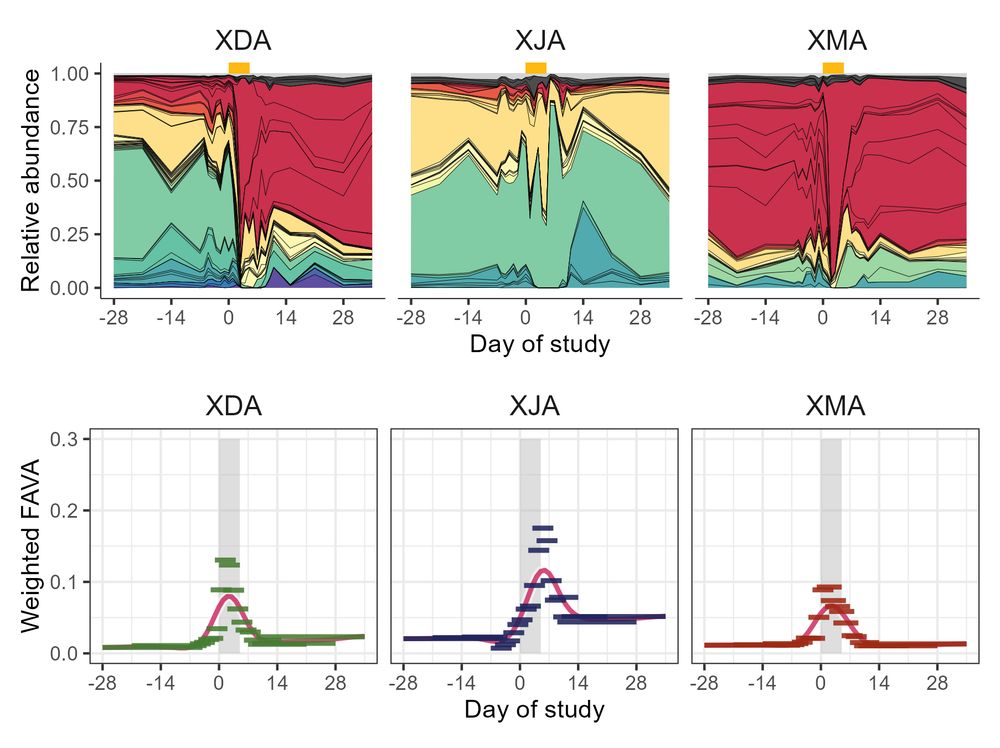
7/ (Ex. 2) In longitudinal microbiome samples from healthy humans taking an antibiotic (collab with @ksxue.bsky.social), FAVA is much higher post-abx than pre-abx, and just half of the 22 subjects return to their baseline FAVA level (computed in 6-sample sliding window) during the 30 days post-abx!
March 14, 2025 at 8:46 PM
7/ (Ex. 2) In longitudinal microbiome samples from healthy humans taking an antibiotic (collab with @ksxue.bsky.social), FAVA is much higher post-abx than pre-abx, and just half of the 22 subjects return to their baseline FAVA level (computed in 6-sample sliding window) during the 30 days post-abx!
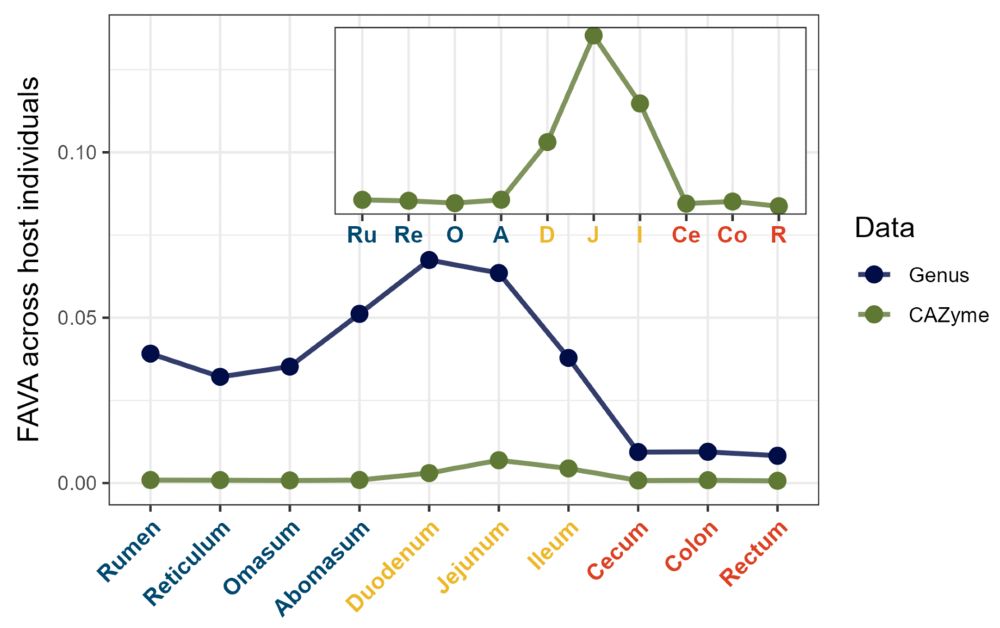
6/ (Ex. 1) In microbiome samples collected along the GI tracts of individuals from 7 ruminant species, FAVA peaks in the small intestine–so lots of variability would have been missed by stool sampling! We also find taxonomic variability >> functional variability–evidence for functional redundancy.
March 14, 2025 at 8:46 PM
6/ (Ex. 1) In microbiome samples collected along the GI tracts of individuals from 7 ruminant species, FAVA peaks in the small intestine–so lots of variability would have been missed by stool sampling! We also find taxonomic variability >> functional variability–evidence for functional redundancy.
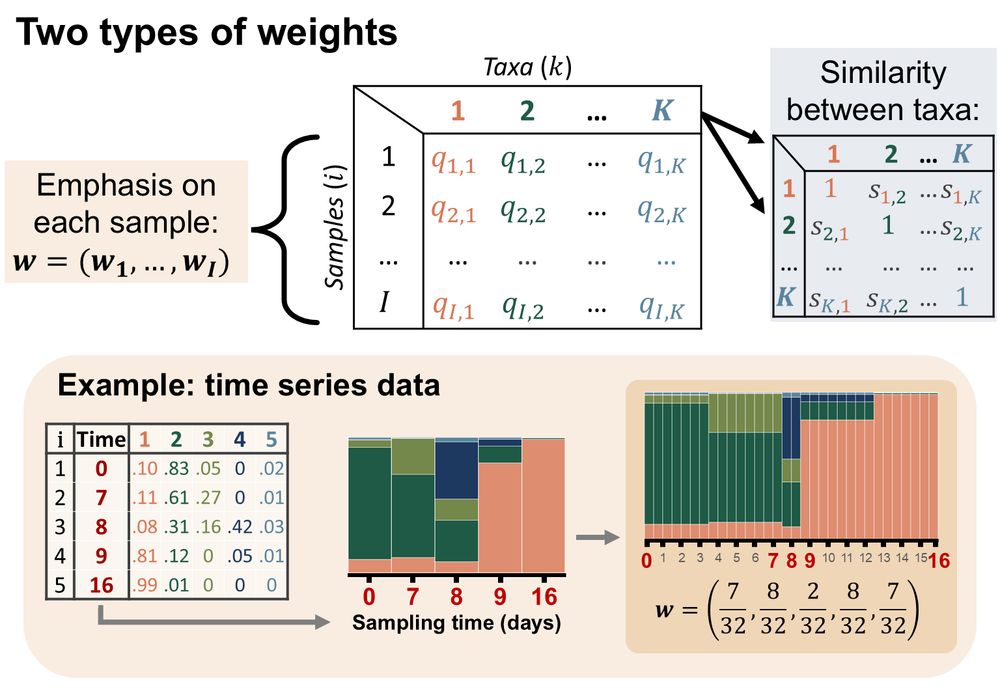
5/ FAVA can account for phylogenetic similarity among taxa and can differentially weight samples, which is especially useful for time series data (Fig. 3). FAVA can be computed in sliding windows to see how variability changes over space or time (Fig. 4). We demonstrate FAVA in 2 examples.
March 14, 2025 at 8:46 PM
5/ FAVA can account for phylogenetic similarity among taxa and can differentially weight samples, which is especially useful for time series data (Fig. 3). FAVA can be computed in sliding windows to see how variability changes over space or time (Fig. 4). We demonstrate FAVA in 2 examples.
4/ FAVA can analyze any relative abundance data, including taxonomic categories like OTUs and species, and functional categories like CAZymes and COGs. You can directly compare FAVA values computed on data with different numbers of categories (e.g., variability of bacterial species vs. families).
March 14, 2025 at 8:46 PM
4/ FAVA can analyze any relative abundance data, including taxonomic categories like OTUs and species, and functional categories like CAZymes and COGs. You can directly compare FAVA values computed on data with different numbers of categories (e.g., variability of bacterial species vs. families).
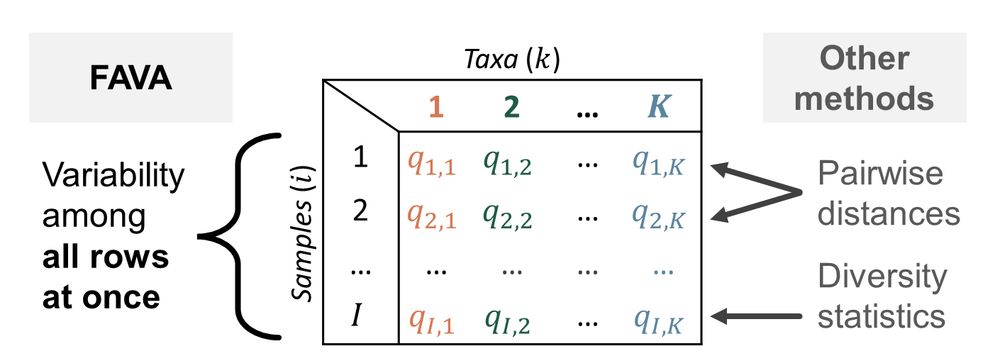
3/ FAVA extends the pop-gen statistic FST (which traditionally measures variability of allele frequencies across multiple populations) to instead measure variability of taxonomic or functional abundances across multiple microbiome samples (Fig. 1). All it needs is an OTU table, or similar.
March 14, 2025 at 8:46 PM
3/ FAVA extends the pop-gen statistic FST (which traditionally measures variability of allele frequencies across multiple populations) to instead measure variability of taxonomic or functional abundances across multiple microbiome samples (Fig. 1). All it needs is an OTU table, or similar.
2/ FAVA is implemented in an R package available for download from CRAN (just run install.packages("FAVA") in R). For detailed guidance on the analysis of microbiome data with FAVA, check out the tutorial on the package website: maikemorrison.github.io/FAVA/article...
Analysis of microbiome data with FAVA
maikemorrison.github.io
March 14, 2025 at 8:46 PM
2/ FAVA is implemented in an R package available for download from CRAN (just run install.packages("FAVA") in R). For detailed guidance on the analysis of microbiome data with FAVA, check out the tutorial on the package website: maikemorrison.github.io/FAVA/article...
6/ (Ex. 1) In microbiome samples collected along the GI tracts of individuals from 7 ruminant species, FAVA peaks in the small intestine–so lots of variation would have been missed by stool sampling! We also find taxonomic variability >> functional variability, evidence for functional redundancy!
March 14, 2025 at 7:58 PM
6/ (Ex. 1) In microbiome samples collected along the GI tracts of individuals from 7 ruminant species, FAVA peaks in the small intestine–so lots of variation would have been missed by stool sampling! We also find taxonomic variability >> functional variability, evidence for functional redundancy!
5/ FAVA can account for phylogenetic similarity among taxa and can differentially weight samples, which is especially useful for time-series data (Fig. 3). FAVA can be computed in sliding windows to see how variability changes over space or time (Fig. 4). We demonstrate FAVA in 2 examples:
March 14, 2025 at 7:58 PM
5/ FAVA can account for phylogenetic similarity among taxa and can differentially weight samples, which is especially useful for time-series data (Fig. 3). FAVA can be computed in sliding windows to see how variability changes over space or time (Fig. 4). We demonstrate FAVA in 2 examples:
4/ FAVA can analyze any relative abundance data, including taxonomic categories like OTUs and species, and functional categories like CAZymes and COGs. You can directly compare FAVA values computed on data with different numbers of categories (e.g., variability of bacterial species vs. families).
March 14, 2025 at 7:58 PM
4/ FAVA can analyze any relative abundance data, including taxonomic categories like OTUs and species, and functional categories like CAZymes and COGs. You can directly compare FAVA values computed on data with different numbers of categories (e.g., variability of bacterial species vs. families).
3/ FAVA extends the pop-gen statistic FST (which traditionally measures variability of allele frequencies across multiple populations) to instead measure variability of taxonomic or functional abundances across multiple microbiome samples (Fig. 1). All it needs is an OTU table, or similar.
March 14, 2025 at 7:58 PM
3/ FAVA extends the pop-gen statistic FST (which traditionally measures variability of allele frequencies across multiple populations) to instead measure variability of taxonomic or functional abundances across multiple microbiome samples (Fig. 1). All it needs is an OTU table, or similar.
Reading "The Science Bargain" by Rush Holt: "Democracy is at risk when it becomes simply a contest of opinions not grounded in evidence. When one opinion is as good as another–each asserted as strongly or even as deceptively as possible–democracy cannot survive. This is a call to science."
March 12, 2025 at 2:07 PM
Reading "The Science Bargain" by Rush Holt: "Democracy is at risk when it becomes simply a contest of opinions not grounded in evidence. When one opinion is as good as another–each asserted as strongly or even as deceptively as possible–democracy cannot survive. This is a call to science."