


Lukas Brunner
@lukasbrunner.bsky.social
Climate scientist @uni-hamburg.de: future projections, extremes, uncertainties | Formerly @ethz.ch @univie.ac.at | PhD @uni-graz.at | Python nerd | Hiking enthusiast
#SystemChangeNotClimateChange #OpenScience
More: https://lukasbrunner.github.io
#SystemChangeNotClimateChange #OpenScience
More: https://lukasbrunner.github.io
Hier ist noch die Info zu der ganzen Vortragsreihe, mit super spannenden weiteren Themen: www.zfw.uni-hamburg.de/oeffentliche...

Ringvorlesung zur Klimakrise
Ringvorlesungen an der Universität Hamburg ✓ öffentliche Vorträge ✓ aktuelle Themen aus Wissenschaft und Forschung ✓ kostenlos ✓ Einfach hingehen ✓
www.zfw.uni-hamburg.de
October 28, 2025 at 8:34 AM
Hier ist noch die Info zu der ganzen Vortragsreihe, mit super spannenden weiteren Themen: www.zfw.uni-hamburg.de/oeffentliche...
Vielen Dank für das Interesse und die angeregte Diskussion an alle die (online) dabei waren!
Der Vortrag ist zum nachsehen jetzt auch auf YouTube 💻
Die zugehörigen Slides auf meiner Homepage: lukasbrunner.github.io/outreach
youtu.be/IuTXbtR1fFw
Der Vortrag ist zum nachsehen jetzt auch auf YouTube 💻
Die zugehörigen Slides auf meiner Homepage: lukasbrunner.github.io/outreach
youtu.be/IuTXbtR1fFw

Naturwissenschaftliche Grundlagen der Klimakrise - Lukas Brunner | Fridays for Future
YouTube video by Fridays for Future DE
youtu.be
October 26, 2025 at 7:37 AM
Vielen Dank für das Interesse und die angeregte Diskussion an alle die (online) dabei waren!
Der Vortrag ist zum nachsehen jetzt auch auf YouTube 💻
Die zugehörigen Slides auf meiner Homepage: lukasbrunner.github.io/outreach
youtu.be/IuTXbtR1fFw
Der Vortrag ist zum nachsehen jetzt auch auf YouTube 💻
Die zugehörigen Slides auf meiner Homepage: lukasbrunner.github.io/outreach
youtu.be/IuTXbtR1fFw
See also the amazing visualization made by DKRZ based on our work 👇👇
bsky.app/profile/luka...
bsky.app/profile/luka...
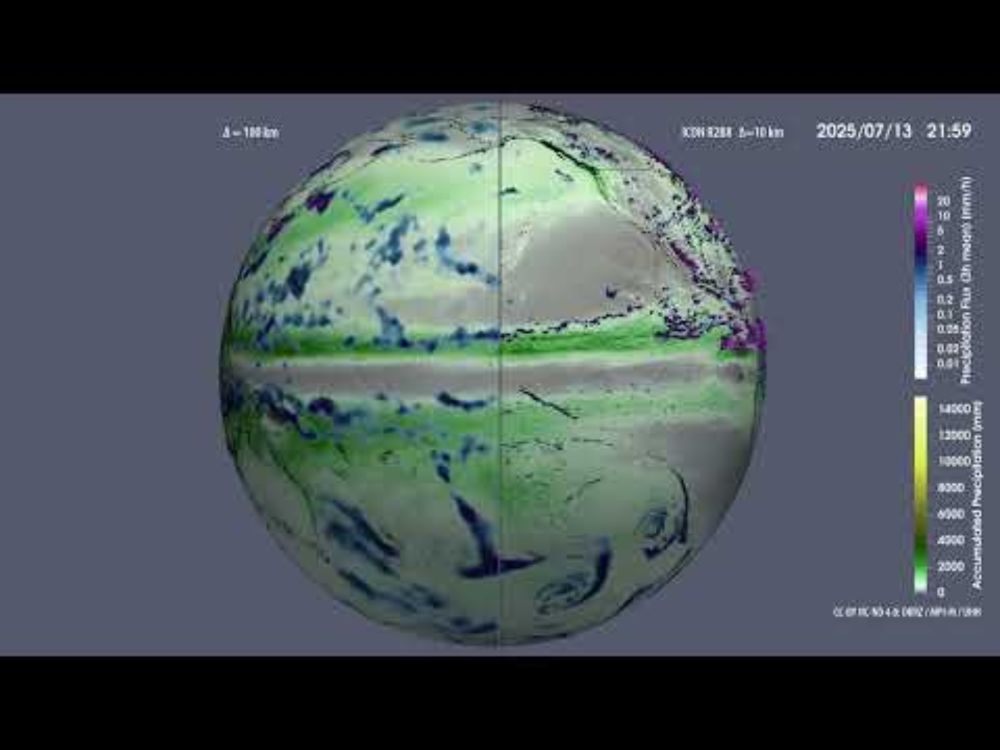
Amazing visualization of our recent sub-grid variability work by Michael Böttinger (DKRZ) 🤩.
It shows the local detail in global precipitation resolved by km-scale models. From 0:50 in direct comparison to CMIP6-type 100km. From 2:07 the sub-grid variability is shown. 🤓🧪
youtu.be/fzA92tSF4ZM?...
It shows the local detail in global precipitation resolved by km-scale models. From 0:50 in direct comparison to CMIP6-type 100km. From 2:07 the sub-grid variability is shown. 🤓🧪
youtu.be/fzA92tSF4ZM?...
The spatial representation of precipitation - a comparison between km-scale and CMIP-type model data
YouTube video by Deutsches Klimarechenzentrum
youtu.be
August 21, 2025 at 12:19 PM
See also the amazing visualization made by DKRZ based on our work 👇👇
bsky.app/profile/luka...
bsky.app/profile/luka...
Here is the thread to the original publication:
bsky.app/profile/luka...
bsky.app/profile/luka...
New paper in ERL! We study the importance of resolution for the representation of climate extremes.
We use a new generation of km-scale models to show that many important details about temperature and precipitation extremes are hidden at CMIP6-like resolutions.
doi.org/10.1088/1748...
We use a new generation of km-scale models to show that many important details about temperature and precipitation extremes are hidden at CMIP6-like resolutions.
doi.org/10.1088/1748...
August 18, 2025 at 12:20 PM
Here is the thread to the original publication:
bsky.app/profile/luka...
bsky.app/profile/luka...
Mehr zum Format und zukünftigen Vorlesungen: www.uni-hamburg.de/wissen-fuer-...

Vorlesung für alle
Raus aus der Uni, rein in die Stadt: Bei der „Vorlesung für alle“ halten Forschende Vorträge an ungewöhnlichen Orten in der Stadt.
www.uni-hamburg.de
July 28, 2025 at 3:57 PM
Mehr zum Format und zukünftigen Vorlesungen: www.uni-hamburg.de/wissen-fuer-...
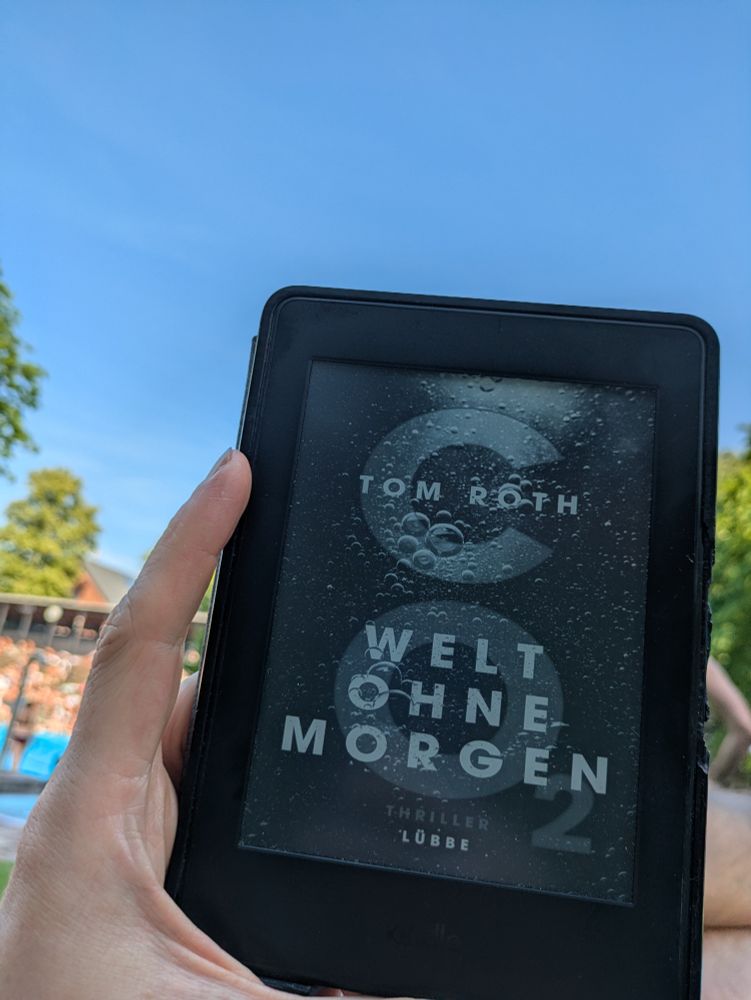
Scary but fitting read for the occasion 🫣
June 21, 2025 at 3:33 PM
Scary but fitting read for the occasion 🫣
The repository is hierarchical. Click on the rightmost tab, there you can select one of the two models, and then again one of the two resolutions. At the lowest level, there is a green 'Download' button.
Here's a direct link to the high-resolution IOCN results: www.wdc-climate.de/ui/entry?acr...
Here's a direct link to the high-resolution IOCN results: www.wdc-climate.de/ui/entry?acr...
Metadata for 'Annual ETCCDI Extreme Indices For ICON-Sapphire (nextGEMS Cycle 4) - high resolution (HEALPix zoom 9)'
www.wdc-climate.de
June 19, 2025 at 8:08 AM
The repository is hierarchical. Click on the rightmost tab, there you can select one of the two models, and then again one of the two resolutions. At the lowest level, there is a green 'Download' button.
Here's a direct link to the high-resolution IOCN results: www.wdc-climate.de/ui/entry?acr...
Here's a direct link to the high-resolution IOCN results: www.wdc-climate.de/ui/entry?acr...
We are working on related topics right now but I can't make any specific promises at this point.
Having said that: we have published all the data that go into our study as netCDF (thats annual extreme indices from 2021-2049)👇
bsky.app/profile/luka...
Having said that: we have published all the data that go into our study as netCDF (thats annual extreme indices from 2021-2049)👇
bsky.app/profile/luka...
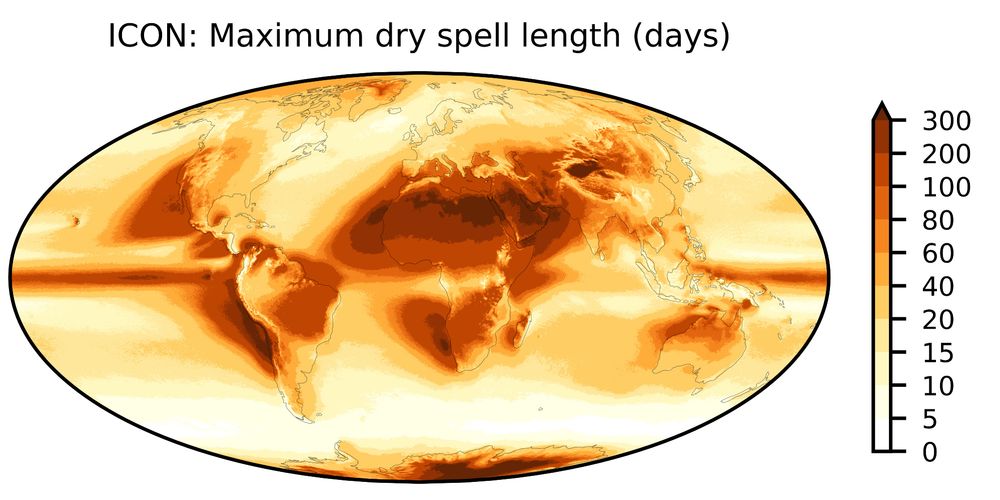
We focus on a subset of the 27 ETCCDI climate extreme indices in the paper. But we have published the full set of ETCCDI indices with 10km resolution globally at the World Data Center for Climate here:
doi.org/10.26050/WDC...
doi.org/10.26050/WDC...
Metadata for 'Annual ETCCDI Extreme Indices For ICON-Sapphire And IFS-FESOM (nextGEMS Cycle 4)'
www.wdc-climate.de
June 18, 2025 at 7:09 AM
We are working on related topics right now but I can't make any specific promises at this point.
Having said that: we have published all the data that go into our study as netCDF (thats annual extreme indices from 2021-2049)👇
bsky.app/profile/luka...
Having said that: we have published all the data that go into our study as netCDF (thats annual extreme indices from 2021-2049)👇
bsky.app/profile/luka...
An extensive database of plots for all ETCCDI climate extreme indices is also available under a CC BY license on Zenodo: doi.org/10.5281/zeno...
June 17, 2025 at 11:00 AM
An extensive database of plots for all ETCCDI climate extreme indices is also available under a CC BY license on Zenodo: doi.org/10.5281/zeno...
The code we used to produce our figures is freely available under a permissive license. If you want to work with it and have any questions, feel free to reach out to me. There are also open master’s thesis projects on the topic!
github.com/lukasbrunner...
github.com/lukasbrunner...
GitHub - lukasbrunner/Brunner_etal_2025_ERL
Contribute to lukasbrunner/Brunner_etal_2025_ERL development by creating an account on GitHub.
github.com
June 17, 2025 at 10:57 AM
The code we used to produce our figures is freely available under a permissive license. If you want to work with it and have any questions, feel free to reach out to me. There are also open master’s thesis projects on the topic!
github.com/lukasbrunner...
github.com/lukasbrunner...