


Liz Bettini
@lizbettini.bsky.social
I skeet about #Specialedteachers & #teacherworkingconditions, co-direct the @sparccenter.bsky.social & am affiliated w/ the awesome @wheelockpolicybu.bsky.social here at @buwheelock.bsky.social (she/her)
I LOVED seeing @lmasonwms.bsky.social get the recognition she so eminently deserves at TED this week, with the TED Excellence Award!! HUGE congratulations to TED, that we get such an amazing policy chair, colleague & member in our community!

November 14, 2025 at 11:29 PM
I LOVED seeing @lmasonwms.bsky.social get the recognition she so eminently deserves at TED this week, with the TED Excellence Award!! HUGE congratulations to TED, that we get such an amazing policy chair, colleague & member in our community!
Check out Nelson Brunsting presenting SUCH thoughtful work on how we can intervene to improve special educators working conditions through project SUSTAIN !
education.ufl.edu/sustain/
education.ufl.edu/sustain/

November 13, 2025 at 5:12 PM
Check out Nelson Brunsting presenting SUCH thoughtful work on how we can intervene to improve special educators working conditions through project SUSTAIN !
education.ufl.edu/sustain/
education.ufl.edu/sustain/
So much important information in this graph!!

November 13, 2025 at 4:16 PM
So much important information in this graph!!
For example, tremendous variability in the proportion of teachers who are special educators in each state


November 13, 2025 at 4:11 PM
For example, tremendous variability in the proportion of teachers who are special educators in each state
Fascinating paper being presented right now in Shawnee, with @lindseykaler.bsky.social and Jenn Lillis, about analysis IEP data at scale!

November 12, 2025 at 4:06 PM
Fascinating paper being presented right now in Shawnee, with @lindseykaler.bsky.social and Jenn Lillis, about analysis IEP data at scale!
"Varying patterns across states...suggest the need for policy responses targeted to state & local needs."
Check out recent @sparccenter.bsky.social findings, @lmasonwms.bsky.social, @afgilmour.bsky.social, @roddy-theobald.bsky.social
www.brookings.edu/articles/sta...
Check out recent @sparccenter.bsky.social findings, @lmasonwms.bsky.social, @afgilmour.bsky.social, @roddy-theobald.bsky.social
www.brookings.edu/articles/sta...

November 11, 2025 at 11:56 AM
"Varying patterns across states...suggest the need for policy responses targeted to state & local needs."
Check out recent @sparccenter.bsky.social findings, @lmasonwms.bsky.social, @afgilmour.bsky.social, @roddy-theobald.bsky.social
www.brookings.edu/articles/sta...
Check out recent @sparccenter.bsky.social findings, @lmasonwms.bsky.social, @afgilmour.bsky.social, @roddy-theobald.bsky.social
www.brookings.edu/articles/sta...
Some nuances to check out in SPARC's data explorer: In most states, attrition is higher in high pov schools, w/the exception of Hawai'i & TX. Disparities are most pronounced in VA & PA - for example, PA has low overall turnover rates, but disparities between high & low pov schools are stark.

October 31, 2025 at 1:50 PM
Some nuances to check out in SPARC's data explorer: In most states, attrition is higher in high pov schools, w/the exception of Hawai'i & TX. Disparities are most pronounced in VA & PA - for example, PA has low overall turnover rates, but disparities between high & low pov schools are stark.
Why do special educators switch into general ed at much higher rates in some states than others? What are implications of high rates of switching for students? Do potential benefits of having dual licensed general educators outweigh the pitfalls of higher instability in the special ed workforce?

October 31, 2025 at 10:23 AM
Why do special educators switch into general ed at much higher rates in some states than others? What are implications of high rates of switching for students? Do potential benefits of having dual licensed general educators outweigh the pitfalls of higher instability in the special ed workforce?
(2) Attrition rates are very high in almost every state, w/ more than 1/3 SETs turning over annually in most states. But, in most states those rates are substantially higher in schools serving more low income students & students of color.

October 30, 2025 at 2:59 PM
(2) Attrition rates are very high in almost every state, w/ more than 1/3 SETs turning over annually in most states. But, in most states those rates are substantially higher in schools serving more low income students & students of color.
(1) States staff special education really differently, with ratios of students with disabilities: special ed teachers that range from 9:1 to 27:1

October 30, 2025 at 2:59 PM
(1) States staff special education really differently, with ratios of students with disabilities: special ed teachers that range from 9:1 to 27:1
Excited to check out @drchriscip.bsky.social's new book!

October 24, 2025 at 8:55 PM
Excited to check out @drchriscip.bsky.social's new book!
I am recruiting a doc student! I am so excited :-D The student would have opportunities to work on IES & Spencer funded projects focused on strengthening the special ed workforce, including Project RESPECT, Project SUSTAIN, Project ONBOARD, & the SPARC Center. Please share widely! Thanks all!


October 22, 2025 at 11:38 AM
I am recruiting a doc student! I am so excited :-D The student would have opportunities to work on IES & Spencer funded projects focused on strengthening the special ed workforce, including Project RESPECT, Project SUSTAIN, Project ONBOARD, & the SPARC Center. Please share widely! Thanks all!
@tashnuvashaheen.bsky.social - emergency licensed special ed teachers more likely to work in self contained settings, less likely to work in inclusive settings; more likely to work with students with IDD and ASD. Such important findings regarding inequitable sorting of special ed teachers!


October 11, 2025 at 2:10 PM
@tashnuvashaheen.bsky.social - emergency licensed special ed teachers more likely to work in self contained settings, less likely to work in inclusive settings; more likely to work with students with IDD and ASD. Such important findings regarding inequitable sorting of special ed teachers!


Hoping I survive walking at night in #warzonechicago . 🙄

October 8, 2025 at 11:56 PM
Hoping I survive walking at night in #warzonechicago . 🙄
Starting this tonight, in honor of the state of our union. Will catch the news tomorrow.
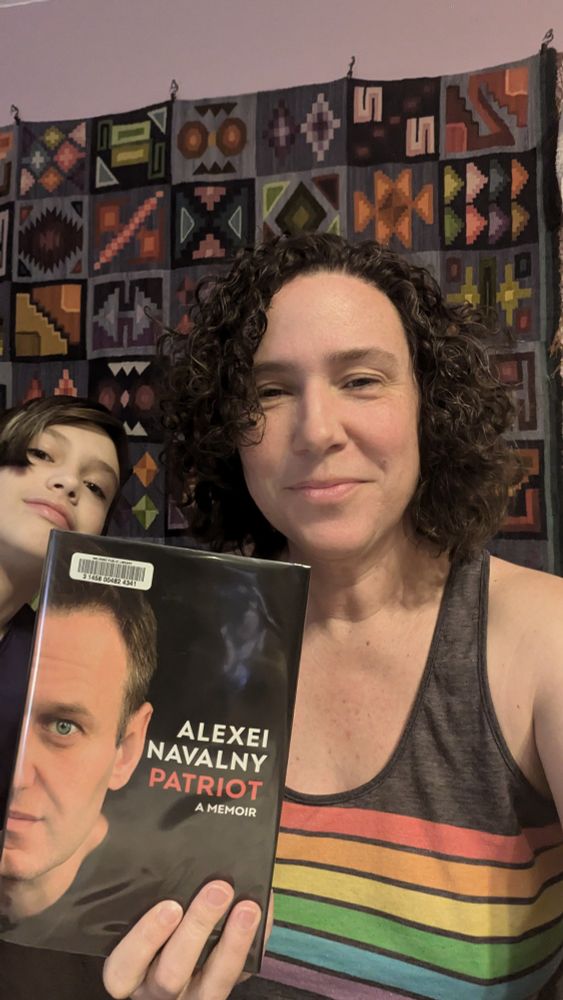
March 5, 2025 at 2:19 AM
Starting this tonight, in honor of the state of our union. Will catch the news tomorrow.
Register for TED CEC's Advocacy in Action webinar, tomorrow afternoon!
us02web.zoom.us/meeting/regi...
us02web.zoom.us/meeting/regi...
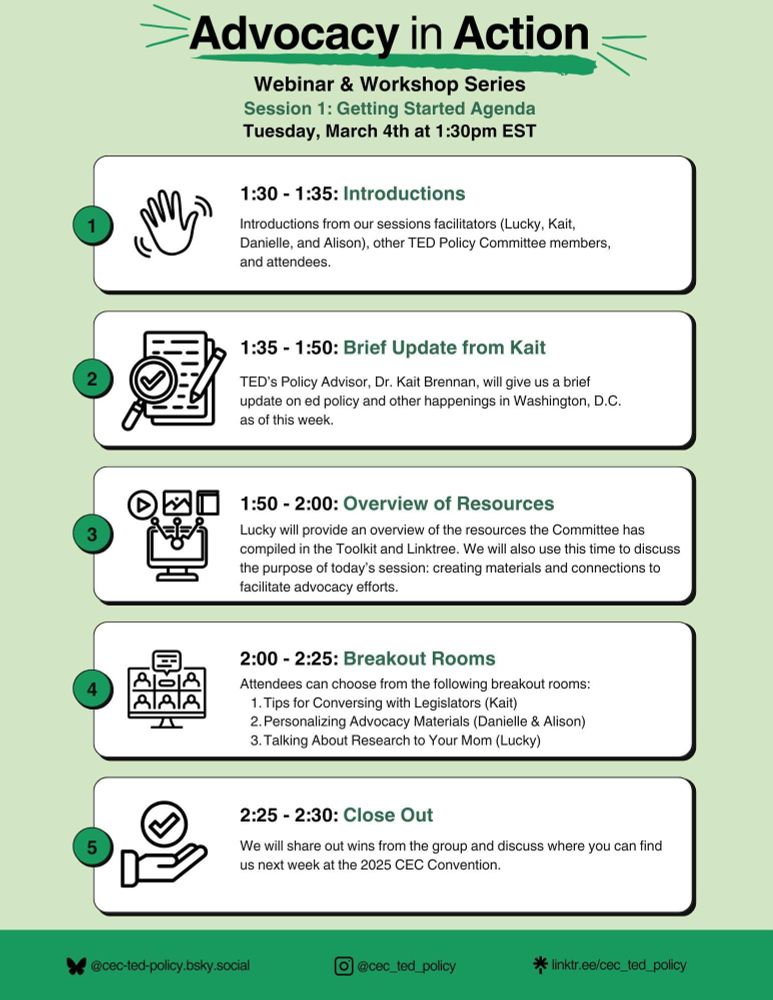
March 4, 2025 at 12:59 AM
Register for TED CEC's Advocacy in Action webinar, tomorrow afternoon!
us02web.zoom.us/meeting/regi...
us02web.zoom.us/meeting/regi...
Done. Thank you for the fantastic idea!

February 27, 2025 at 5:49 PM
Done. Thank you for the fantastic idea!
Special education researchers 🔔 Join us this Thursday at 2:00pm EST for townhall organized by CEC and hosted by leadership from Division for Research, Teacher Education Division, and Division on Career Development & Transition. Register here: us06web.zoom.us/webinar/regi...

February 20, 2025 at 10:58 AM
Special education researchers 🔔 Join us this Thursday at 2:00pm EST for townhall organized by CEC and hosted by leadership from Division for Research, Teacher Education Division, and Division on Career Development & Transition. Register here: us06web.zoom.us/webinar/regi...
2. We also looked at this using the parity index, an indicator developed by Villegas et al (2012), which can be interpreted as the % of SETs of color employed relative to the % needed for proportionate representation w/the student population (see paper for details on how this is calculated):

December 17, 2024 at 9:41 PM
2. We also looked at this using the parity index, an indicator developed by Villegas et al (2012), which can be interpreted as the % of SETs of color employed relative to the % needed for proportionate representation w/the student population (see paper for details on how this is calculated):
1. Assuming US schools need 1 SET for every 15-20 students w/disabilities (based on national ratios since 2012), this graph shows # of SETs employed (mostly flat line) relative to the number necessary for 1:20 (middle line) & 1:15 (top line) ratios of SETs of color: students of color w/disabilities:

December 17, 2024 at 9:41 PM
1. Assuming US schools need 1 SET for every 15-20 students w/disabilities (based on national ratios since 2012), this graph shows # of SETs employed (mostly flat line) relative to the number necessary for 1:20 (middle line) & 1:15 (top line) ratios of SETs of color: students of color w/disabilities:

October 16, 2024 at 3:23 PM
New pub alert! We examined principals' conceptions of their roles supporting programs for students w/EBD. We found their conceptions of EBD underlay their visions for the program, the roles they took on to support them & their sense of agency.
journals.sagepub.com/doi/10.1177/...
journals.sagepub.com/doi/10.1177/...

March 25, 2024 at 5:55 PM
New pub alert! We examined principals' conceptions of their roles supporting programs for students w/EBD. We found their conceptions of EBD underlay their visions for the program, the roles they took on to support them & their sense of agency.
journals.sagepub.com/doi/10.1177/...
journals.sagepub.com/doi/10.1177/...
My copy arrived!!
www.routledge.com/Handbook-of-...
www.routledge.com/Handbook-of-...

February 1, 2024 at 9:49 PM
My copy arrived!!
www.routledge.com/Handbook-of-...
www.routledge.com/Handbook-of-...