


Lisa Trescott
@lisatrescott.bsky.social
Research Analyst | 2021 #IronViz Global Champion | Tableau Visionary | Tableau Ambassador | CCC TUG co-lead
https://lisatrescott.com/
https://lisatrescott.com/
📢 New Blog Alert! 📢
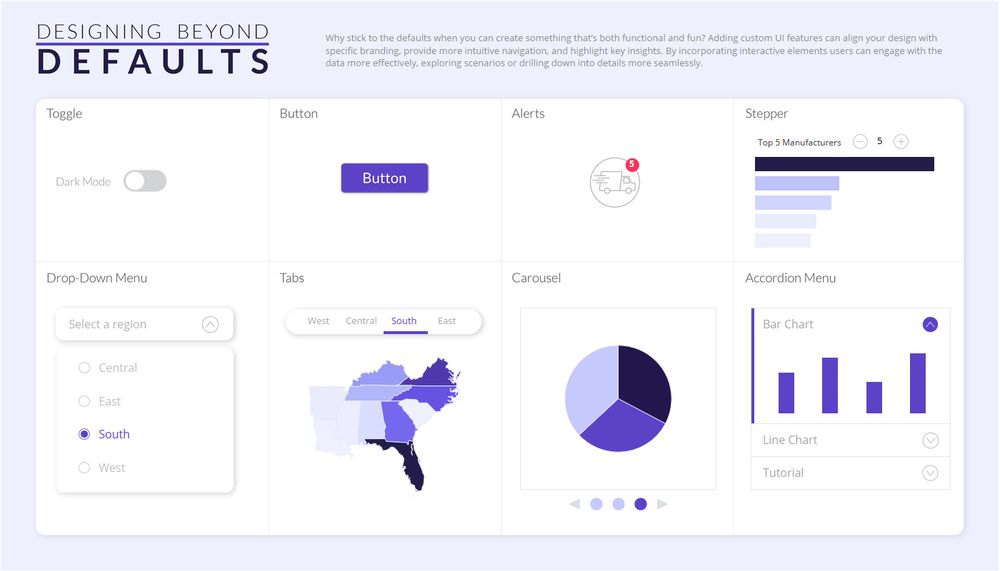
Want to customize your dashboard’s UI but not sure where to start? I’ve got you covered!
In my latest blog, I break down a 5-step process for designing beyond defaults in Tableau.
🔗Blog: bit.ly/3DiABOZ
🔗Workbook: bit.ly/4jRJYWj
Want to customize your dashboard’s UI but not sure where to start? I’ve got you covered!
In my latest blog, I break down a 5-step process for designing beyond defaults in Tableau.
🔗Blog: bit.ly/3DiABOZ
🔗Workbook: bit.ly/4jRJYWj
March 10, 2025 at 4:02 PM
📢 New Blog Alert! 📢
Want to customize your dashboard’s UI but not sure where to start? I’ve got you covered!
In my latest blog, I break down a 5-step process for designing beyond defaults in Tableau.
🔗Blog: bit.ly/3DiABOZ
🔗Workbook: bit.ly/4jRJYWj
Want to customize your dashboard’s UI but not sure where to start? I’ve got you covered!
In my latest blog, I break down a 5-step process for designing beyond defaults in Tableau.
🔗Blog: bit.ly/3DiABOZ
🔗Workbook: bit.ly/4jRJYWj
✨Exciting news✨
I'll be speaking at Tableau Conference! This year, I’m diving into the process of building vizzes and crafting compelling data stories.
Join me and the #DataFam in San Diego this April! Register here 👉 tabsoft.co/3Ilqt7G
Hope to see you there! #TC25
I'll be speaking at Tableau Conference! This year, I’m diving into the process of building vizzes and crafting compelling data stories.
Join me and the #DataFam in San Diego this April! Register here 👉 tabsoft.co/3Ilqt7G
Hope to see you there! #TC25

February 20, 2025 at 3:45 PM
✨Exciting news✨
I'll be speaking at Tableau Conference! This year, I’m diving into the process of building vizzes and crafting compelling data stories.
Join me and the #DataFam in San Diego this April! Register here 👉 tabsoft.co/3Ilqt7G
Hope to see you there! #TC25
I'll be speaking at Tableau Conference! This year, I’m diving into the process of building vizzes and crafting compelling data stories.
Join me and the #DataFam in San Diego this April! Register here 👉 tabsoft.co/3Ilqt7G
Hope to see you there! #TC25
Roses are red 🌹
Violets are blue 💙
Each state's favorite candy,
I've visualized it for you!
This week's #MakeoverMonday dataset was too sweet to pass up, and I had a lot of fun vizzing about states' favorite Valentine's Day candy!
🔗 Link to viz on @tableaupublic.bsky.social: bit.ly/3Qc247N
Violets are blue 💙
Each state's favorite candy,
I've visualized it for you!
This week's #MakeoverMonday dataset was too sweet to pass up, and I had a lot of fun vizzing about states' favorite Valentine's Day candy!
🔗 Link to viz on @tableaupublic.bsky.social: bit.ly/3Qc247N

February 12, 2025 at 4:02 PM
Roses are red 🌹
Violets are blue 💙
Each state's favorite candy,
I've visualized it for you!
This week's #MakeoverMonday dataset was too sweet to pass up, and I had a lot of fun vizzing about states' favorite Valentine's Day candy!
🔗 Link to viz on @tableaupublic.bsky.social: bit.ly/3Qc247N
Violets are blue 💙
Each state's favorite candy,
I've visualized it for you!
This week's #MakeoverMonday dataset was too sweet to pass up, and I had a lot of fun vizzing about states' favorite Valentine's Day candy!
🔗 Link to viz on @tableaupublic.bsky.social: bit.ly/3Qc247N
It's almost Valentine's day, so why not chart your affection for the #DataFam with my CYO Valentine on @tableaupublic.bsky.social?!
Pick a heart 💜 , background chart 📊 , message, and decorate with doodles. Then share with your Valentine 💝
Check it out here: bit.ly/4aTxdpQ
Pick a heart 💜 , background chart 📊 , message, and decorate with doodles. Then share with your Valentine 💝
Check it out here: bit.ly/4aTxdpQ

February 10, 2025 at 4:42 PM
It's almost Valentine's day, so why not chart your affection for the #DataFam with my CYO Valentine on @tableaupublic.bsky.social?!
Pick a heart 💜 , background chart 📊 , message, and decorate with doodles. Then share with your Valentine 💝
Check it out here: bit.ly/4aTxdpQ
Pick a heart 💜 , background chart 📊 , message, and decorate with doodles. Then share with your Valentine 💝
Check it out here: bit.ly/4aTxdpQ
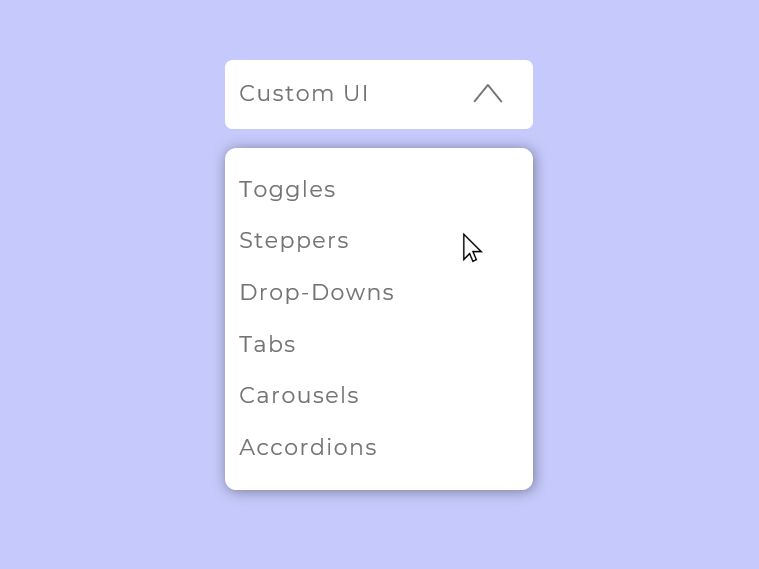
Last week, I had the honor of speaking at Apple's Tableau Day about designing beyond defaults and adding custom UI elements to dashboards.
Check out this companion workbook on
@tableaupublic.bsky.social
for ideas to elevate the UI of your dashboards!
🔗 bit.ly/4jRJYWj
Blog post coming soon!
Check out this companion workbook on
@tableaupublic.bsky.social
for ideas to elevate the UI of your dashboards!
🔗 bit.ly/4jRJYWj
Blog post coming soon!
February 3, 2025 at 4:06 PM
Last week, I had the honor of speaking at Apple's Tableau Day about designing beyond defaults and adding custom UI elements to dashboards.
Check out this companion workbook on
@tableaupublic.bsky.social
for ideas to elevate the UI of your dashboards!
🔗 bit.ly/4jRJYWj
Blog post coming soon!
Check out this companion workbook on
@tableaupublic.bsky.social
for ideas to elevate the UI of your dashboards!
🔗 bit.ly/4jRJYWj
Blog post coming soon!
Want to add some infographic flair to your next pie charts #DataFam? Check out my new viz and tutorial on how to make picture-perfect pie charts in Tableau.
Viz: bit.ly/3PxgI90
Blog: bit.ly/4aiVDJl
Inspiration was drawn from Shreya Arya and her tutorial on building donut charts with map layers.
Viz: bit.ly/3PxgI90
Blog: bit.ly/4aiVDJl
Inspiration was drawn from Shreya Arya and her tutorial on building donut charts with map layers.

January 14, 2025 at 4:03 PM
Want to add some infographic flair to your next pie charts #DataFam? Check out my new viz and tutorial on how to make picture-perfect pie charts in Tableau.
Viz: bit.ly/3PxgI90
Blog: bit.ly/4aiVDJl
Inspiration was drawn from Shreya Arya and her tutorial on building donut charts with map layers.
Viz: bit.ly/3PxgI90
Blog: bit.ly/4aiVDJl
Inspiration was drawn from Shreya Arya and her tutorial on building donut charts with map layers.
Thank you! I got the idea from this image, and then just went wild with it.

December 9, 2024 at 11:36 PM
Thank you! I got the idea from this image, and then just went wild with it.
I know most people are focused on the upcoming holiday season, but I'm looking ahead to Groundhog Day!
My new @tableaupublic.bsky.social viz displays data for the 38 Groundhog Days shown in the 1993 movie.
🔗 bit.ly/3ZvryRs
Many thanks to @zachbowders.bsky.social for providing feedback!
My new @tableaupublic.bsky.social viz displays data for the 38 Groundhog Days shown in the 1993 movie.
🔗 bit.ly/3ZvryRs
Many thanks to @zachbowders.bsky.social for providing feedback!

December 9, 2024 at 4:08 PM
I know most people are focused on the upcoming holiday season, but I'm looking ahead to Groundhog Day!
My new @tableaupublic.bsky.social viz displays data for the 38 Groundhog Days shown in the 1993 movie.
🔗 bit.ly/3ZvryRs
Many thanks to @zachbowders.bsky.social for providing feedback!
My new @tableaupublic.bsky.social viz displays data for the 38 Groundhog Days shown in the 1993 movie.
🔗 bit.ly/3ZvryRs
Many thanks to @zachbowders.bsky.social for providing feedback!
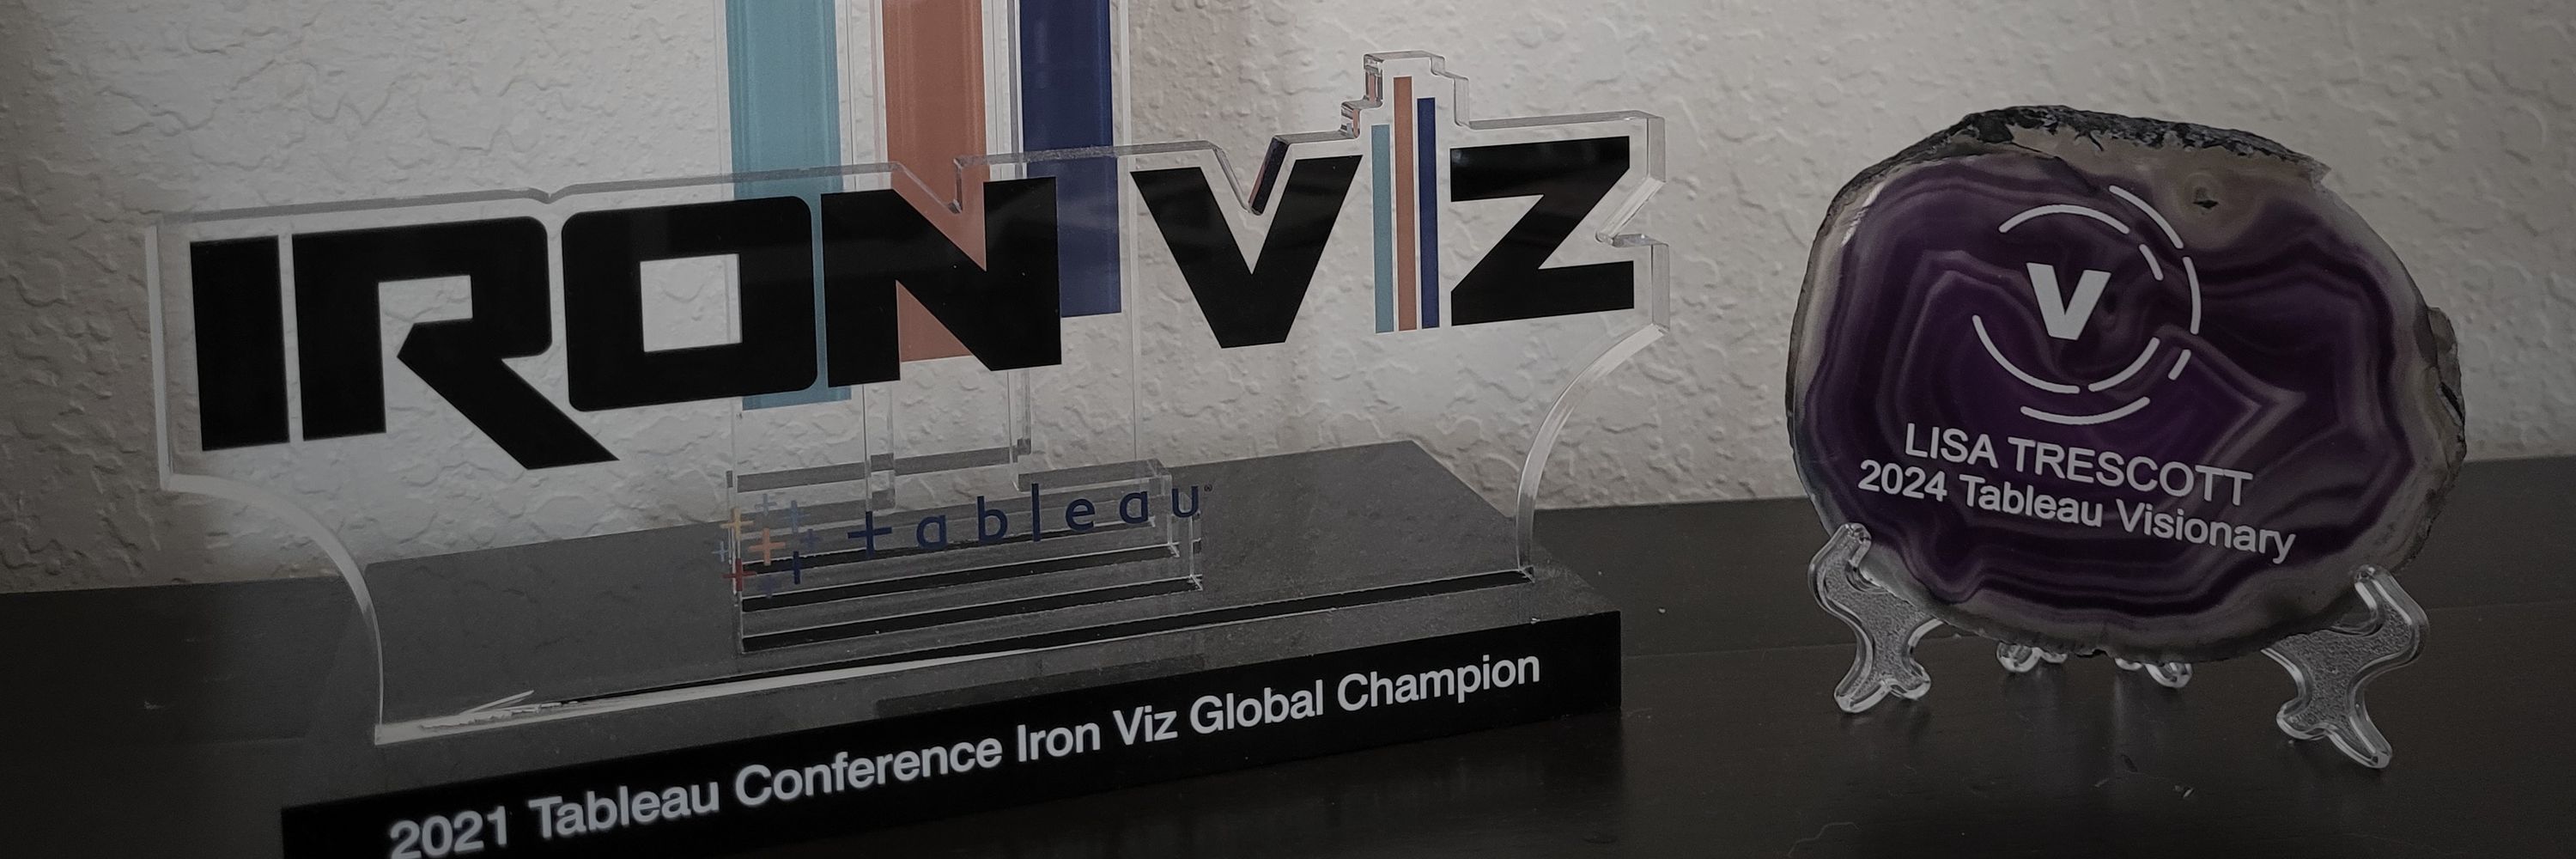
It's an honor to serve as a @tableaupublic.bsky.social Ambassador, and I have so much appreciation for all the members of the #DataFam who helped me on my journey!
Many thanks to #Tableau for the swag! It came just in time for the weekend, and Flat Lisa always loves a reason to model for me.
Many thanks to #Tableau for the swag! It came just in time for the weekend, and Flat Lisa always loves a reason to model for me.

November 22, 2024 at 10:55 PM
It's an honor to serve as a @tableaupublic.bsky.social Ambassador, and I have so much appreciation for all the members of the #DataFam who helped me on my journey!
Many thanks to #Tableau for the swag! It came just in time for the weekend, and Flat Lisa always loves a reason to model for me.
Many thanks to #Tableau for the swag! It came just in time for the weekend, and Flat Lisa always loves a reason to model for me.