

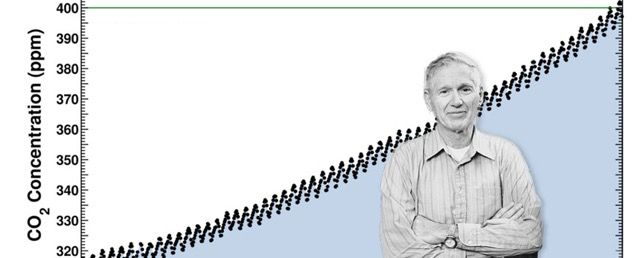
The Keeling Curve
@keelingcurve.bsky.social
Official daily update on atmospheric CO2 levels in the post-400 ppm era from Scripps Institution of Oceanography's iconic Keeling Curve.
425.61 parts per million (ppm) CO2 in air 10-Nov-2025
keelingcurve.ucsd.edu
keelingcurve.ucsd.edu
The Keeling Curve
The Keeling Curve is a daily record of global atmospheric carbon dioxide concentration maintained by Scripps Institution of Oceanography at UC San Diego.
keelingcurve.ucsd.edu
November 11, 2025 at 9:20 PM
425.61 parts per million (ppm) CO2 in air 10-Nov-2025
keelingcurve.ucsd.edu
keelingcurve.ucsd.edu
Baseline reading not available, data too variable 09-Nov-2025
keelingcurve.ucsd.edu
keelingcurve.ucsd.edu
The Keeling Curve
The Keeling Curve is a daily record of global atmospheric carbon dioxide concentration maintained by Scripps Institution of Oceanography at UC San Diego.
keelingcurve.ucsd.edu
November 10, 2025 at 5:51 PM
Baseline reading not available, data too variable 09-Nov-2025
keelingcurve.ucsd.edu
keelingcurve.ucsd.edu
424.54 parts per million (ppm) CO2 in air 08-Nov-2025
keelingcurve.ucsd.edu
keelingcurve.ucsd.edu
The Keeling Curve
The Keeling Curve is a daily record of global atmospheric carbon dioxide concentration maintained by Scripps Institution of Oceanography at UC San Diego.
keelingcurve.ucsd.edu
November 9, 2025 at 6:40 PM
424.54 parts per million (ppm) CO2 in air 08-Nov-2025
keelingcurve.ucsd.edu
keelingcurve.ucsd.edu
Baseline reading not available, data too variable 07-Nov-2025
keelingcurve.ucsd.edu
keelingcurve.ucsd.edu
The Keeling Curve
The Keeling Curve is a daily record of global atmospheric carbon dioxide concentration maintained by Scripps Institution of Oceanography at UC San Diego.
keelingcurve.ucsd.edu
November 8, 2025 at 10:20 PM
Baseline reading not available, data too variable 07-Nov-2025
keelingcurve.ucsd.edu
keelingcurve.ucsd.edu
424.47 parts per million (ppm) CO2 in air 06-Nov-2025
keelingcurve.ucsd.edu
keelingcurve.ucsd.edu
The Keeling Curve
The Keeling Curve is a daily record of global atmospheric carbon dioxide concentration maintained by Scripps Institution of Oceanography at UC San Diego.
keelingcurve.ucsd.edu
November 7, 2025 at 8:37 PM
424.47 parts per million (ppm) CO2 in air 06-Nov-2025
keelingcurve.ucsd.edu
keelingcurve.ucsd.edu
424.33 parts per million (ppm) CO2 in air 05-Nov-2025
keelingcurve.ucsd.edu
keelingcurve.ucsd.edu
The Keeling Curve
The Keeling Curve is a daily record of global atmospheric carbon dioxide concentration maintained by Scripps Institution of Oceanography at UC San Diego.
keelingcurve.ucsd.edu
November 6, 2025 at 5:26 PM
424.33 parts per million (ppm) CO2 in air 05-Nov-2025
keelingcurve.ucsd.edu
keelingcurve.ucsd.edu
423.82 parts per million (ppm) CO2 in air 03-Nov-2025
keelingcurve.ucsd.edu
keelingcurve.ucsd.edu
The Keeling Curve
The Keeling Curve is a daily record of global atmospheric carbon dioxide concentration maintained by Scripps Institution of Oceanography at UC San Diego.
keelingcurve.ucsd.edu
November 5, 2025 at 3:22 AM
423.82 parts per million (ppm) CO2 in air 03-Nov-2025
keelingcurve.ucsd.edu
keelingcurve.ucsd.edu
Baseline reading not available, data too variable 02-Nov-2025
keelingcurve.ucsd.edu
keelingcurve.ucsd.edu
The Keeling Curve
The Keeling Curve is a daily record of global atmospheric carbon dioxide concentration maintained by Scripps Institution of Oceanography at UC San Diego.
keelingcurve.ucsd.edu
November 3, 2025 at 5:11 PM
Baseline reading not available, data too variable 02-Nov-2025
keelingcurve.ucsd.edu
keelingcurve.ucsd.edu
425.27 parts per million (ppm) CO2 in air 01-Nov-2025
keelingcurve.ucsd.edu
keelingcurve.ucsd.edu
The Keeling Curve
The Keeling Curve is a daily record of global atmospheric carbon dioxide concentration maintained by Scripps Institution of Oceanography at UC San Diego.
keelingcurve.ucsd.edu
November 3, 2025 at 1:17 AM
425.27 parts per million (ppm) CO2 in air 01-Nov-2025
keelingcurve.ucsd.edu
keelingcurve.ucsd.edu
Baseline reading not available, data too variable 31-Oct-2025
keelingcurve.ucsd.edu
keelingcurve.ucsd.edu
The Keeling Curve
The Keeling Curve is a daily record of global atmospheric carbon dioxide concentration maintained by Scripps Institution of Oceanography at UC San Diego.
keelingcurve.ucsd.edu
November 1, 2025 at 4:07 PM
Baseline reading not available, data too variable 31-Oct-2025
keelingcurve.ucsd.edu
keelingcurve.ucsd.edu
425.19 parts per million (ppm) CO2 in air 30-Oct-2025
keelingcurve.ucsd.edu
keelingcurve.ucsd.edu
The Keeling Curve
The Keeling Curve is a daily record of global atmospheric carbon dioxide concentration maintained by Scripps Institution of Oceanography at UC San Diego.
keelingcurve.ucsd.edu
November 1, 2025 at 1:45 AM
425.19 parts per million (ppm) CO2 in air 30-Oct-2025
keelingcurve.ucsd.edu
keelingcurve.ucsd.edu
425.34 parts per million (ppm) CO2 in air 29-Oct-2025
keelingcurve.ucsd.edu
keelingcurve.ucsd.edu
The Keeling Curve
The Keeling Curve is a daily record of global atmospheric carbon dioxide concentration maintained by Scripps Institution of Oceanography at UC San Diego.
keelingcurve.ucsd.edu
October 30, 2025 at 5:18 PM
425.34 parts per million (ppm) CO2 in air 29-Oct-2025
keelingcurve.ucsd.edu
keelingcurve.ucsd.edu
424.64 parts per million (ppm) CO2 in air 28-Oct-2025
keelingcurve.ucsd.edu
keelingcurve.ucsd.edu
The Keeling Curve
The Keeling Curve is a daily record of global atmospheric carbon dioxide concentration maintained by Scripps Institution of Oceanography at UC San Diego.
keelingcurve.ucsd.edu
October 29, 2025 at 9:56 PM
424.64 parts per million (ppm) CO2 in air 28-Oct-2025
keelingcurve.ucsd.edu
keelingcurve.ucsd.edu
424.71 parts per million (ppm) CO2 in air 27-Oct-2025
keelingcurve.ucsd.edu
keelingcurve.ucsd.edu
The Keeling Curve
The Keeling Curve is a daily record of global atmospheric carbon dioxide concentration maintained by Scripps Institution of Oceanography at UC San Diego.
keelingcurve.ucsd.edu
October 29, 2025 at 4:10 AM
424.71 parts per million (ppm) CO2 in air 27-Oct-2025
keelingcurve.ucsd.edu
keelingcurve.ucsd.edu
424.80 parts per million (ppm) CO2 in air 25-Oct-2025
keelingcurve.ucsd.edu
keelingcurve.ucsd.edu
The Keeling Curve
The Keeling Curve is a daily record of global atmospheric carbon dioxide concentration maintained by Scripps Institution of Oceanography at UC San Diego.
keelingcurve.ucsd.edu
October 26, 2025 at 4:13 PM
424.80 parts per million (ppm) CO2 in air 25-Oct-2025
keelingcurve.ucsd.edu
keelingcurve.ucsd.edu
425.45 parts per million (ppm) CO2 in air 24-Oct-2025
keelingcurve.ucsd.edu
keelingcurve.ucsd.edu
The Keeling Curve
The Keeling Curve is a daily record of global atmospheric carbon dioxide concentration maintained by Scripps Institution of Oceanography at UC San Diego.
keelingcurve.ucsd.edu
October 25, 2025 at 4:28 PM
425.45 parts per million (ppm) CO2 in air 24-Oct-2025
keelingcurve.ucsd.edu
keelingcurve.ucsd.edu
424.89 parts per million (ppm) CO2 in air 22-Oct-2025
keelingcurve.ucsd.edu
keelingcurve.ucsd.edu
The Keeling Curve
The Keeling Curve is a daily record of global atmospheric carbon dioxide concentration maintained by Scripps Institution of Oceanography at UC San Diego.
keelingcurve.ucsd.edu
October 23, 2025 at 4:07 PM
424.89 parts per million (ppm) CO2 in air 22-Oct-2025
keelingcurve.ucsd.edu
keelingcurve.ucsd.edu
424.58 parts per million (ppm) CO2 in air 21-Oct-2025
keelingcurve.ucsd.edu
keelingcurve.ucsd.edu
The Keeling Curve
The Keeling Curve is a daily record of global atmospheric carbon dioxide concentration maintained by Scripps Institution of Oceanography at UC San Diego.
keelingcurve.ucsd.edu
October 22, 2025 at 4:29 PM
424.58 parts per million (ppm) CO2 in air 21-Oct-2025
keelingcurve.ucsd.edu
keelingcurve.ucsd.edu
424.66 parts per million (ppm) CO2 in air 20-Oct-2025
keelingcurve.ucsd.edu
keelingcurve.ucsd.edu
The Keeling Curve
The Keeling Curve is a daily record of global atmospheric carbon dioxide concentration maintained by Scripps Institution of Oceanography at UC San Diego.
keelingcurve.ucsd.edu
October 21, 2025 at 6:28 PM
424.66 parts per million (ppm) CO2 in air 20-Oct-2025
keelingcurve.ucsd.edu
keelingcurve.ucsd.edu
Financial Times story regarding effects of recent US government science funding affecting @Scripps_Ocean: urldefense.com/v3/__https:/...

The costs of Trump’s campaign to censor climate science
[FREE TO READ] Datasets have been removed, federal websites scrubbed and thousands of Noaa staff purged. Experts warn disaster defences are at risk
urldefense.com
October 20, 2025 at 6:16 PM
Financial Times story regarding effects of recent US government science funding affecting @Scripps_Ocean: urldefense.com/v3/__https:/...
424.63 parts per million (ppm) CO2 in air 19-Oct-2025
keelingcurve.ucsd.edu
keelingcurve.ucsd.edu
The Keeling Curve
The Keeling Curve is a daily record of global atmospheric carbon dioxide concentration maintained by Scripps Institution of Oceanography at UC San Diego.
keelingcurve.ucsd.edu
October 20, 2025 at 5:39 PM
424.63 parts per million (ppm) CO2 in air 19-Oct-2025
keelingcurve.ucsd.edu
keelingcurve.ucsd.edu
424.59 parts per million (ppm) CO2 in air 18-Oct-2025
keelingcurve.ucsd.edu
keelingcurve.ucsd.edu
The Keeling Curve
The Keeling Curve is a daily record of global atmospheric carbon dioxide concentration maintained by Scripps Institution of Oceanography at UC San Diego.
keelingcurve.ucsd.edu
October 19, 2025 at 8:16 PM
424.59 parts per million (ppm) CO2 in air 18-Oct-2025
keelingcurve.ucsd.edu
keelingcurve.ucsd.edu
424.71 parts per million (ppm) CO2 in air 17-Oct-2025
keelingcurve.ucsd.edu
keelingcurve.ucsd.edu
The Keeling Curve
The Keeling Curve is a daily record of global atmospheric carbon dioxide concentration maintained by Scripps Institution of Oceanography at UC San Diego.
keelingcurve.ucsd.edu
October 19, 2025 at 1:56 AM
424.71 parts per million (ppm) CO2 in air 17-Oct-2025
keelingcurve.ucsd.edu
keelingcurve.ucsd.edu
Baseline reading not available, data too variable 16-Oct-2025
keelingcurve.ucsd.edu
keelingcurve.ucsd.edu
The Keeling Curve
The Keeling Curve is a daily record of global atmospheric carbon dioxide concentration maintained by Scripps Institution of Oceanography at UC San Diego.
keelingcurve.ucsd.edu
October 17, 2025 at 7:43 PM
Baseline reading not available, data too variable 16-Oct-2025
keelingcurve.ucsd.edu
keelingcurve.ucsd.edu
424.58 parts per million (ppm) CO2 in air 15-Oct-2025
keelingcurve.ucsd.edu
keelingcurve.ucsd.edu
The Keeling Curve
The Keeling Curve is a daily record of global atmospheric carbon dioxide concentration maintained by Scripps Institution of Oceanography at UC San Diego.
keelingcurve.ucsd.edu
October 16, 2025 at 6:10 PM
424.58 parts per million (ppm) CO2 in air 15-Oct-2025
keelingcurve.ucsd.edu
keelingcurve.ucsd.edu