


Juanchi Parra
@juanchiparra.bsky.social
#30DayMapChallenge | Day 24 - Places and Their Names
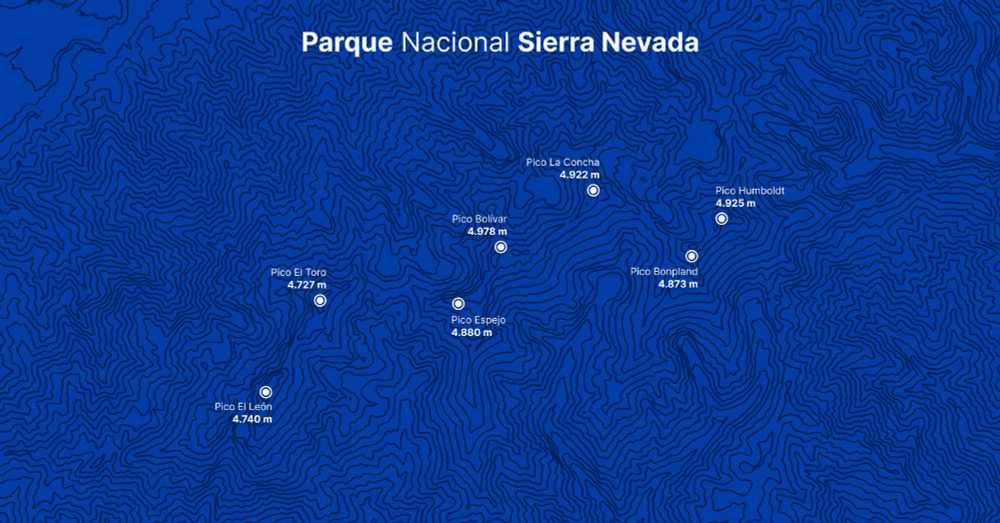
For today's challenge, I created a map of the highest peaks in Parque Nacional Sierra Nevada in Mérida, Venezuela.
Tools: QGIS and Figma
For today's challenge, I created a map of the highest peaks in Parque Nacional Sierra Nevada in Mérida, Venezuela.
Tools: QGIS and Figma
November 24, 2025 at 4:15 PM
#30DayMapChallenge | Day 24 - Places and Their Names
For today's challenge, I created a map of the highest peaks in Parque Nacional Sierra Nevada in Mérida, Venezuela.
Tools: QGIS and Figma
For today's challenge, I created a map of the highest peaks in Parque Nacional Sierra Nevada in Mérida, Venezuela.
Tools: QGIS and Figma
#30DayMapChallenge | Day 21 - Icons
For today's challenge, I used personal data from the routes I run and the cats I greet.
Tools: QGIS + Figma
For today's challenge, I used personal data from the routes I run and the cats I greet.
Tools: QGIS + Figma

November 21, 2025 at 11:35 PM
#30DayMapChallenge | Day 21 - Icons
For today's challenge, I used personal data from the routes I run and the cats I greet.
Tools: QGIS + Figma
For today's challenge, I used personal data from the routes I run and the cats I greet.
Tools: QGIS + Figma
#30DayMapChallenge | Day 20 - Water
For today's challenge, I created a representation of the Mississippi River in the United States using its digital elevation model and light detection and ranging.
Tools: QGIS
For today's challenge, I created a representation of the Mississippi River in the United States using its digital elevation model and light detection and ranging.
Tools: QGIS

November 20, 2025 at 6:56 PM
#30DayMapChallenge | Day 20 - Water
For today's challenge, I created a representation of the Mississippi River in the United States using its digital elevation model and light detection and ranging.
Tools: QGIS
For today's challenge, I created a representation of the Mississippi River in the United States using its digital elevation model and light detection and ranging.
Tools: QGIS
#30DayMapChallenge | Day 19 - Projections
For today's challenge, I chose to use the “d3.geoAiry” projection for the first time, along with world population data by country.
Tools: D3
For today's challenge, I chose to use the “d3.geoAiry” projection for the first time, along with world population data by country.
Tools: D3
November 19, 2025 at 2:43 PM
#30DayMapChallenge | Day 19 - Projections
For today's challenge, I chose to use the “d3.geoAiry” projection for the first time, along with world population data by country.
Tools: D3
For today's challenge, I chose to use the “d3.geoAiry” projection for the first time, along with world population data by country.
Tools: D3
#30DayMapChallenge | Day 18 - Out of this world
For today's challenge, I created a representation of our solar system (somewhat inaccurate).
Tools: D3
For today's challenge, I created a representation of our solar system (somewhat inaccurate).
Tools: D3

November 18, 2025 at 3:22 PM
#30DayMapChallenge | Day 18 - Out of this world
For today's challenge, I created a representation of our solar system (somewhat inaccurate).
Tools: D3
For today's challenge, I created a representation of our solar system (somewhat inaccurate).
Tools: D3
#30DayMapChallenge | Day 17 - A new tool
For today's challenge, I decided to recreate the map from two days ago that shows active fires in Brazil. This time, I made it a hexbin map using R and ggplot2.
For today's challenge, I decided to recreate the map from two days ago that shows active fires in Brazil. This time, I made it a hexbin map using R and ggplot2.

November 17, 2025 at 11:13 PM
#30DayMapChallenge | Day 17 - A new tool
For today's challenge, I decided to recreate the map from two days ago that shows active fires in Brazil. This time, I made it a hexbin map using R and ggplot2.
For today's challenge, I decided to recreate the map from two days ago that shows active fires in Brazil. This time, I made it a hexbin map using R and ggplot2.
#30DayMapChallenge | Day 16 - Cell (Up to Date)
For this challenge, I decided to create a grid map displaying the population of the United States by state.
Tools: D3
For this challenge, I decided to create a grid map displaying the population of the United States by state.
Tools: D3

November 17, 2025 at 11:08 PM
#30DayMapChallenge | Day 16 - Cell (Up to Date)
For this challenge, I decided to create a grid map displaying the population of the United States by state.
Tools: D3
For this challenge, I decided to create a grid map displaying the population of the United States by state.
Tools: D3
#30DayMapChallenge | Day 15 - Fire
For today's challenge, I used data from NASA satellites showing active fires and thermal anomalies in Brazil over the past seven days.
Tools: D3
For today's challenge, I used data from NASA satellites showing active fires and thermal anomalies in Brazil over the past seven days.
Tools: D3

November 16, 2025 at 12:27 AM
#30DayMapChallenge | Day 15 - Fire
For today's challenge, I used data from NASA satellites showing active fires and thermal anomalies in Brazil over the past seven days.
Tools: D3
For today's challenge, I used data from NASA satellites showing active fires and thermal anomalies in Brazil over the past seven days.
Tools: D3
#30DayMapChallenge | Day 14 - OpenStreetMap
For today's challenge, I visualized the roads of Barcelona, Spain.
Tools: QGIS
For today's challenge, I visualized the roads of Barcelona, Spain.
Tools: QGIS

November 14, 2025 at 4:34 PM
#30DayMapChallenge | Day 14 - OpenStreetMap
For today's challenge, I visualized the roads of Barcelona, Spain.
Tools: QGIS
For today's challenge, I visualized the roads of Barcelona, Spain.
Tools: QGIS
#30DayMapChallenge | Day 13 - 10 minute map
For today's challenge, I created a polygon representation of the city of Mérida, Venezuela, including the surrounding mountains.
This is one of the first effects I learned to implement in QGIS, and it took me about 5:42 minutes to complete.
Tools: QGIS
For today's challenge, I created a polygon representation of the city of Mérida, Venezuela, including the surrounding mountains.
This is one of the first effects I learned to implement in QGIS, and it took me about 5:42 minutes to complete.
Tools: QGIS

November 13, 2025 at 2:22 PM
#30DayMapChallenge | Day 13 - 10 minute map
For today's challenge, I created a polygon representation of the city of Mérida, Venezuela, including the surrounding mountains.
This is one of the first effects I learned to implement in QGIS, and it took me about 5:42 minutes to complete.
Tools: QGIS
For today's challenge, I created a polygon representation of the city of Mérida, Venezuela, including the surrounding mountains.
This is one of the first effects I learned to implement in QGIS, and it took me about 5:42 minutes to complete.
Tools: QGIS
#30DayMapChallenge | Day 12 - 2125
For today's challenge, I imagined what some countries might look like in 2125
Can't you see anything beyond the sea? This scenario could become a reality for some low-lying countries as climate change poses a significant threat to their existence
Tools: Figma
For today's challenge, I imagined what some countries might look like in 2125
Can't you see anything beyond the sea? This scenario could become a reality for some low-lying countries as climate change poses a significant threat to their existence
Tools: Figma


November 12, 2025 at 4:47 PM
#30DayMapChallenge | Day 12 - 2125
For today's challenge, I imagined what some countries might look like in 2125
Can't you see anything beyond the sea? This scenario could become a reality for some low-lying countries as climate change poses a significant threat to their existence
Tools: Figma
For today's challenge, I imagined what some countries might look like in 2125
Can't you see anything beyond the sea? This scenario could become a reality for some low-lying countries as climate change poses a significant threat to their existence
Tools: Figma
#30DayMapChallenge | Day 11 - Minimal map
For today's challenge, I visualized the main streets of Caracas.
Tools: QGIS + Figma
For today's challenge, I visualized the main streets of Caracas.
Tools: QGIS + Figma

November 11, 2025 at 4:34 PM
#30DayMapChallenge | Day 11 - Minimal map
For today's challenge, I visualized the main streets of Caracas.
Tools: QGIS + Figma
For today's challenge, I visualized the main streets of Caracas.
Tools: QGIS + Figma
#30DayMapChallenge | Day 10 - Air
For today's challenge, I have mapped the most frequent weekly flight routes from Argentina, Chile, Colombia, and Panama.
Tools: D3 and Svelte
For today's challenge, I have mapped the most frequent weekly flight routes from Argentina, Chile, Colombia, and Panama.
Tools: D3 and Svelte
November 10, 2025 at 9:56 PM
#30DayMapChallenge | Day 10 - Air
For today's challenge, I have mapped the most frequent weekly flight routes from Argentina, Chile, Colombia, and Panama.
Tools: D3 and Svelte
For today's challenge, I have mapped the most frequent weekly flight routes from Argentina, Chile, Colombia, and Panama.
Tools: D3 and Svelte
#30DayMapChallenge | Day 8 - Urban
For today's challenge, I decided to create a map showing the population density of municipalities in Spain.
I was surprised to learn that there are two municipalities with only three inhabitants.
Tools: QGIS and Figma
For today's challenge, I decided to create a map showing the population density of municipalities in Spain.
I was surprised to learn that there are two municipalities with only three inhabitants.
Tools: QGIS and Figma

November 8, 2025 at 7:46 PM
#30DayMapChallenge | Day 8 - Urban
For today's challenge, I decided to create a map showing the population density of municipalities in Spain.
I was surprised to learn that there are two municipalities with only three inhabitants.
Tools: QGIS and Figma
For today's challenge, I decided to create a map showing the population density of municipalities in Spain.
I was surprised to learn that there are two municipalities with only three inhabitants.
Tools: QGIS and Figma
#30DayMapChallenge | Day 7 - Accessibility
To complete this week, I visualized the proximity of healthcare services in Italy by analyzing road travel times.
Tools: QGIS and Figma
To complete this week, I visualized the proximity of healthcare services in Italy by analyzing road travel times.
Tools: QGIS and Figma

November 7, 2025 at 11:05 PM
#30DayMapChallenge | Day 7 - Accessibility
To complete this week, I visualized the proximity of healthcare services in Italy by analyzing road travel times.
Tools: QGIS and Figma
To complete this week, I visualized the proximity of healthcare services in Italy by analyzing road travel times.
Tools: QGIS and Figma
#30DayMapChallenge | Day 6 - Dimensions
For today's challenge, I created a population density map of Chile.
I'm excited to continue improving my skills with QGIS.
Tools: QGIS and Aerialod
For today's challenge, I created a population density map of Chile.
I'm excited to continue improving my skills with QGIS.
Tools: QGIS and Aerialod


November 6, 2025 at 8:20 PM
#30DayMapChallenge | Day 6 - Dimensions
For today's challenge, I created a population density map of Chile.
I'm excited to continue improving my skills with QGIS.
Tools: QGIS and Aerialod
For today's challenge, I created a population density map of Chile.
I'm excited to continue improving my skills with QGIS.
Tools: QGIS and Aerialod
#30DayMapChallenge | Day 5 - Earth
For today's challenge, I transformed a 1963 map from Venezuela's former Ministry of Public Works by incorporating the corresponding elevation and terrain data.
Tools: QGIS and Blender
For today's challenge, I transformed a 1963 map from Venezuela's former Ministry of Public Works by incorporating the corresponding elevation and terrain data.
Tools: QGIS and Blender


November 6, 2025 at 1:31 AM
#30DayMapChallenge | Day 5 - Earth
For today's challenge, I transformed a 1963 map from Venezuela's former Ministry of Public Works by incorporating the corresponding elevation and terrain data.
Tools: QGIS and Blender
For today's challenge, I transformed a 1963 map from Venezuela's former Ministry of Public Works by incorporating the corresponding elevation and terrain data.
Tools: QGIS and Blender
#30DayMapChallenge | Day 4 - My data
For today's challenge, I analyzed data from my running activities (14 months)
• Activities: 168
• Total hours: 196,9
• Total distance: 1.717,27 kilometers
• Average per day: 10,47 kilometers
Tools: Strava, Svelte and MapLibre GL JS + CARTO
For today's challenge, I analyzed data from my running activities (14 months)
• Activities: 168
• Total hours: 196,9
• Total distance: 1.717,27 kilometers
• Average per day: 10,47 kilometers
Tools: Strava, Svelte and MapLibre GL JS + CARTO


November 5, 2025 at 3:43 AM
#30DayMapChallenge | Day 4 - My data
For today's challenge, I analyzed data from my running activities (14 months)
• Activities: 168
• Total hours: 196,9
• Total distance: 1.717,27 kilometers
• Average per day: 10,47 kilometers
Tools: Strava, Svelte and MapLibre GL JS + CARTO
For today's challenge, I analyzed data from my running activities (14 months)
• Activities: 168
• Total hours: 196,9
• Total distance: 1.717,27 kilometers
• Average per day: 10,47 kilometers
Tools: Strava, Svelte and MapLibre GL JS + CARTO
#30DayMapChallenge | Day 3 - Polygons (up to date)
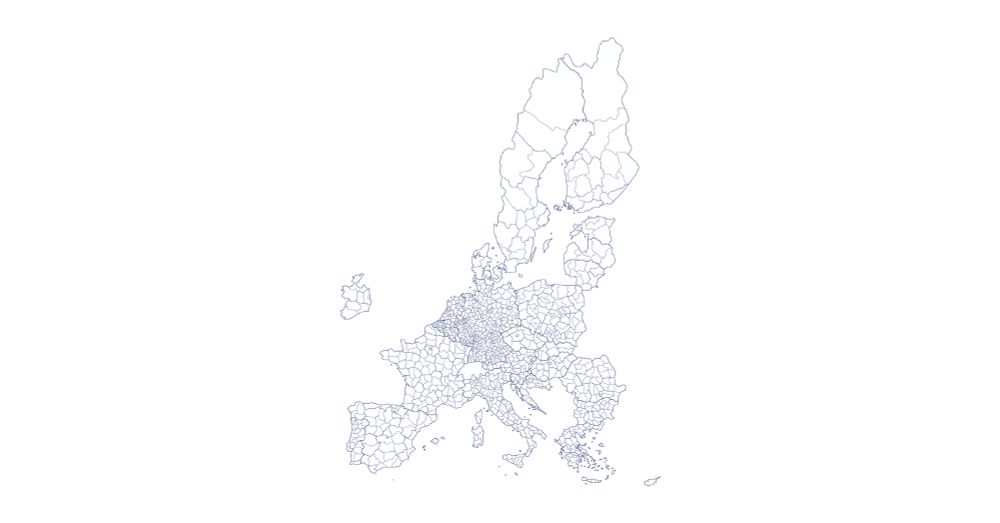
For this challenge, I chose to illustrate the borders of the countries in the European Union.
Tools: D3
For this challenge, I chose to illustrate the borders of the countries in the European Union.
Tools: D3

November 5, 2025 at 3:37 AM
#30DayMapChallenge | Day 3 - Polygons (up to date)
For this challenge, I chose to illustrate the borders of the countries in the European Union.
Tools: D3
For this challenge, I chose to illustrate the borders of the countries in the European Union.
Tools: D3
#30DayMapChallenge | Day 2 - Lines (up to date)
For the second challenge, I mapped the rivers and waterways in North America.
Tools: QGIS and D3
For the second challenge, I mapped the rivers and waterways in North America.
Tools: QGIS and D3

November 5, 2025 at 3:30 AM
#30DayMapChallenge | Day 2 - Lines (up to date)
For the second challenge, I mapped the rivers and waterways in North America.
Tools: QGIS and D3
For the second challenge, I mapped the rivers and waterways in North America.
Tools: QGIS and D3
#30DayMapChallenge | Day 1 - Points (Up to Date)
For the first challenge, I represented the geographical distribution of over 15,000 Starbucks locations in the United States.
Tools: D3
For the first challenge, I represented the geographical distribution of over 15,000 Starbucks locations in the United States.
Tools: D3

November 5, 2025 at 3:25 AM
#30DayMapChallenge | Day 1 - Points (Up to Date)
For the first challenge, I represented the geographical distribution of over 15,000 Starbucks locations in the United States.
Tools: D3
For the first challenge, I represented the geographical distribution of over 15,000 Starbucks locations in the United States.
Tools: D3
I'm excited to participate in the #30DayMapChallenge for the first time! The challenge started a few days ago, and due to my limited time and my experiments with Blender, I haven't had the chance to publish my maps yet. While I'm not sure if I'll be able to create all 30 maps...
November 5, 2025 at 3:17 AM
I'm excited to participate in the #30DayMapChallenge for the first time! The challenge started a few days ago, and due to my limited time and my experiments with Blender, I haven't had the chance to publish my maps yet. While I'm not sure if I'll be able to create all 30 maps...
#30DayChartChallenge | Day 30 - National Geographic
For this last challenge, I moved away from the main idea and the prompt, but I liked the result. Very happy to have done all the challenges.
For those who want to see the source code: github.com/juanchiparra...
For this last challenge, I moved away from the main idea and the prompt, but I liked the result. Very happy to have done all the challenges.
For those who want to see the source code: github.com/juanchiparra...
May 1, 2025 at 2:32 AM
#30DayChartChallenge | Day 30 - National Geographic
For this last challenge, I moved away from the main idea and the prompt, but I liked the result. Very happy to have done all the challenges.
For those who want to see the source code: github.com/juanchiparra...
For this last challenge, I moved away from the main idea and the prompt, but I liked the result. Very happy to have done all the challenges.
For those who want to see the source code: github.com/juanchiparra...
#30DayChartChallenge | Day 29 - Extraterrestrial
For today's challenge, I designed my first word cloud, I had the perfect data to do it and didn't want to miss the opportunity. d3-cloud makes it very easy to design.
For those who want to see the source code: github.com/juanchiparra...
For today's challenge, I designed my first word cloud, I had the perfect data to do it and didn't want to miss the opportunity. d3-cloud makes it very easy to design.
For those who want to see the source code: github.com/juanchiparra...

April 30, 2025 at 1:45 AM
#30DayChartChallenge | Day 29 - Extraterrestrial
For today's challenge, I designed my first word cloud, I had the perfect data to do it and didn't want to miss the opportunity. d3-cloud makes it very easy to design.
For those who want to see the source code: github.com/juanchiparra...
For today's challenge, I designed my first word cloud, I had the perfect data to do it and didn't want to miss the opportunity. d3-cloud makes it very easy to design.
For those who want to see the source code: github.com/juanchiparra...
#30DayChartChallenge | Day 25 to 28 - Risk, Monochrome, Noise and Inclusion
Today, it was time to catch up and do the four challenges I had pending. Only two more to go.
For those who want to see the source code: github.com/juanchiparra...
Today, it was time to catch up and do the four challenges I had pending. Only two more to go.
For those who want to see the source code: github.com/juanchiparra...


April 29, 2025 at 12:07 AM
#30DayChartChallenge | Day 25 to 28 - Risk, Monochrome, Noise and Inclusion
Today, it was time to catch up and do the four challenges I had pending. Only two more to go.
For those who want to see the source code: github.com/juanchiparra...
Today, it was time to catch up and do the four challenges I had pending. Only two more to go.
For those who want to see the source code: github.com/juanchiparra...