


Joseph Shapiro
@joseph-s-shapiro.bsky.social
Econ prof: environmental/energy, trade, public, health econ.
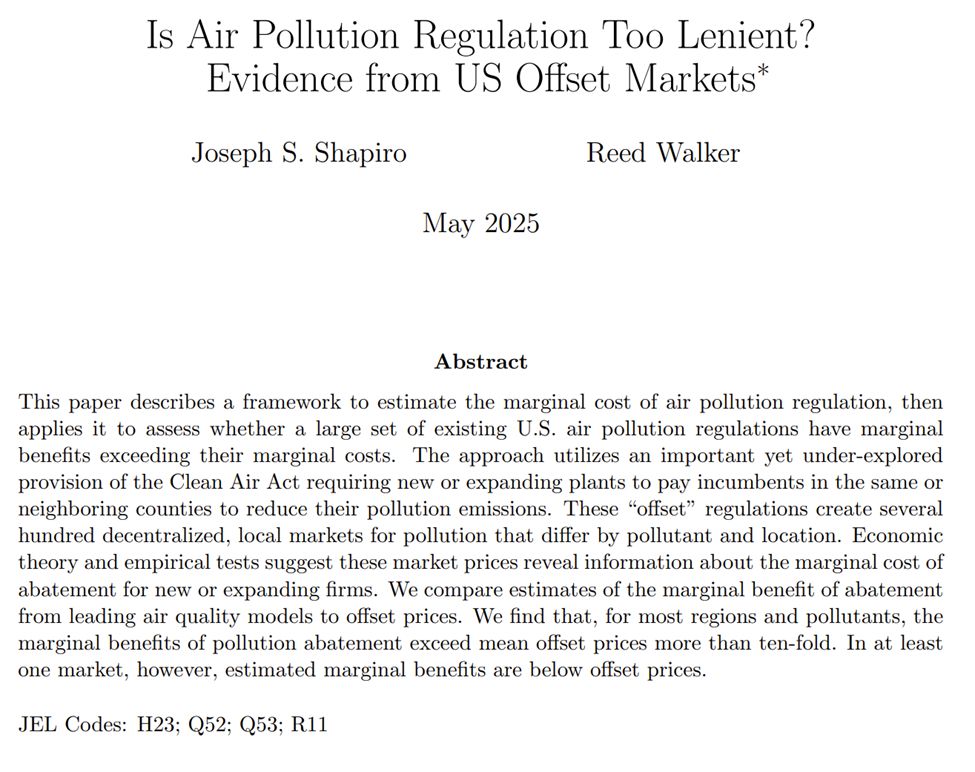
Excited to see our paper in print! 'Is Air Pollution Regulation Too Lenient? Evidence from US Offset Markets.' www.aeaweb.org/articles?id=...

August 28, 2025 at 1:45 PM
Excited to see our paper in print! 'Is Air Pollution Regulation Too Lenient? Evidence from US Offset Markets.' www.aeaweb.org/articles?id=...
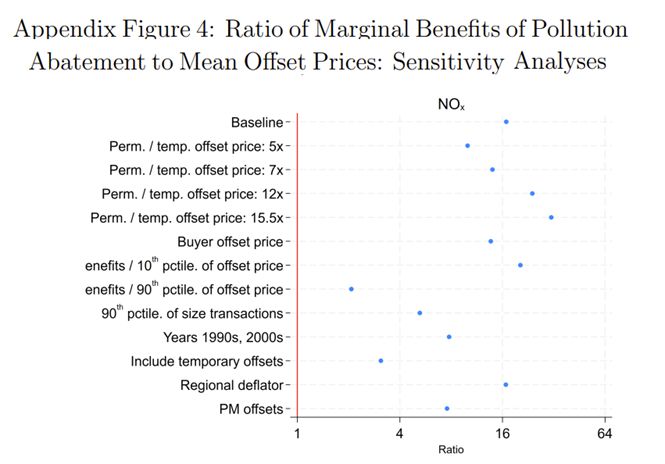
Robust findings: 🛠️📑
Other ways of aggregating offset price data give similar conclusions: marginal benefits of air pollution control ≫ marginal costs in most US regions
6/
Other ways of aggregating offset price data give similar conclusions: marginal benefits of air pollution control ≫ marginal costs in most US regions
6/
June 27, 2025 at 1:46 PM
Robust findings: 🛠️📑
Other ways of aggregating offset price data give similar conclusions: marginal benefits of air pollution control ≫ marginal costs in most US regions
6/
Other ways of aggregating offset price data give similar conclusions: marginal benefits of air pollution control ≫ marginal costs in most US regions
6/
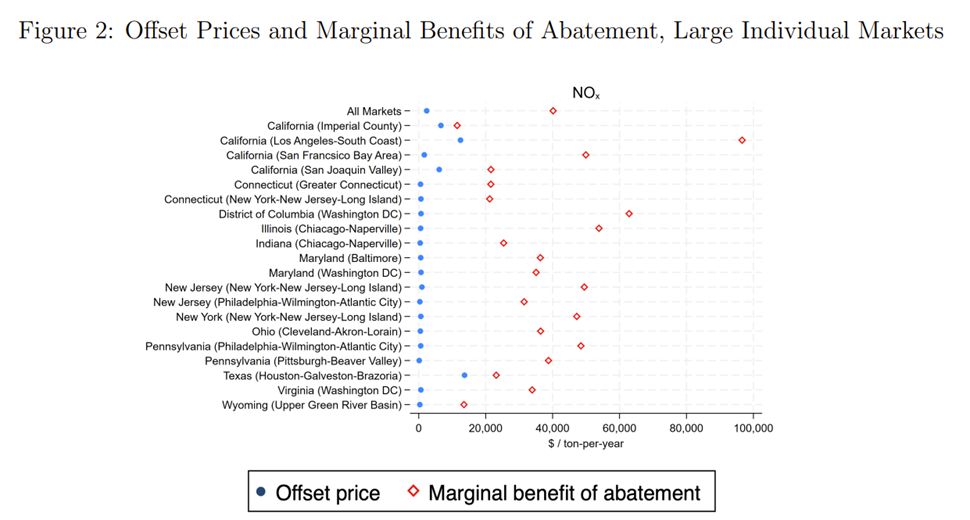
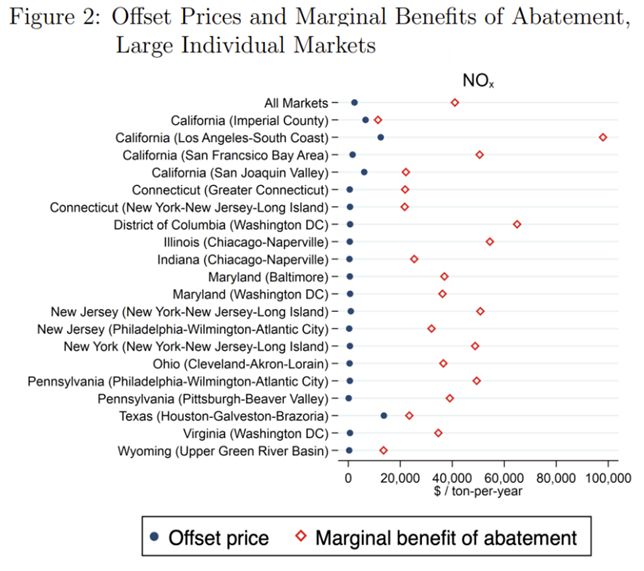
Striking result: 🚨
Average benefit of NOₓ control > $40,000/ton Average cost <= $4,000/ton
That’s 10× gap. VOCs yield similar findings.
Some markets are more lenient than others:
5/
Average benefit of NOₓ control > $40,000/ton Average cost <= $4,000/ton
That’s 10× gap. VOCs yield similar findings.
Some markets are more lenient than others:
5/
June 27, 2025 at 1:46 PM
Striking result: 🚨
Average benefit of NOₓ control > $40,000/ton Average cost <= $4,000/ton
That’s 10× gap. VOCs yield similar findings.
Some markets are more lenient than others:
5/
Average benefit of NOₓ control > $40,000/ton Average cost <= $4,000/ton
That’s 10× gap. VOCs yield similar findings.
Some markets are more lenient than others:
5/
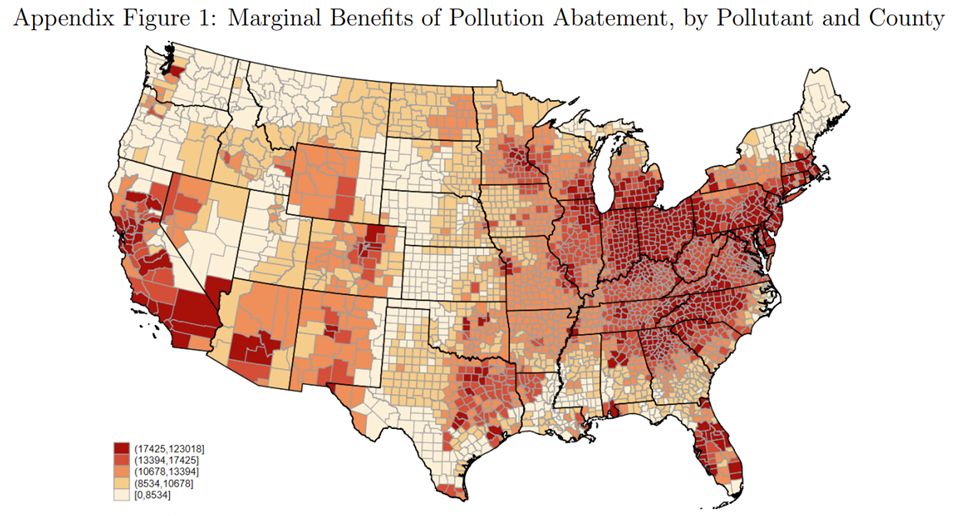
Then we compare: 📈📉
We compare control costs estimated from pollution offsets against model-based health benefits (AP2, AP3, InMAP, EASIUR) to estimate the net gains from reducing pollution.
One input from AP3 model: marginal benefits of cutting NOₓ by location 🗺️ 👇
4/
We compare control costs estimated from pollution offsets against model-based health benefits (AP2, AP3, InMAP, EASIUR) to estimate the net gains from reducing pollution.
One input from AP3 model: marginal benefits of cutting NOₓ by location 🗺️ 👇
4/
June 27, 2025 at 1:46 PM
Then we compare: 📈📉
We compare control costs estimated from pollution offsets against model-based health benefits (AP2, AP3, InMAP, EASIUR) to estimate the net gains from reducing pollution.
One input from AP3 model: marginal benefits of cutting NOₓ by location 🗺️ 👇
4/
We compare control costs estimated from pollution offsets against model-based health benefits (AP2, AP3, InMAP, EASIUR) to estimate the net gains from reducing pollution.
One input from AP3 model: marginal benefits of cutting NOₓ by location 🗺️ 👇
4/
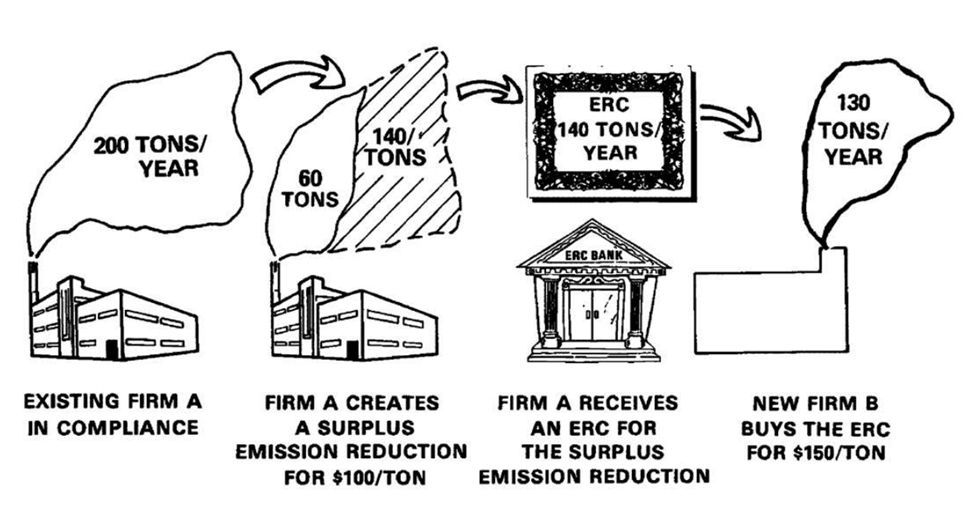
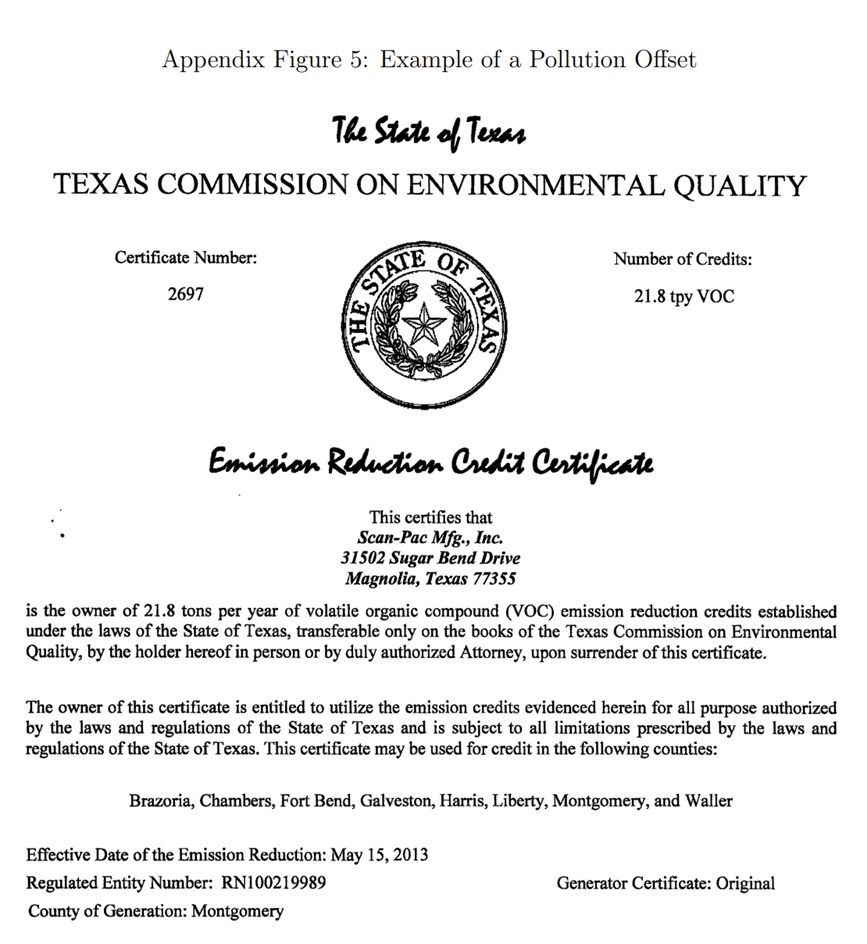
How offsets work:⚖️
New factories in polluted cities must “offset” emissions by paying existing plants in same region to reduce pollutant.
On margin, firms should equate offset prices to marginal cost of pollution control 💵
ERC = emissions reduction credit = offset
3/
New factories in polluted cities must “offset” emissions by paying existing plants in same region to reduce pollutant.
On margin, firms should equate offset prices to marginal cost of pollution control 💵
ERC = emissions reduction credit = offset
3/
June 27, 2025 at 1:46 PM
How offsets work:⚖️
New factories in polluted cities must “offset” emissions by paying existing plants in same region to reduce pollutant.
On margin, firms should equate offset prices to marginal cost of pollution control 💵
ERC = emissions reduction credit = offset
3/
New factories in polluted cities must “offset” emissions by paying existing plants in same region to reduce pollutant.
On margin, firms should equate offset prices to marginal cost of pollution control 💵
ERC = emissions reduction credit = offset
3/
Approach: 🔍
We use prices from air pollution offset markets to estimate marginal costs of pollution control.
Each pollutant × region has own market.
100s of separate markets, distinct from cap-and-trade 🗺️📊
Example offset:
2/
We use prices from air pollution offset markets to estimate marginal costs of pollution control.
Each pollutant × region has own market.
100s of separate markets, distinct from cap-and-trade 🗺️📊
Example offset:
2/
June 27, 2025 at 1:46 PM
Approach: 🔍
We use prices from air pollution offset markets to estimate marginal costs of pollution control.
Each pollutant × region has own market.
100s of separate markets, distinct from cap-and-trade 🗺️📊
Example offset:
2/
We use prices from air pollution offset markets to estimate marginal costs of pollution control.
Each pollutant × region has own market.
100s of separate markets, distinct from cap-and-trade 🗺️📊
Example offset:
2/
Is US air pollution regulation too lenient? 🏭💸
We find marginal benefits of pollution control exceed marginal costs by >10×.
New evidence from dozens of US pollution offset markets.
📄forthcoming at AER, w/ Reed Walker: joseph-s-shapiro.com/research/IsA...
1/🧵
We find marginal benefits of pollution control exceed marginal costs by >10×.
New evidence from dozens of US pollution offset markets.
📄forthcoming at AER, w/ Reed Walker: joseph-s-shapiro.com/research/IsA...
1/🧵
June 27, 2025 at 1:46 PM
Is US air pollution regulation too lenient? 🏭💸
We find marginal benefits of pollution control exceed marginal costs by >10×.
New evidence from dozens of US pollution offset markets.
📄forthcoming at AER, w/ Reed Walker: joseph-s-shapiro.com/research/IsA...
1/🧵
We find marginal benefits of pollution control exceed marginal costs by >10×.
New evidence from dozens of US pollution offset markets.
📄forthcoming at AER, w/ Reed Walker: joseph-s-shapiro.com/research/IsA...
1/🧵
Striking result: 🚨
Average benefit of NOₓ control > $40,000/ton
Average cost <= $4,000/ton
That’s 10× gap. VOCs yield similar findings.
Some markets are more lenient than others:
5/
Average benefit of NOₓ control > $40,000/ton
Average cost <= $4,000/ton
That’s 10× gap. VOCs yield similar findings.
Some markets are more lenient than others:
5/
June 27, 2025 at 1:25 PM
Striking result: 🚨
Average benefit of NOₓ control > $40,000/ton
Average cost <= $4,000/ton
That’s 10× gap. VOCs yield similar findings.
Some markets are more lenient than others:
5/
Average benefit of NOₓ control > $40,000/ton
Average cost <= $4,000/ton
That’s 10× gap. VOCs yield similar findings.
Some markets are more lenient than others:
5/
Then we compare: 📈📉
We compare control costs estimated from pollution offsets against model-based health benefits (AP2, AP3, InMAP, EASIUR) to estimate the net gains from reducing pollution.
One input from AP3 model: marginal benefits of cutting NOₓ by location 🗺️ 👇
4/
We compare control costs estimated from pollution offsets against model-based health benefits (AP2, AP3, InMAP, EASIUR) to estimate the net gains from reducing pollution.
One input from AP3 model: marginal benefits of cutting NOₓ by location 🗺️ 👇
4/
June 27, 2025 at 1:25 PM
Then we compare: 📈📉
We compare control costs estimated from pollution offsets against model-based health benefits (AP2, AP3, InMAP, EASIUR) to estimate the net gains from reducing pollution.
One input from AP3 model: marginal benefits of cutting NOₓ by location 🗺️ 👇
4/
We compare control costs estimated from pollution offsets against model-based health benefits (AP2, AP3, InMAP, EASIUR) to estimate the net gains from reducing pollution.
One input from AP3 model: marginal benefits of cutting NOₓ by location 🗺️ 👇
4/
How offsets work:⚖️
New factories in polluted cities must “offset” emissions by paying existing plants in same region to reduce pollutant.
On margin, firms should equate offset prices to marginal cost of pollution control 💵
ERC = emissions reduction credit = offset
3/
New factories in polluted cities must “offset” emissions by paying existing plants in same region to reduce pollutant.
On margin, firms should equate offset prices to marginal cost of pollution control 💵
ERC = emissions reduction credit = offset
3/
June 27, 2025 at 1:25 PM
How offsets work:⚖️
New factories in polluted cities must “offset” emissions by paying existing plants in same region to reduce pollutant.
On margin, firms should equate offset prices to marginal cost of pollution control 💵
ERC = emissions reduction credit = offset
3/
New factories in polluted cities must “offset” emissions by paying existing plants in same region to reduce pollutant.
On margin, firms should equate offset prices to marginal cost of pollution control 💵
ERC = emissions reduction credit = offset
3/
Approach: 🔍
We use prices from air pollution offset markets to estimate marginal costs of pollution control.
Each pollutant × region has own market. 100s of separate markets, distinct from cap-and-trade 🗺️📊
Example offset:
2/
We use prices from air pollution offset markets to estimate marginal costs of pollution control.
Each pollutant × region has own market. 100s of separate markets, distinct from cap-and-trade 🗺️📊
Example offset:
2/
June 27, 2025 at 1:25 PM
Approach: 🔍
We use prices from air pollution offset markets to estimate marginal costs of pollution control.
Each pollutant × region has own market. 100s of separate markets, distinct from cap-and-trade 🗺️📊
Example offset:
2/
We use prices from air pollution offset markets to estimate marginal costs of pollution control.
Each pollutant × region has own market. 100s of separate markets, distinct from cap-and-trade 🗺️📊
Example offset:
2/
12/
Thanks for reading!
paper: joseph-s-shapiro.com/research/Spa...
slides: joseph-s-shapiro.com/research/SEE...
Thanks for reading!
paper: joseph-s-shapiro.com/research/Spa...
slides: joseph-s-shapiro.com/research/SEE...
January 26, 2025 at 6:12 PM
12/
Thanks for reading!
paper: joseph-s-shapiro.com/research/Spa...
slides: joseph-s-shapiro.com/research/SEE...
Thanks for reading!
paper: joseph-s-shapiro.com/research/Spa...
slides: joseph-s-shapiro.com/research/SEE...
11/
Additional topic: enviro federalism. Who should tackle environmental problems—federal or local governments?
Choice depends on spatial externalities & political economy.
Thorny: example: US Clean Water Act and wetland protection.
Pic: www.science.org/doi/10.1126/...
Additional topic: enviro federalism. Who should tackle environmental problems—federal or local governments?
Choice depends on spatial externalities & political economy.
Thorny: example: US Clean Water Act and wetland protection.
Pic: www.science.org/doi/10.1126/...

January 26, 2025 at 6:12 PM
11/
Additional topic: enviro federalism. Who should tackle environmental problems—federal or local governments?
Choice depends on spatial externalities & political economy.
Thorny: example: US Clean Water Act and wetland protection.
Pic: www.science.org/doi/10.1126/...
Additional topic: enviro federalism. Who should tackle environmental problems—federal or local governments?
Choice depends on spatial externalities & political economy.
Thorny: example: US Clean Water Act and wetland protection.
Pic: www.science.org/doi/10.1126/...
10/
Additional decision for enviro-spatial research: how do industry characteristics matter?
Dirty industries: returns to scale (cement); spatial differentiation (hi weight/value ratio); upstream; sunk costs
Rust belt example: Bethlehem Steel plant built the Golden Gate Bridge, now is a casino 🎲
Additional decision for enviro-spatial research: how do industry characteristics matter?
Dirty industries: returns to scale (cement); spatial differentiation (hi weight/value ratio); upstream; sunk costs
Rust belt example: Bethlehem Steel plant built the Golden Gate Bridge, now is a casino 🎲

January 26, 2025 at 6:12 PM
10/
Additional decision for enviro-spatial research: how do industry characteristics matter?
Dirty industries: returns to scale (cement); spatial differentiation (hi weight/value ratio); upstream; sunk costs
Rust belt example: Bethlehem Steel plant built the Golden Gate Bridge, now is a casino 🎲
Additional decision for enviro-spatial research: how do industry characteristics matter?
Dirty industries: returns to scale (cement); spatial differentiation (hi weight/value ratio); upstream; sunk costs
Rust belt example: Bethlehem Steel plant built the Golden Gate Bridge, now is a casino 🎲
9/
Another decision for spatial/enviro papers: how/whether analyze environmental inequality? Pollution can vary by income, race.🏘️🌫️
Example: air pollution and income linked via Environmental Kuznets Curve? Remote sensing data:
Another decision for spatial/enviro papers: how/whether analyze environmental inequality? Pollution can vary by income, race.🏘️🌫️
Example: air pollution and income linked via Environmental Kuznets Curve? Remote sensing data:

January 26, 2025 at 6:12 PM
9/
Another decision for spatial/enviro papers: how/whether analyze environmental inequality? Pollution can vary by income, race.🏘️🌫️
Example: air pollution and income linked via Environmental Kuznets Curve? Remote sensing data:
Another decision for spatial/enviro papers: how/whether analyze environmental inequality? Pollution can vary by income, race.🏘️🌫️
Example: air pollution and income linked via Environmental Kuznets Curve? Remote sensing data:
8/
Writing a spatial-enviro paper? 🌍
Many important decisions. One:
Which planner’s perspective? Local, national, global? All are important, different.
e.g, US loves $7500 EV subsidies, partly due to int'l profit shifting; global perspective is mixed.
From joseph-s-shapiro.com/research/EVT...
Writing a spatial-enviro paper? 🌍
Many important decisions. One:
Which planner’s perspective? Local, national, global? All are important, different.
e.g, US loves $7500 EV subsidies, partly due to int'l profit shifting; global perspective is mixed.
From joseph-s-shapiro.com/research/EVT...

January 26, 2025 at 6:12 PM
8/
Writing a spatial-enviro paper? 🌍
Many important decisions. One:
Which planner’s perspective? Local, national, global? All are important, different.
e.g, US loves $7500 EV subsidies, partly due to int'l profit shifting; global perspective is mixed.
From joseph-s-shapiro.com/research/EVT...
Writing a spatial-enviro paper? 🌍
Many important decisions. One:
Which planner’s perspective? Local, national, global? All are important, different.
e.g, US loves $7500 EV subsidies, partly due to int'l profit shifting; global perspective is mixed.
From joseph-s-shapiro.com/research/EVT...
7/
Classic models (public goods, Hotelling, Rosen/Roback, ...) have limited spatial-environmental links.
Space is often "here" or “anywhere else”; cities have limited geography.
Example: is Clean Air too lenient? NYC/Boston no closer than NYC/LA
Pic from joseph-s-shapiro.com/research/IsA...
Classic models (public goods, Hotelling, Rosen/Roback, ...) have limited spatial-environmental links.
Space is often "here" or “anywhere else”; cities have limited geography.
Example: is Clean Air too lenient? NYC/Boston no closer than NYC/LA
Pic from joseph-s-shapiro.com/research/IsA...
January 26, 2025 at 6:12 PM
7/
Classic models (public goods, Hotelling, Rosen/Roback, ...) have limited spatial-environmental links.
Space is often "here" or “anywhere else”; cities have limited geography.
Example: is Clean Air too lenient? NYC/Boston no closer than NYC/LA
Pic from joseph-s-shapiro.com/research/IsA...
Classic models (public goods, Hotelling, Rosen/Roback, ...) have limited spatial-environmental links.
Space is often "here" or “anywhere else”; cities have limited geography.
Example: is Clean Air too lenient? NYC/Boston no closer than NYC/LA
Pic from joseph-s-shapiro.com/research/IsA...
6/
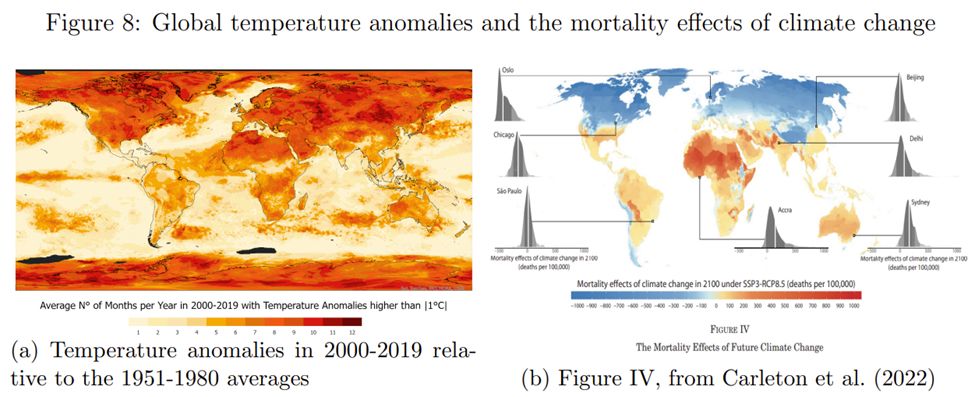
Fact #3: spatial variation in damage functions drives social welfare.
Effect of enviro on well-being depends on choices, tech, endowments.
🌡️e.g., Climate change increases temps most in far North/South, increases mortality most near equator. Pic from academic.oup.com/qje/article-...
Fact #3: spatial variation in damage functions drives social welfare.
Effect of enviro on well-being depends on choices, tech, endowments.
🌡️e.g., Climate change increases temps most in far North/South, increases mortality most near equator. Pic from academic.oup.com/qje/article-...
January 26, 2025 at 6:12 PM
6/
Fact #3: spatial variation in damage functions drives social welfare.
Effect of enviro on well-being depends on choices, tech, endowments.
🌡️e.g., Climate change increases temps most in far North/South, increases mortality most near equator. Pic from academic.oup.com/qje/article-...
Fact #3: spatial variation in damage functions drives social welfare.
Effect of enviro on well-being depends on choices, tech, endowments.
🌡️e.g., Climate change increases temps most in far North/South, increases mortality most near equator. Pic from academic.oup.com/qje/article-...
5/
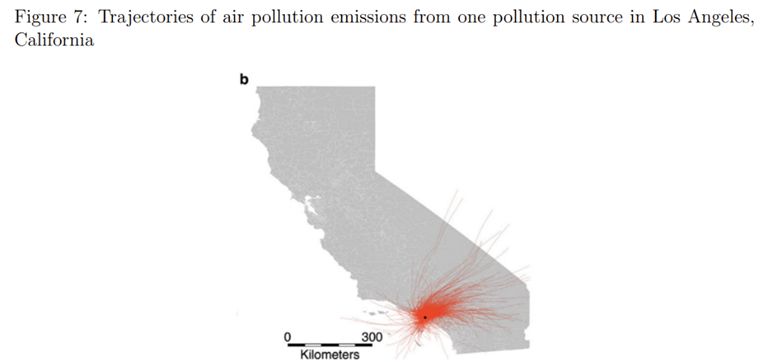
Fact #2: Spatial forces (wind, streamflow) transmit environmental quality. 🌬️🌊 Canonical spatial models reflect movement of workers/goods/ideas, not enviro externalities.
Pic from @hernandezcortes.bsky.social @kylemeng.com www.sciencedirect.com/science/arti...
Fact #2: Spatial forces (wind, streamflow) transmit environmental quality. 🌬️🌊 Canonical spatial models reflect movement of workers/goods/ideas, not enviro externalities.
Pic from @hernandezcortes.bsky.social @kylemeng.com www.sciencedirect.com/science/arti...
January 26, 2025 at 6:12 PM
5/
Fact #2: Spatial forces (wind, streamflow) transmit environmental quality. 🌬️🌊 Canonical spatial models reflect movement of workers/goods/ideas, not enviro externalities.
Pic from @hernandezcortes.bsky.social @kylemeng.com www.sciencedirect.com/science/arti...
Fact #2: Spatial forces (wind, streamflow) transmit environmental quality. 🌬️🌊 Canonical spatial models reflect movement of workers/goods/ideas, not enviro externalities.
Pic from @hernandezcortes.bsky.social @kylemeng.com www.sciencedirect.com/science/arti...
4/
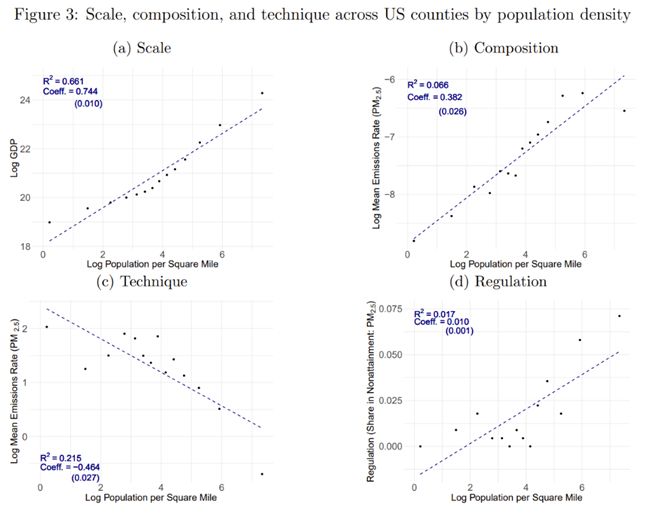
More densely populated US counties = more GDP (scale) + dirtier industries (composition) + cleaner production (technique, thanks partly to tighter regulation). 🌆
Again, space drives the generation of environmental damages.
More densely populated US counties = more GDP (scale) + dirtier industries (composition) + cleaner production (technique, thanks partly to tighter regulation). 🌆
Again, space drives the generation of environmental damages.
January 26, 2025 at 6:12 PM
4/
More densely populated US counties = more GDP (scale) + dirtier industries (composition) + cleaner production (technique, thanks partly to tighter regulation). 🌆
Again, space drives the generation of environmental damages.
More densely populated US counties = more GDP (scale) + dirtier industries (composition) + cleaner production (technique, thanks partly to tighter regulation). 🌆
Again, space drives the generation of environmental damages.
3/
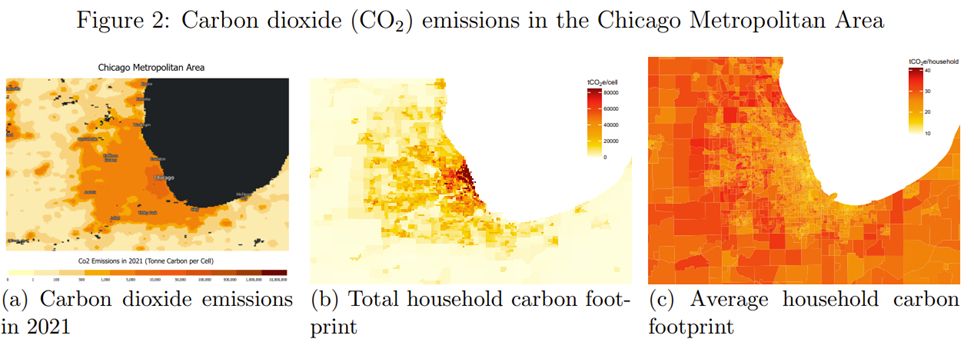
Measurement matters: Is pollution from city centers or suburbs? 🚗🏙️ Depends if we consider emissions by production or consumption. Either way, space drives pollution.
📊Chapter slides: joseph-s-shapiro.com/research/SEE...
Measurement matters: Is pollution from city centers or suburbs? 🚗🏙️ Depends if we consider emissions by production or consumption. Either way, space drives pollution.
📊Chapter slides: joseph-s-shapiro.com/research/SEE...
January 26, 2025 at 6:12 PM
3/
Measurement matters: Is pollution from city centers or suburbs? 🚗🏙️ Depends if we consider emissions by production or consumption. Either way, space drives pollution.
📊Chapter slides: joseph-s-shapiro.com/research/SEE...
Measurement matters: Is pollution from city centers or suburbs? 🚗🏙️ Depends if we consider emissions by production or consumption. Either way, space drives pollution.
📊Chapter slides: joseph-s-shapiro.com/research/SEE...
2/
Can combining environmental & spatial economics unlock insights for research & policy? 🤔
Start w stylized facts on space & pollution.
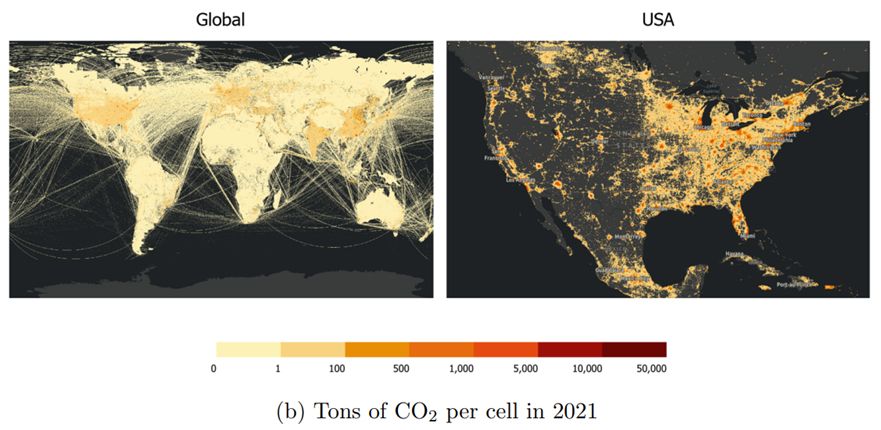
Fact #1: spatial forces drive polluting activity. Example: CO2 emissions reflect density/transportation
📄Chapter: joseph-s-shapiro.com/research/Spa...
Can combining environmental & spatial economics unlock insights for research & policy? 🤔
Start w stylized facts on space & pollution.
Fact #1: spatial forces drive polluting activity. Example: CO2 emissions reflect density/transportation
📄Chapter: joseph-s-shapiro.com/research/Spa...
January 26, 2025 at 6:12 PM
2/
Can combining environmental & spatial economics unlock insights for research & policy? 🤔
Start w stylized facts on space & pollution.
Fact #1: spatial forces drive polluting activity. Example: CO2 emissions reflect density/transportation
📄Chapter: joseph-s-shapiro.com/research/Spa...
Can combining environmental & spatial economics unlock insights for research & policy? 🤔
Start w stylized facts on space & pollution.
Fact #1: spatial forces drive polluting activity. Example: CO2 emissions reflect density/transportation
📄Chapter: joseph-s-shapiro.com/research/Spa...
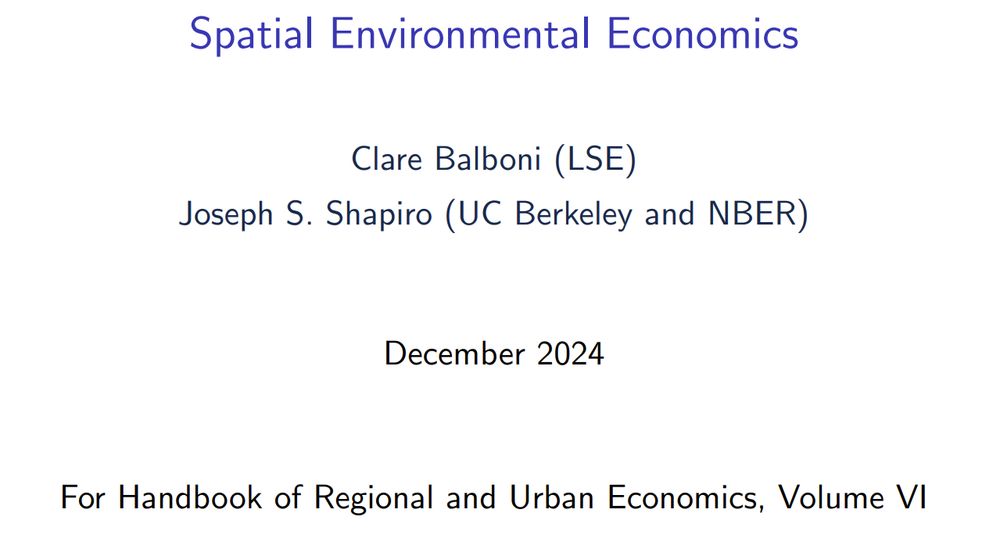
1/🚨New chapter in Handbook of Regional & Urban Economics: Spatial Environmental Economics
🌍 How do spatial forces affect the environment? How does enviro shape spatial outcomes?
Thread, chapter explore this nascent subfield via stylized acts, models, building blocks for rsrch. w Clare Balboni.
🌍 How do spatial forces affect the environment? How does enviro shape spatial outcomes?
Thread, chapter explore this nascent subfield via stylized acts, models, building blocks for rsrch. w Clare Balboni.
January 26, 2025 at 6:12 PM
1/🚨New chapter in Handbook of Regional & Urban Economics: Spatial Environmental Economics
🌍 How do spatial forces affect the environment? How does enviro shape spatial outcomes?
Thread, chapter explore this nascent subfield via stylized acts, models, building blocks for rsrch. w Clare Balboni.
🌍 How do spatial forces affect the environment? How does enviro shape spatial outcomes?
Thread, chapter explore this nascent subfield via stylized acts, models, building blocks for rsrch. w Clare Balboni.
Exciting morning--our work on electric vehicles and the Inflation Reduction Act is the lead front page NYT story, paragraph 2: www.nytimes.com/2024/11/25/b...

November 25, 2024 at 1:12 PM
Exciting morning--our work on electric vehicles and the Inflation Reduction Act is the lead front page NYT story, paragraph 2: www.nytimes.com/2024/11/25/b...
US solar stocks tanked 12-50% on election news.📉 Stark reminder, policy powers clean energy markets.

November 7, 2024 at 1:56 PM
US solar stocks tanked 12-50% on election news.📉 Stark reminder, policy powers clean energy markets.