- living in France 🥖
- doing open source 🐍
- and data visualization 📈
barbierjoseph.com

We’re hosting a livestream this Wednesday on using Typst to design better, more professional PDFs.
November 19 at 10am Pacific on YouTube.
Join us live + bring your questions: buff.ly/YZ2uJbI
#rstats

We’re hosting a livestream this Wednesday on using Typst to design better, more professional PDFs.
November 19 at 10am Pacific on YouTube.
Join us live + bring your questions: buff.ly/YZ2uJbI
#rstats

It's still in its early stages, but it implements:
- ✅ all Typst functions
- ✅ set rules
- ✅ conversion from R to Typst (`NULL` becomes `none`, etc)
- ✅ no dependencies
github.com/y-sunflower/r2typ

It's still in its early stages, but it implements:
- ✅ all Typst functions
- ✅ set rules
- ✅ conversion from R to Typst (`NULL` becomes `none`, etc)
- ✅ no dependencies
github.com/y-sunflower/r2typ
Very happy to announce Yellow Sunflower, an open-source & consulting company that focuses on data science, especially data visualization and storytelling!
Learn more in the announcement blog post: ysunflower.com/blog/introducing-yellow-sunflower

Very happy to announce Yellow Sunflower, an open-source & consulting company that focuses on data science, especially data visualization and storytelling!
Learn more in the announcement blog post: ysunflower.com/blog/introducing-yellow-sunflower
I can't get enough of testthat messages 🥲

I can't get enough of testthat messages 🥲
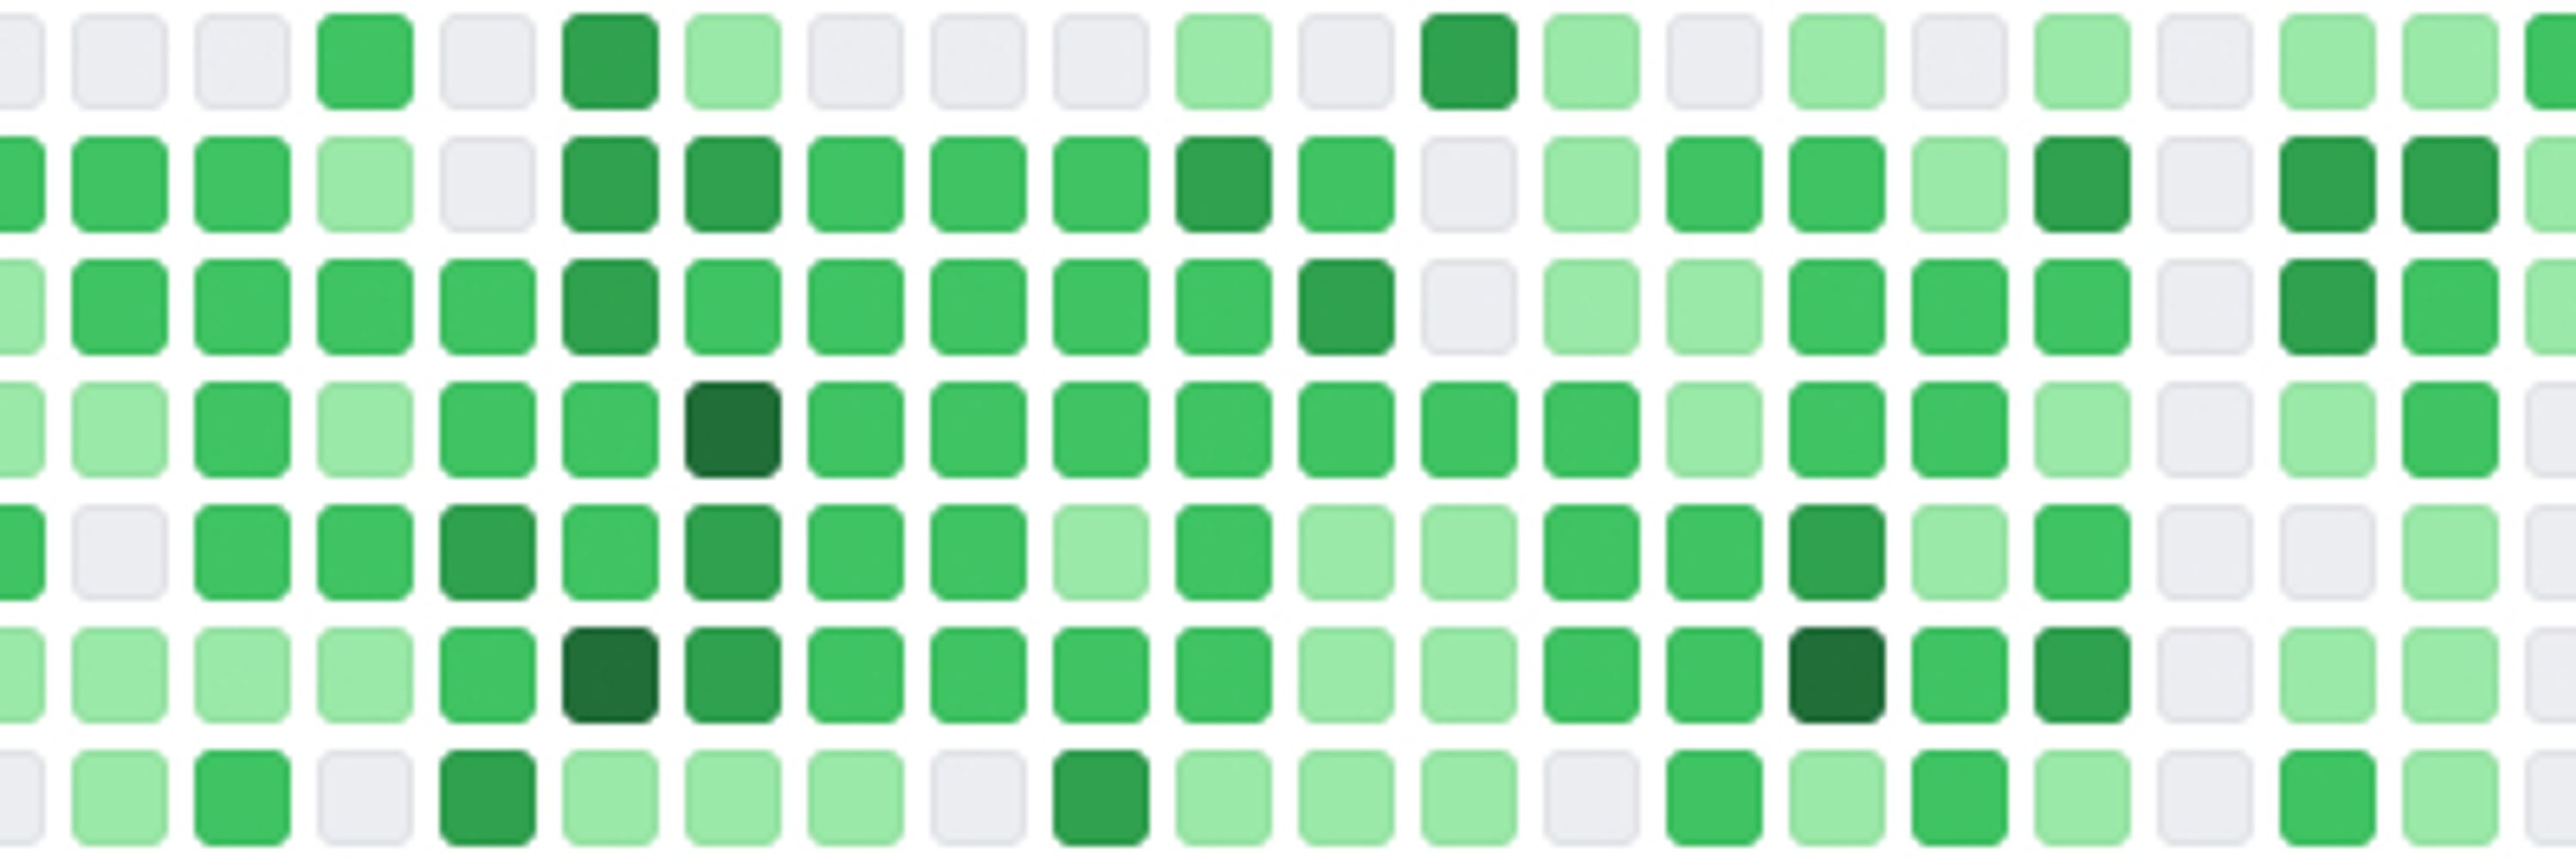
You can now easily add captions (and customize them) to the calendar heatmaps.
Now, I think it's time for me to spend more time finding better examples.
Learn more about dayplot: github.com/y-sunflower/...

You can now easily add captions (and customize them) to the calendar heatmaps.
Now, I think it's time for me to spend more time finding better examples.
Learn more about dayplot: github.com/y-sunflower/...
These themes (try to) be more color-blind friendly, as requested by some users.
If you have any ideas for themes, please don't hesitate to reach out!
Browse all themes: y-sunflower.github.io/morethemes/

These themes (try to) be more color-blind friendly, as requested by some users.
If you have any ideas for themes, please don't hesitate to reach out!
Browse all themes: y-sunflower.github.io/morethemes/
So I decided to write a little blog post about the upsides and downsides. It focuses mainly on: money, workload and working conditions.
barbierjoseph.com/blog/lessons...
So I decided to write a little blog post about the upsides and downsides. It focuses mainly on: money, workload and working conditions.
barbierjoseph.com/blog/lessons...
"plotjs" converts any existing matplotlib charts to an interactive, web-based version of them, with quite a lot of customization options.
Try it out here: github.com/y-sunflower/...
More examples: y-sunflower.github.io/plotjs/
"plotjs" converts any existing matplotlib charts to an interactive, web-based version of them, with quite a lot of customization options.
Try it out here: github.com/y-sunflower/...
More examples: y-sunflower.github.io/plotjs/
There are a bazillion things to do before it's something robust and stable, but I'm confident it will go somewhere.
Online demo: y-sunflower.github.io/plotjs/
There are a bazillion things to do before it's something robust and stable, but I'm confident it will go somewhere.
Online demo: y-sunflower.github.io/plotjs/
• Highlight the overall trend rather than precise values
• Use a scale-free format
• Keep the design minimalist
Code: github.com/JosephBARBIERDARNAL/tidytuesday/blob/main/src/2025/2025-07-01/main.py

• Highlight the overall trend rather than precise values
• Use a scale-free format
• Keep the design minimalist
Code: github.com/JosephBARBIERDARNAL/tidytuesday/blob/main/src/2025/2025-07-01/main.py
- A create_cmap() function to easily create a colormap object
- A show_cmap() function to preview the colors
- Improved documentation
- Minor bug fixes and internal code cleanup
More info on the project repository: github.com/JosephBARBIERDARNAL/pypalettes

- A create_cmap() function to easily create a colormap object
- A show_cmap() function to preview the colors
- Improved documentation
- Minor bug fixes and internal code cleanup
More info on the project repository: github.com/JosephBARBIERDARNAL/pypalettes
I literally spent days with @yan-holtz.bsky.social to end up with a simple static image, but that's how dataviz is sometimes.
If you want to learn how to make this type of visualisation, take a look at matplotlib-journey.com

I literally spent days with @yan-holtz.bsky.social to end up with a simple static image, but that's how dataviz is sometimes.
If you want to learn how to make this type of visualisation, take a look at matplotlib-journey.com
Even other well-known tools like Altair and Plotly haven’t reached Matplotlib’s level of adoption—though they do have their own unique features that Matplotlib doesn’t offer.
Code: github.com/JosephBARBIERDARNAL/anim-manim/blob/main/scene.py
Even other well-known tools like Altair and Plotly haven’t reached Matplotlib’s level of adoption—though they do have their own unique features that Matplotlib doesn’t offer.
Code: github.com/JosephBARBIERDARNAL/anim-manim/blob/main/scene.py
By the way, I'm really curious to hear about YOUR dataviz journey!
made with the @matplotlib.bsky.social plt.xkcd() tool, which is quite amusing!

By the way, I'm really curious to hear about YOUR dataviz journey!
made with the @matplotlib.bsky.social plt.xkcd() tool, which is quite amusing!
This is ~100 lines of code, using numpy+matplotlib
If you want to learn how to create anything with Matplotlib, the first step is to check out our new project with @yan-holtz.bsky.social: matplotlib-journey.com
This is ~100 lines of code, using numpy+matplotlib
If you want to learn how to create anything with Matplotlib, the first step is to check out our new project with @yan-holtz.bsky.social: matplotlib-journey.com
So I ended up creating gifing—a minimalist yet customizable GIF maker for Python.
Right now, it’s a simple, foundational version, but I have some cool feature ideas!
repo: github.com/JosephBARBIERDARNAL/gifing
So I ended up creating gifing—a minimalist yet customizable GIF maker for Python.
Right now, it’s a simple, foundational version, but I have some cool feature ideas!
repo: github.com/JosephBARBIERDARNAL/gifing

