


Joel Ferguson
@joelferguson.bsky.social
Assistant Professor @ Nelson Institute for Environmental Studies, UW Madison
Remote Sensing + Machine Learning for Ag/Dev econ questions
joelferg.github.io
Remote Sensing + Machine Learning for Ag/Dev econ questions
joelferg.github.io
I really like that we combined remote sensing and primary data collection in an interesting way in this project: RS showed us an issue and where it occurs, and we surveyed those affected about the causes. I’m hoping to do more at that intersection going forward
September 4, 2025 at 5:47 PM
I really like that we combined remote sensing and primary data collection in an interesting way in this project: RS showed us an issue and where it occurs, and we surveyed those affected about the causes. I’m hoping to do more at that intersection going forward
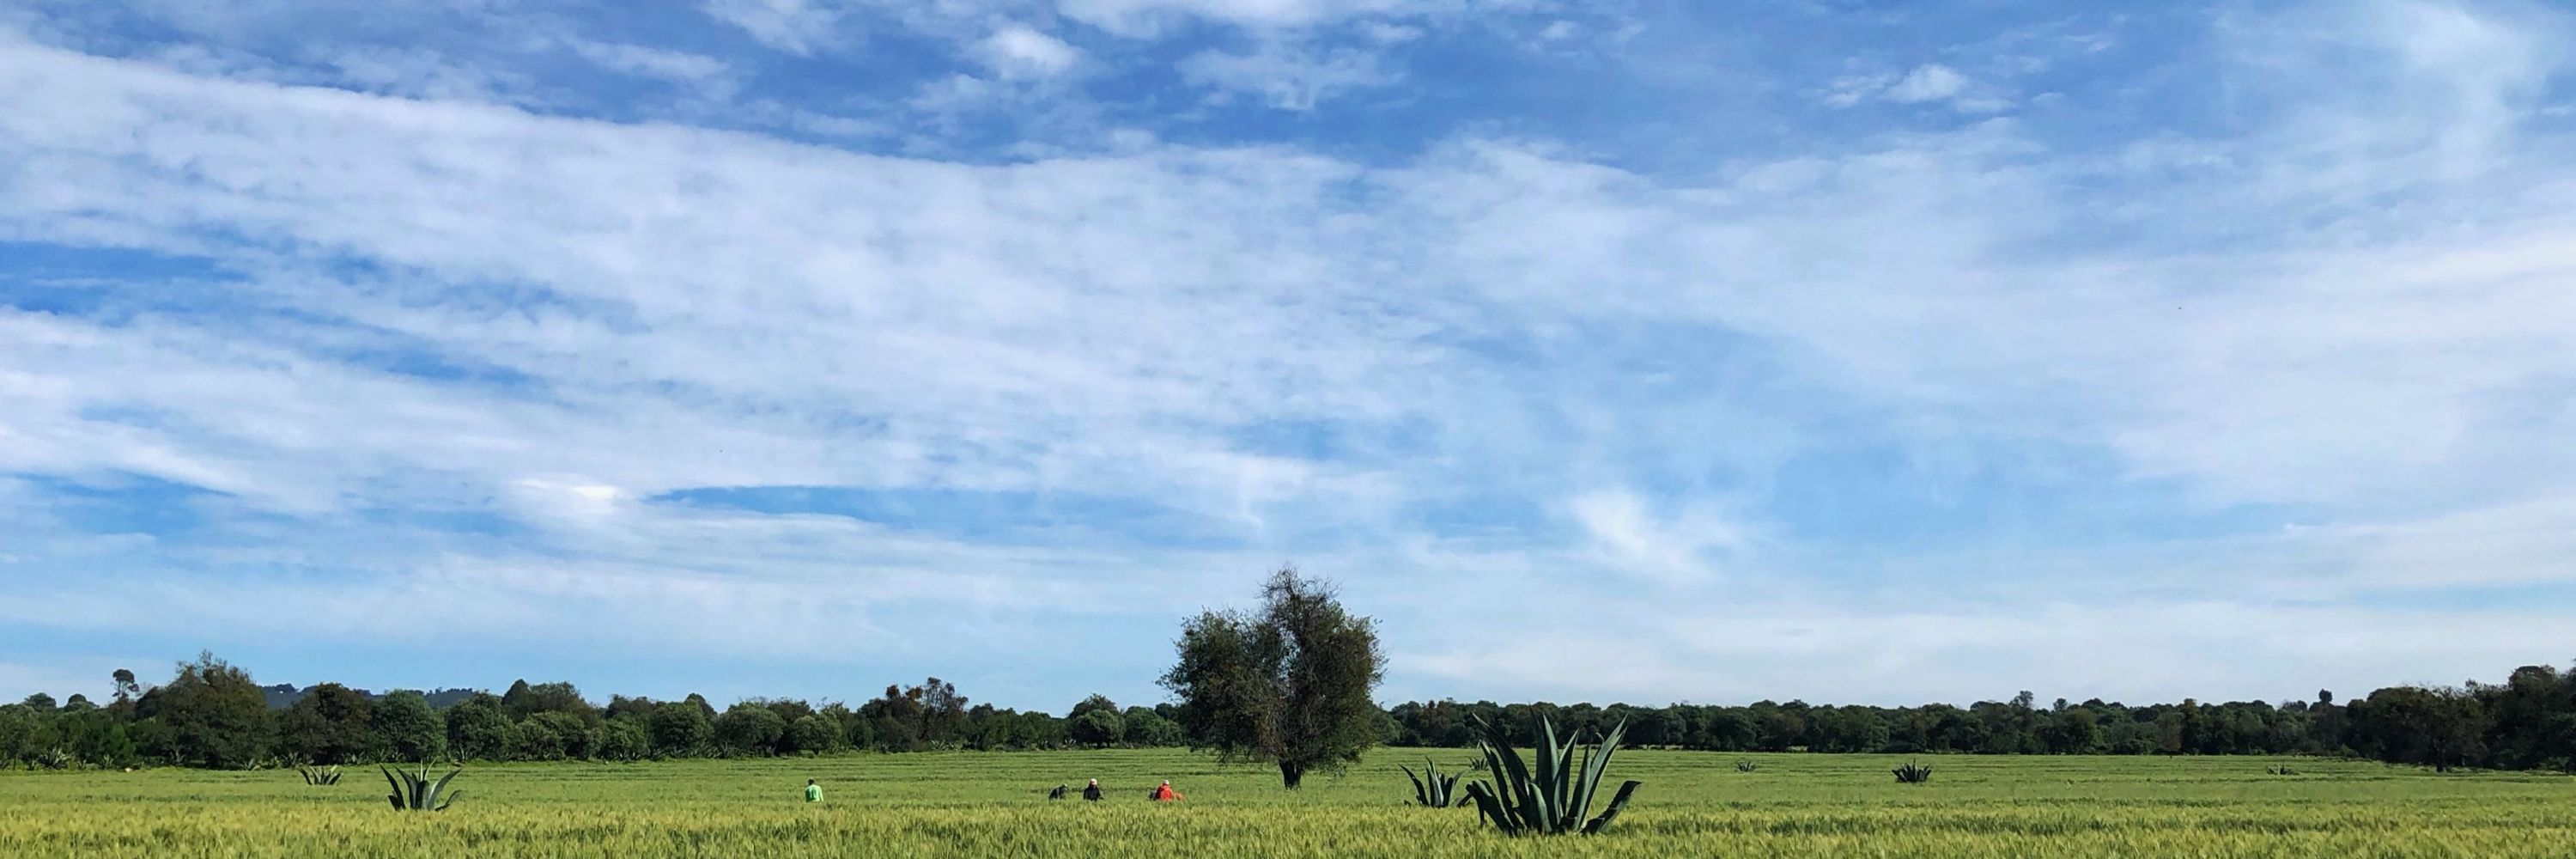
Next, we survey owners of land that hasn’t been cultivated in recent years to better understand what drives disuse. We find that, despite all of these lands being serviced by an irrigation project, farmers point to difficulty accessing water as one of the main drivers of disuse!
September 4, 2025 at 5:47 PM
Next, we survey owners of land that hasn’t been cultivated in recent years to better understand what drives disuse. We find that, despite all of these lands being serviced by an irrigation project, farmers point to difficulty accessing water as one of the main drivers of disuse!
First, we use over 3000 Landsat images of the SRV from 1985-2019 to classify land as cultivated or not at the 30m pixel level. This lets us answer questions like “How much does project completion increase cultivation rate?” and “What share of projects cultivate less than 1/3 of their area?”

September 4, 2025 at 5:47 PM
First, we use over 3000 Landsat images of the SRV from 1985-2019 to classify land as cultivated or not at the 30m pixel level. This lets us answer questions like “How much does project completion increase cultivation rate?” and “What share of projects cultivate less than 1/3 of their area?”
We explore how large-scale irrigation infrastructure, which has expanded in the Senegal River Valley (SRV) to service over 100k ha, has altered the amount of land cultivated and patterns around cultivation and disuse. We combine administrative data on irrigation projects with two data sources.
September 4, 2025 at 5:47 PM
We explore how large-scale irrigation infrastructure, which has expanded in the Senegal River Valley (SRV) to service over 100k ha, has altered the amount of land cultivated and patterns around cultivation and disuse. We combine administrative data on irrigation projects with two data sources.
www.nber.org/papers/w24645
Light on math (I don’t think there’s any), heavy on economic intuition, covers a lot of ground
Light on math (I don’t think there’s any), heavy on economic intuition, covers a lot of ground

The Critical Role of Markets in Climate Change Adaptation
Founded in 1920, the NBER is a private, non-profit, non-partisan organization dedicated to conducting economic research and to disseminating research findings among academics, public policy makers, an...
www.nber.org
October 22, 2024 at 5:34 AM
www.nber.org/papers/w24645
Light on math (I don’t think there’s any), heavy on economic intuition, covers a lot of ground
Light on math (I don’t think there’s any), heavy on economic intuition, covers a lot of ground
Say T=3 and D in {0,lo,hi}. My idea is in new DiD stuff with D in {0,1} everything is estimated based on cohorts - eg Di=(0,1,1), Dj=(0,0,1) - then averaging somehow
In this setting there’s a natural analogue of trajectories, eg Di=(0,lo,lo), Dj=(0,lo,hi). Seems like a similar logic could apply
In this setting there’s a natural analogue of trajectories, eg Di=(0,lo,lo), Dj=(0,lo,hi). Seems like a similar logic could apply
September 22, 2024 at 5:46 PM
Say T=3 and D in {0,lo,hi}. My idea is in new DiD stuff with D in {0,1} everything is estimated based on cohorts - eg Di=(0,1,1), Dj=(0,0,1) - then averaging somehow
In this setting there’s a natural analogue of trajectories, eg Di=(0,lo,lo), Dj=(0,lo,hi). Seems like a similar logic could apply
In this setting there’s a natural analogue of trajectories, eg Di=(0,lo,lo), Dj=(0,lo,hi). Seems like a similar logic could apply
Thanks for pointing me to that paper, definitely interesting! I don’t think it captures what I was thinking though. I also thought about it more and I think you would need to restrict HTEs within cohorts to make what I said in my 2nd response true
September 22, 2024 at 5:40 PM
Thanks for pointing me to that paper, definitely interesting! I don’t think it captures what I was thinking though. I also thought about it more and I think you would need to restrict HTEs within cohorts to make what I said in my 2nd response true
Oops, just realized that’s just the link to the search, but I think it should be the first result there
September 22, 2024 at 5:25 PM
Oops, just realized that’s just the link to the search, but I think it should be the first result there
I’m not familiar with the Xu paper, are you referring to this one?
scholar.google.com/scholar?hl=e...
If so, I’ll take a look and get back to you
scholar.google.com/scholar?hl=e...
If so, I’ll take a look and get back to you
Google Scholar
scholar.google.com
September 22, 2024 at 5:23 PM
I’m not familiar with the Xu paper, are you referring to this one?
scholar.google.com/scholar?hl=e...
If so, I’ll take a look and get back to you
scholar.google.com/scholar?hl=e...
If so, I’ll take a look and get back to you
There are potentially ways to leverage additional comparisons in this setting to get at effects of changes in treatment intensity. Eg two units treated with low intensity at the same time can be compared when one of them gets increased intensity later
Just some quick thoughts based on new DiD logic
Just some quick thoughts based on new DiD logic
September 22, 2024 at 5:11 PM
There are potentially ways to leverage additional comparisons in this setting to get at effects of changes in treatment intensity. Eg two units treated with low intensity at the same time can be compared when one of them gets increased intensity later
Just some quick thoughts based on new DiD logic
Just some quick thoughts based on new DiD logic