


Jen Richmond
@jenrichmondphd.bsky.social
ex-academic, co-founder RLadiesSydney, developer #RYouWithMe, sharer of #rstats learning https://jenrichmond.github.io/
Day 4: my data #30DayMapChallenge
Today I learned that #rstats 📦 `tidygeocoder` is super useful for pulling lat/long coordinates and that plotting a world map that centres the pacific is quite annoying. Shout out to @freerangestats.info for useful blog posts.
jenrichmond.github.io/maps/2025-11...
Today I learned that #rstats 📦 `tidygeocoder` is super useful for pulling lat/long coordinates and that plotting a world map that centres the pacific is quite annoying. Shout out to @freerangestats.info for useful blog posts.
jenrichmond.github.io/maps/2025-11...

November 5, 2025 at 2:30 AM
Day 4: my data #30DayMapChallenge
Today I learned that #rstats 📦 `tidygeocoder` is super useful for pulling lat/long coordinates and that plotting a world map that centres the pacific is quite annoying. Shout out to @freerangestats.info for useful blog posts.
jenrichmond.github.io/maps/2025-11...
Today I learned that #rstats 📦 `tidygeocoder` is super useful for pulling lat/long coordinates and that plotting a world map that centres the pacific is quite annoying. Shout out to @freerangestats.info for useful blog posts.
jenrichmond.github.io/maps/2025-11...
Day 3 #30DayMapChallenge polygons
Today I wanted to work out how to plot regional population on a map of NZ.
Turns out the `spData` package has nz data (and other interesting spatial data that might be useful to beginner map makers).
#rstats
jenrichmond.github.io/maps/2025-11...
Today I wanted to work out how to plot regional population on a map of NZ.
Turns out the `spData` package has nz data (and other interesting spatial data that might be useful to beginner map makers).
#rstats
jenrichmond.github.io/maps/2025-11...

November 4, 2025 at 9:37 PM
Day 3 #30DayMapChallenge polygons
Today I wanted to work out how to plot regional population on a map of NZ.
Turns out the `spData` package has nz data (and other interesting spatial data that might be useful to beginner map makers).
#rstats
jenrichmond.github.io/maps/2025-11...
Today I wanted to work out how to plot regional population on a map of NZ.
Turns out the `spData` package has nz data (and other interesting spatial data that might be useful to beginner map makers).
#rstats
jenrichmond.github.io/maps/2025-11...
Day 2: Lines #30DayMapChallenge
Sticking with walks of NZ, this time plotting the Te Araroa Trail, a 3000km hike that goes from the top of the North Island to the bottom of the South Island. #rstats
jenrichmond.github.io/maps/2025-11...
Sticking with walks of NZ, this time plotting the Te Araroa Trail, a 3000km hike that goes from the top of the North Island to the bottom of the South Island. #rstats
jenrichmond.github.io/maps/2025-11...

November 4, 2025 at 3:41 AM
Day 2: Lines #30DayMapChallenge
Sticking with walks of NZ, this time plotting the Te Araroa Trail, a 3000km hike that goes from the top of the North Island to the bottom of the South Island. #rstats
jenrichmond.github.io/maps/2025-11...
Sticking with walks of NZ, this time plotting the Te Araroa Trail, a 3000km hike that goes from the top of the North Island to the bottom of the South Island. #rstats
jenrichmond.github.io/maps/2025-11...
I am supposed to be walking the Routeburn Track next week (if the snow melts and the Harris Saddle opens) so today's map is about NZ Great Walks. #30DayMapChallenge #rstats
Code available here jenrichmond.github.io/maps/2025-11...
Code available here jenrichmond.github.io/maps/2025-11...

November 3, 2025 at 3:33 AM
I am supposed to be walking the Routeburn Track next week (if the snow melts and the Harris Saddle opens) so today's map is about NZ Great Walks. #30DayMapChallenge #rstats
Code available here jenrichmond.github.io/maps/2025-11...
Code available here jenrichmond.github.io/maps/2025-11...
Ooooo this data is likely interesting to #rstats peeps, but I wonder how complete it is.
Canceled orders in June-July are huge, but why are the orders received so low (and flat) in the first part of the year?
Did the FOIA request only ask about canceled orders @kevinuhrm.bsky.social ?
Canceled orders in June-July are huge, but why are the orders received so low (and flat) in the first part of the year?
Did the FOIA request only ask about canceled orders @kevinuhrm.bsky.social ?

October 17, 2025 at 1:00 AM
Ooooo this data is likely interesting to #rstats peeps, but I wonder how complete it is.
Canceled orders in June-July are huge, but why are the orders received so low (and flat) in the first part of the year?
Did the FOIA request only ask about canceled orders @kevinuhrm.bsky.social ?
Canceled orders in June-July are huge, but why are the orders received so low (and flat) in the first part of the year?
Did the FOIA request only ask about canceled orders @kevinuhrm.bsky.social ?
The Henley Passport Index data is interesting. I was curious about the relative rankings of the United States and Singapore and found that you get a bit of a different story if you plot ranking vs. visa free countries. #TidyTuesday #rstats
code available here: jenrichmond.github.io/tidytuesday/...
code available here: jenrichmond.github.io/tidytuesday/...


September 12, 2025 at 3:01 AM
The Henley Passport Index data is interesting. I was curious about the relative rankings of the United States and Singapore and found that you get a bit of a different story if you plot ranking vs. visa free countries. #TidyTuesday #rstats
code available here: jenrichmond.github.io/tidytuesday/...
code available here: jenrichmond.github.io/tidytuesday/...

August 29, 2025 at 9:06 PM
If you aren't a fan of theme_grey (why is that the default BTW??), theme_bw might be a better choice. #rstats
thanks for the tips @darakhshann.bsky.social @bharrap.bsky.social
thanks for the tips @darakhshann.bsky.social @bharrap.bsky.social

August 20, 2025 at 6:59 AM
If you aren't a fan of theme_grey (why is that the default BTW??), theme_bw might be a better choice. #rstats
thanks for the tips @darakhshann.bsky.social @bharrap.bsky.social
thanks for the tips @darakhshann.bsky.social @bharrap.bsky.social
Putting even plots out into the world via #TidyTuesday is a great way to learn new #rstats things!
Did you know that theme_minimal() actually has a transparent background? Me neither!! Explains why your ggsave export looks weird, like this...
Did you know that theme_minimal() actually has a transparent background? Me neither!! Explains why your ggsave export looks weird, like this...

August 20, 2025 at 6:59 AM
Putting even plots out into the world via #TidyTuesday is a great way to learn new #rstats things!
Did you know that theme_minimal() actually has a transparent background? Me neither!! Explains why your ggsave export looks weird, like this...
Did you know that theme_minimal() actually has a transparent background? Me neither!! Explains why your ggsave export looks weird, like this...
Mapping Scottish Munros for #TidyTuesday Week 33.
thanks for curating @nrennie.bsky.social !
Interactive plot and code available here...
jenrichmond.github.io/tidytuesday/...
thanks for curating @nrennie.bsky.social !
Interactive plot and code available here...
jenrichmond.github.io/tidytuesday/...

August 19, 2025 at 8:56 AM
Mapping Scottish Munros for #TidyTuesday Week 33.
thanks for curating @nrennie.bsky.social !
Interactive plot and code available here...
jenrichmond.github.io/tidytuesday/...
thanks for curating @nrennie.bsky.social !
Interactive plot and code available here...
jenrichmond.github.io/tidytuesday/...
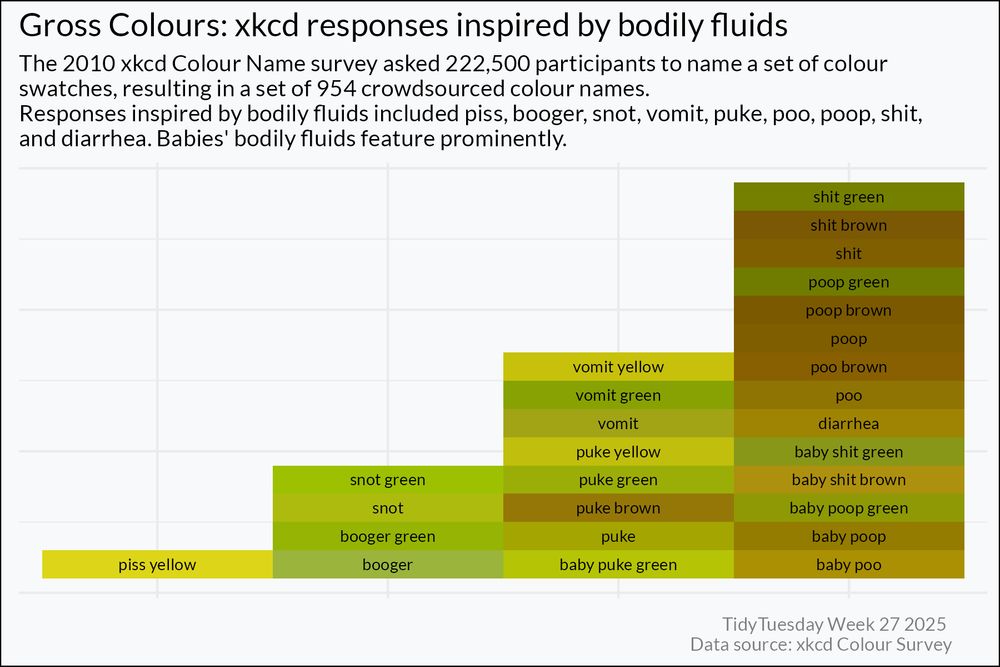
#TidyTuesday this week is SO FUN! Channelling my friend @fontikar.bsky.social and making something very silly... gross colours. Which colours reference bodily fluids?
Also... babies are gross 😂
Read about my #rstats process jenrichmond.github.io/tidytuesday/...
Also... babies are gross 😂
Read about my #rstats process jenrichmond.github.io/tidytuesday/...
July 8, 2025 at 8:19 AM
#TidyTuesday this week is SO FUN! Channelling my friend @fontikar.bsky.social and making something very silly... gross colours. Which colours reference bodily fluids?
Also... babies are gross 😂
Read about my #rstats process jenrichmond.github.io/tidytuesday/...
Also... babies are gross 😂
Read about my #rstats process jenrichmond.github.io/tidytuesday/...
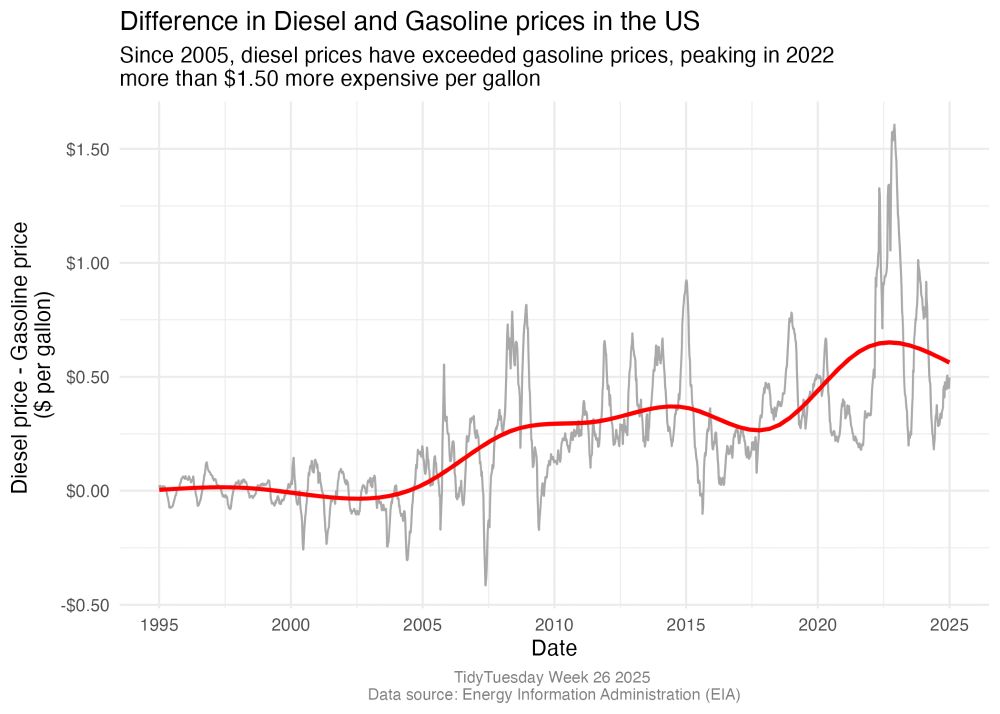
Quick #TidyTuesday plot this week. Diesel has become more expensive than gasoline over time. #rstats
jenrichmond.github.io/tidytuesday/...
jenrichmond.github.io/tidytuesday/...
July 2, 2025 at 3:45 AM
Quick #TidyTuesday plot this week. Diesel has become more expensive than gasoline over time. #rstats
jenrichmond.github.io/tidytuesday/...
jenrichmond.github.io/tidytuesday/...
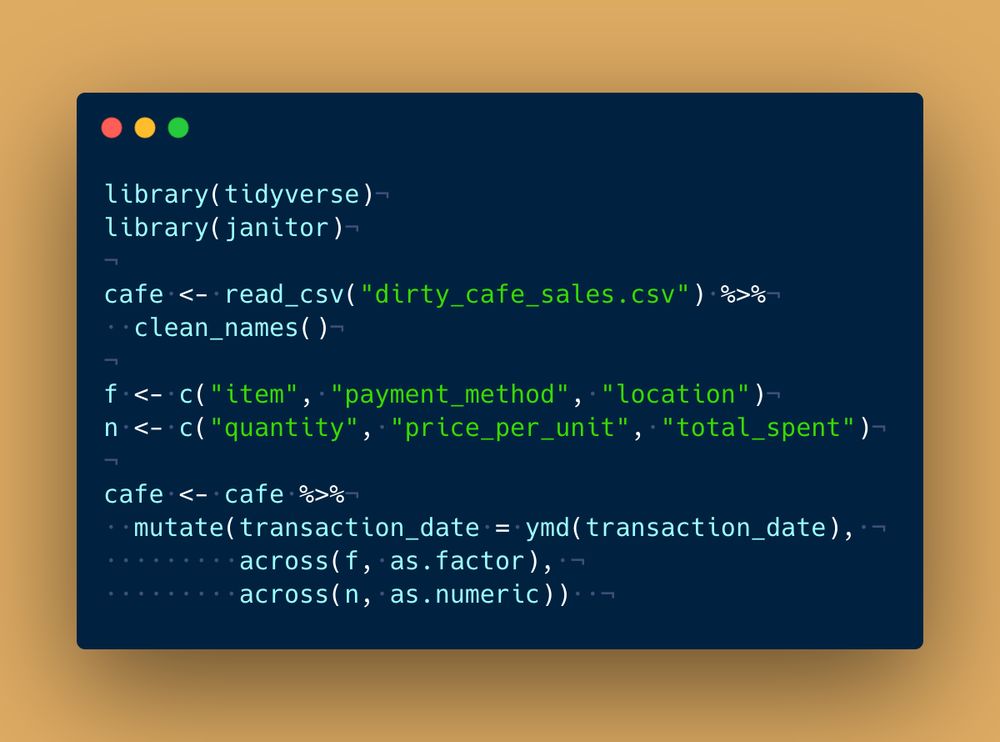
Data cleaning is time consuming but dealing with data types shouldn’t be.
In this quick demo, I show you how to use mutate and across from the #rstats `dplyr` package to change the format of several columns fast.
youtu.be/1H1w4KhTfn8
In this quick demo, I show you how to use mutate and across from the #rstats `dplyr` package to change the format of several columns fast.
youtu.be/1H1w4KhTfn8
June 29, 2025 at 7:57 PM
Data cleaning is time consuming but dealing with data types shouldn’t be.
In this quick demo, I show you how to use mutate and across from the #rstats `dplyr` package to change the format of several columns fast.
youtu.be/1H1w4KhTfn8
In this quick demo, I show you how to use mutate and across from the #rstats `dplyr` package to change the format of several columns fast.
youtu.be/1H1w4KhTfn8
I made a shiny #rstats thing!!
This week for #TidyTuesday my boyfriend Claude and I made an interactive Shiny dashboard.
Do I know Shiny? No…
Can I do Shiny? Sure… with Claude’s help of course.
Deployed via Posit Cloud Connect, feedback welcome!
www.tinyurl.com/myfirstshinyapp
This week for #TidyTuesday my boyfriend Claude and I made an interactive Shiny dashboard.
Do I know Shiny? No…
Can I do Shiny? Sure… with Claude’s help of course.
Deployed via Posit Cloud Connect, feedback welcome!
www.tinyurl.com/myfirstshinyapp

June 24, 2025 at 10:06 PM
I made a shiny #rstats thing!!
This week for #TidyTuesday my boyfriend Claude and I made an interactive Shiny dashboard.
Do I know Shiny? No…
Can I do Shiny? Sure… with Claude’s help of course.
Deployed via Posit Cloud Connect, feedback welcome!
www.tinyurl.com/myfirstshinyapp
This week for #TidyTuesday my boyfriend Claude and I made an interactive Shiny dashboard.
Do I know Shiny? No…
Can I do Shiny? Sure… with Claude’s help of course.
Deployed via Posit Cloud Connect, feedback welcome!
www.tinyurl.com/myfirstshinyapp
If you know of remote opportunities (or just want to chat about academic career pivots!), I'd love to connect. There is a link to my website and recent projects below.
Some mountains for your Monday!
#OpenToWork #rstats #TechLeadership #CareerTransition #R-Ladies
8/9
Some mountains for your Monday!
#OpenToWork #rstats #TechLeadership #CareerTransition #R-Ladies
8/9
June 23, 2025 at 1:51 AM
If you know of remote opportunities (or just want to chat about academic career pivots!), I'd love to connect. There is a link to my website and recent projects below.
Some mountains for your Monday!
#OpenToWork #rstats #TechLeadership #CareerTransition #R-Ladies
8/9
Some mountains for your Monday!
#OpenToWork #rstats #TechLeadership #CareerTransition #R-Ladies
8/9
Data cleaning is time consuming but replacing unexpected values with NA shouldn’t be.
The `replace_with_na()` function from the `naniar` #rstats package (credit: Nick Tierney) makes it easy to replace more than one value in more than one column in a single line of code.
demo: youtu.be/99L5j45Hkec
The `replace_with_na()` function from the `naniar` #rstats package (credit: Nick Tierney) makes it easy to replace more than one value in more than one column in a single line of code.
demo: youtu.be/99L5j45Hkec

June 22, 2025 at 9:06 PM
Data cleaning is time consuming but replacing unexpected values with NA shouldn’t be.
The `replace_with_na()` function from the `naniar` #rstats package (credit: Nick Tierney) makes it easy to replace more than one value in more than one column in a single line of code.
demo: youtu.be/99L5j45Hkec
The `replace_with_na()` function from the `naniar` #rstats package (credit: Nick Tierney) makes it easy to replace more than one value in more than one column in a single line of code.
demo: youtu.be/99L5j45Hkec
Most APIs are associated with more than one category. This heat map illustrates which categories tend to go together.
There are 275 APIs that are associated with media & analytics.
#TidyTuesday #rstats
read about my heatmap plotting process here ...
jenrichmond.github.io/posts/2025-0...
There are 275 APIs that are associated with media & analytics.
#TidyTuesday #rstats
read about my heatmap plotting process here ...
jenrichmond.github.io/posts/2025-0...

June 19, 2025 at 11:11 PM
Most APIs are associated with more than one category. This heat map illustrates which categories tend to go together.
There are 275 APIs that are associated with media & analytics.
#TidyTuesday #rstats
read about my heatmap plotting process here ...
jenrichmond.github.io/posts/2025-0...
There are 275 APIs that are associated with media & analytics.
#TidyTuesday #rstats
read about my heatmap plotting process here ...
jenrichmond.github.io/posts/2025-0...
Lollipop plot of Supreme Court judge terms from the `historydata` R package for #TidyTuesday .
Winner of the longest term award goes to Stanley Reed, appointed in 1938 and serving for 42 years.
Read about my plotting process here jenrichmond.github.io/posts/2025-0...
Winner of the longest term award goes to Stanley Reed, appointed in 1938 and serving for 42 years.
Read about my plotting process here jenrichmond.github.io/posts/2025-0...

June 10, 2025 at 9:22 AM
Lollipop plot of Supreme Court judge terms from the `historydata` R package for #TidyTuesday .
Winner of the longest term award goes to Stanley Reed, appointed in 1938 and serving for 42 years.
Read about my plotting process here jenrichmond.github.io/posts/2025-0...
Winner of the longest term award goes to Stanley Reed, appointed in 1938 and serving for 42 years.
Read about my plotting process here jenrichmond.github.io/posts/2025-0...
The vast majority of books in the Gutenberg Project are in English.
I made this plot using the `treemapify` package. Treemap plots are useful when one category is overrepresented in your data.
#rstats #TidyTuesday
Checking out my plotting process jenrichmond.github.io/posts/2025-0...
I made this plot using the `treemapify` package. Treemap plots are useful when one category is overrepresented in your data.
#rstats #TidyTuesday
Checking out my plotting process jenrichmond.github.io/posts/2025-0...

June 4, 2025 at 12:26 AM
The vast majority of books in the Gutenberg Project are in English.
I made this plot using the `treemapify` package. Treemap plots are useful when one category is overrepresented in your data.
#rstats #TidyTuesday
Checking out my plotting process jenrichmond.github.io/posts/2025-0...
I made this plot using the `treemapify` package. Treemap plots are useful when one category is overrepresented in your data.
#rstats #TidyTuesday
Checking out my plotting process jenrichmond.github.io/posts/2025-0...
Ahhh how did I miss that there was developmental data about the dragons!! I was inspired by your plot and couldn't resist flipping it to put age on the x axis (lots of overlap in points which made it a bit difficult). Nice to see fellow Psych peeps getting into #TidyTuesday #rstats

May 28, 2025 at 4:44 AM
Ahhh how did I miss that there was developmental data about the dragons!! I was inspired by your plot and couldn't resist flipping it to put age on the x axis (lots of overlap in points which made it a bit difficult). Nice to see fellow Psych peeps getting into #TidyTuesday #rstats
You don't have to have a perfect #TidyTuesday story to make sharing worthwhile. It is enough to practice something that you want to get better at and to share what you learn along the way.
Today I learned some things about #rstats ggplot functions/themes.
jenrichmond.github.io/posts/2025-0...
Today I learned some things about #rstats ggplot functions/themes.
jenrichmond.github.io/posts/2025-0...


May 27, 2025 at 9:15 PM
You don't have to have a perfect #TidyTuesday story to make sharing worthwhile. It is enough to practice something that you want to get better at and to share what you learn along the way.
Today I learned some things about #rstats ggplot functions/themes.
jenrichmond.github.io/posts/2025-0...
Today I learned some things about #rstats ggplot functions/themes.
jenrichmond.github.io/posts/2025-0...
A bit of a head start on the #TidyTuesday data this week because I curated it!
Ocean beaches in the city’s east are usually safe to swim. Swim sites in the west, which are lagoons and rivers, are less frequently a safe place to swim.
My #rstats plot process jenrichmond.github.io/posts/2025-0...
Ocean beaches in the city’s east are usually safe to swim. Swim sites in the west, which are lagoons and rivers, are less frequently a safe place to swim.
My #rstats plot process jenrichmond.github.io/posts/2025-0...

May 20, 2025 at 7:33 PM
A bit of a head start on the #TidyTuesday data this week because I curated it!
Ocean beaches in the city’s east are usually safe to swim. Swim sites in the west, which are lagoons and rivers, are less frequently a safe place to swim.
My #rstats plot process jenrichmond.github.io/posts/2025-0...
Ocean beaches in the city’s east are usually safe to swim. Swim sites in the west, which are lagoons and rivers, are less frequently a safe place to swim.
My #rstats plot process jenrichmond.github.io/posts/2025-0...
The #TidyTuesday data this week is about seismic activity at Mt Vesuvius. This plot uses geom_tile to show that the volcano is releasing pressure either via many small events or fewer larger events.
Read about my #rstats plot process here...
jenrichmond.github.io/posts/2025-0...
Read about my #rstats plot process here...
jenrichmond.github.io/posts/2025-0...

May 13, 2025 at 9:51 PM
The #TidyTuesday data this week is about seismic activity at Mt Vesuvius. This plot uses geom_tile to show that the volcano is releasing pressure either via many small events or fewer larger events.
Read about my #rstats plot process here...
jenrichmond.github.io/posts/2025-0...
Read about my #rstats plot process here...
jenrichmond.github.io/posts/2025-0...
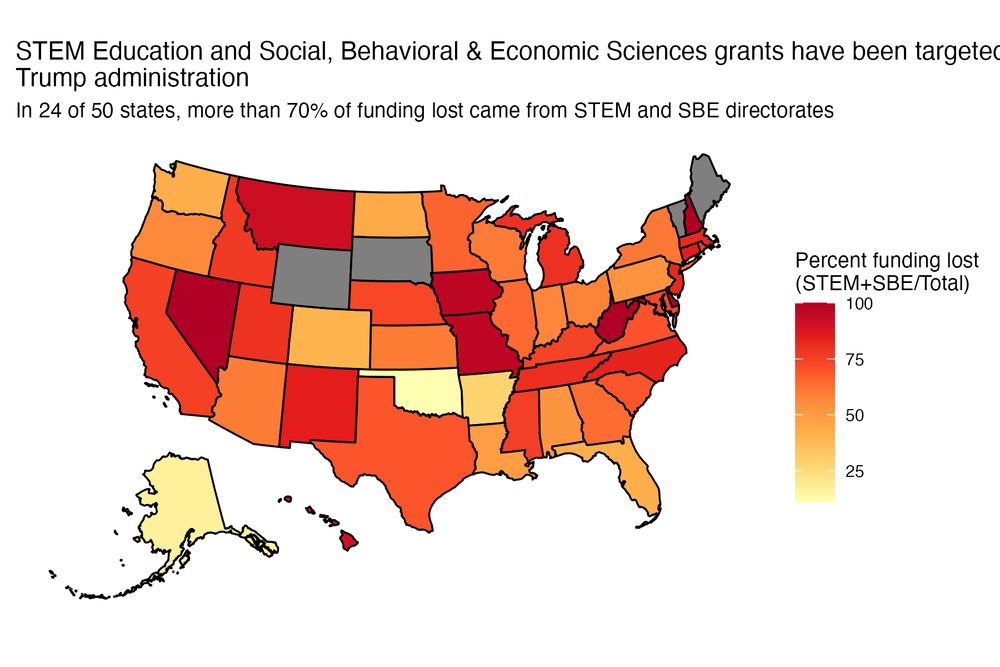
Rage coding this morning using #TidyTuesday NSF grant terminations data.
Research in STEM Education and Social, Behavioral, & Economic Science is clearly being targeted by the current administration.
I made a lot of depressing #rstats plots, check them out
jenrichmond.github.io/posts/2025-0...
Research in STEM Education and Social, Behavioral, & Economic Science is clearly being targeted by the current administration.
I made a lot of depressing #rstats plots, check them out
jenrichmond.github.io/posts/2025-0...
May 6, 2025 at 11:56 PM
Rage coding this morning using #TidyTuesday NSF grant terminations data.
Research in STEM Education and Social, Behavioral, & Economic Science is clearly being targeted by the current administration.
I made a lot of depressing #rstats plots, check them out
jenrichmond.github.io/posts/2025-0...
Research in STEM Education and Social, Behavioral, & Economic Science is clearly being targeted by the current administration.
I made a lot of depressing #rstats plots, check them out
jenrichmond.github.io/posts/2025-0...