


Dr John Clarke
@jclarkepaleo.bsky.social
Evolutionary biologist & paleontologist. Website: http://bit.ly/JTCsite Macroevolution, phylogenetic comparative methods, diversification, phenotypic evolution of 🐠🌿🦋 Postdoc @iDiv in Leipzig
These alternative drivers were assessed with a variety of approaches (A, B and C).

November 16, 2024 at 10:46 AM
These alternative drivers were assessed with a variety of approaches (A, B and C).
We also discovered a significant negative relationship (with STRAPP) between phenotypic rates and branch duration - a common pattern across the tree of life - the extent to which is now quantified in fishes.

November 16, 2024 at 10:39 AM
We also discovered a significant negative relationship (with STRAPP) between phenotypic rates and branch duration - a common pattern across the tree of life - the extent to which is now quantified in fishes.
We also tested if smaller fishes tended to have higher rates of body size evolution. We did not find this.
Instead, we found a positive relationship between absolute body size, and rates of body size evolution, in fishes.
Instead, we found a positive relationship between absolute body size, and rates of body size evolution, in fishes.

November 16, 2024 at 10:23 AM
We also tested if smaller fishes tended to have higher rates of body size evolution. We did not find this.
Instead, we found a positive relationship between absolute body size, and rates of body size evolution, in fishes.
Instead, we found a positive relationship between absolute body size, and rates of body size evolution, in fishes.
Inspired by @Liz_C_Miller's cool paper on speciation rates in marine settings, rivers and lakes, I then explored this for rates of body size evolution, and did also find elevated rates in lakes. This pattern is repeated across many orders of fishes.

November 16, 2024 at 10:07 AM
Inspired by @Liz_C_Miller's cool paper on speciation rates in marine settings, rivers and lakes, I then explored this for rates of body size evolution, and did also find elevated rates in lakes. This pattern is repeated across many orders of fishes.
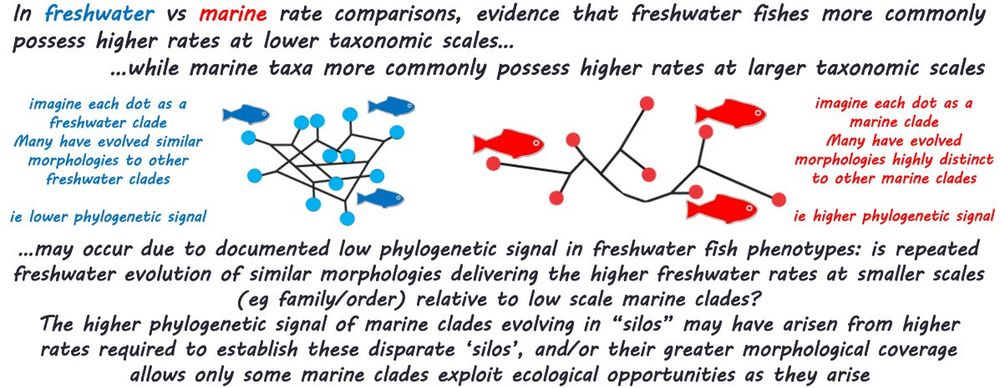
Although we did a trend for freshwater clades to have higher rates than marine relatives at lower scales, and the opposite at higher scales. And so some discussion was added on this much inspired by @sarahtfried's awesome work here...
November 16, 2024 at 9:49 AM
Although we did a trend for freshwater clades to have higher rates than marine relatives at lower scales, and the opposite at higher scales. And so some discussion was added on this much inspired by @sarahtfried's awesome work here...
And then, at multiple scales, finding little compelling evidence for compelling patterns, although freshwater-brackish habitats (green) performed well

November 16, 2024 at 9:41 AM
And then, at multiple scales, finding little compelling evidence for compelling patterns, although freshwater-brackish habitats (green) performed well
We first compared rates across 5 different salinity habitats for the whole dataset...

November 16, 2024 at 9:33 AM
We first compared rates across 5 different salinity habitats for the whole dataset...

🚨Our paper testing the impacts of salinity on phenotypic rates in nearly all ray-finned fishes recently arrived!🚨
Salinity is generally a weak predictor, but predictive potential for freshwater-brackish, lake living, and larger species.
Free PDF here: <a href="http://bit.ly/fishRates" class="hover:underline text-blue-600 dark:text-sky-400 no-card-link" target="_blank" rel="noopener" data-link="bsky">http://bit.ly/fishRates

November 16, 2024 at 8:54 AM
🚨Our paper testing the impacts of salinity on phenotypic rates in nearly all ray-finned fishes recently arrived!🚨
Salinity is generally a weak predictor, but predictive potential for freshwater-brackish, lake living, and larger species.
Free PDF here: <a href="http://bit.ly/fishRates" class="hover:underline text-blue-600 dark:text-sky-400 no-card-link" target="_blank" rel="noopener" data-link="bsky">http://bit.ly/fishRates
Salinity is generally a weak predictor, but predictive potential for freshwater-brackish, lake living, and larger species.
Free PDF here: <a href="http://bit.ly/fishRates" class="hover:underline text-blue-600 dark:text-sky-400 no-card-link" target="_blank" rel="noopener" data-link="bsky">http://bit.ly/fishRates
In the end, the model with the lowest overal AICc value was one of "model 6" models where all traits are interacting in their adaptive component
&
where correlations are occuring between their stochastic components.
&
where correlations are occuring between their stochastic components.

November 16, 2024 at 10:23 AM
In the end, the model with the lowest overal AICc value was one of "model 6" models where all traits are interacting in their adaptive component
&
where correlations are occuring between their stochastic components.
&
where correlations are occuring between their stochastic components.
Thanks to speed, one doesn't need to fit each model just once and "hope for the best".
To better explore the likelihood surface, you can run the analysis from many different starting points. For each unique model, 500 starting points were used.
That's 6000 models fit in total.
To better explore the likelihood surface, you can run the analysis from many different starting points. For each unique model, 500 starting points were used.
That's 6000 models fit in total.

November 16, 2024 at 10:15 AM
Thanks to speed, one doesn't need to fit each model just once and "hope for the best".
To better explore the likelihood surface, you can run the analysis from many different starting points. For each unique model, 500 starting points were used.
That's 6000 models fit in total.
To better explore the likelihood surface, you can run the analysis from many different starting points. For each unique model, 500 starting points were used.
That's 6000 models fit in total.
Alongside the A matrix (adaptive component), one must also set the stochastic / non-adaptive component.
This again is a matrix, and if it is diagonal, the stochastic component of the traits evolution is not correlated. To test correlated evolution, set to "upper triangular".
This again is a matrix, and if it is diagonal, the stochastic component of the traits evolution is not correlated. To test correlated evolution, set to "upper triangular".

November 16, 2024 at 10:07 AM
Alongside the A matrix (adaptive component), one must also set the stochastic / non-adaptive component.
This again is a matrix, and if it is diagonal, the stochastic component of the traits evolution is not correlated. To test correlated evolution, set to "upper triangular".
This again is a matrix, and if it is diagonal, the stochastic component of the traits evolution is not correlated. To test correlated evolution, set to "upper triangular".
We fit these models to a large plant dataset
You can still fit regimes while still exploring how traits interact - it may help you to reveal those interactions.
We had 9 regimes defined by Ellenberg values for nitrogen, a variable we would expect traits to vary with.
You can still fit regimes while still exploring how traits interact - it may help you to reveal those interactions.
We had 9 regimes defined by Ellenberg values for nitrogen, a variable we would expect traits to vary with.

November 16, 2024 at 9:49 AM
We fit these models to a large plant dataset
You can still fit regimes while still exploring how traits interact - it may help you to reveal those interactions.
We had 9 regimes defined by Ellenberg values for nitrogen, a variable we would expect traits to vary with.
You can still fit regimes while still exploring how traits interact - it may help you to reveal those interactions.
We had 9 regimes defined by Ellenberg values for nitrogen, a variable we would expect traits to vary with.
Here one can find a more text based explanation for each of the 6 models (each essentially defining different modules of traits).

November 16, 2024 at 9:33 AM
Here one can find a more text based explanation for each of the 6 models (each essentially defining different modules of traits).
Key with this update is that you are NOT restricted to only certain fixed setups for the A (i.e adaptation) matrix.
YOU can define highly customised models for trait interactions by editing ANY cell of the A matrix - see how we made these 6 models for how 4 plant traits interact
YOU can define highly customised models for trait interactions by editing ANY cell of the A matrix - see how we made these 6 models for how 4 plant traits interact

November 16, 2024 at 9:18 AM
Key with this update is that you are NOT restricted to only certain fixed setups for the A (i.e adaptation) matrix.
YOU can define highly customised models for trait interactions by editing ANY cell of the A matrix - see how we made these 6 models for how 4 plant traits interact
YOU can define highly customised models for trait interactions by editing ANY cell of the A matrix - see how we made these 6 models for how 4 plant traits interact
Key to creating models of how traits interact is to define the A matrix.
Figure 1 gives a 2 trait example
a diagonal A matrix is one where off-diagonal entries are 0 - this means NO interactions between traits.
When values are permitted in off diagonals, interactions occur.
Figure 1 gives a 2 trait example
a diagonal A matrix is one where off-diagonal entries are 0 - this means NO interactions between traits.
When values are permitted in off diagonals, interactions occur.

November 16, 2024 at 9:09 AM
Key to creating models of how traits interact is to define the A matrix.
Figure 1 gives a 2 trait example
a diagonal A matrix is one where off-diagonal entries are 0 - this means NO interactions between traits.
When values are permitted in off diagonals, interactions occur.
Figure 1 gives a 2 trait example
a diagonal A matrix is one where off-diagonal entries are 0 - this means NO interactions between traits.
When values are permitted in off diagonals, interactions occur.
Multivariate OU models can be tricky to communicate.
For those used to univariate OU models, this section of text in the supplement helps to explain some of the similarities and differences :)
For those used to univariate OU models, this section of text in the supplement helps to explain some of the similarities and differences :)

November 16, 2024 at 9:02 AM
Multivariate OU models can be tricky to communicate.
For those used to univariate OU models, this section of text in the supplement helps to explain some of the similarities and differences :)
For those used to univariate OU models, this section of text in the supplement helps to explain some of the similarities and differences :)
🚨Our paper on the major update to R package mvSLOUCH is out!🚨
Now w/ rapid speed for your large multivariate datasets + measurement error + missing data + crucially, the ability to specify precisely how sets of traits evolving by OU/BM interact, e.g. for modularity tests!
Now w/ rapid speed for your large multivariate datasets + measurement error + missing data + crucially, the ability to specify precisely how sets of traits evolving by OU/BM interact, e.g. for modularity tests!

November 16, 2024 at 8:54 AM
🚨Our paper on the major update to R package mvSLOUCH is out!🚨
Now w/ rapid speed for your large multivariate datasets + measurement error + missing data + crucially, the ability to specify precisely how sets of traits evolving by OU/BM interact, e.g. for modularity tests!
Now w/ rapid speed for your large multivariate datasets + measurement error + missing data + crucially, the ability to specify precisely how sets of traits evolving by OU/BM interact, e.g. for modularity tests!
Is anyone aware of some nice literature / resources summarising how the populations sizes of fishes vary across different habitats?
November 16, 2024 at 10:39 AM
Is anyone aware of some nice literature / resources summarising how the populations sizes of fishes vary across different habitats?
Relevant! More new evidence of environmental pollution driving fish tumors:
https://jhrlmc.com/index.php/home/article/view/177
https://jhrlmc.com/index.php/home/article/view/177

November 16, 2024 at 11:26 AM
Relevant! More new evidence of environmental pollution driving fish tumors:
https://jhrlmc.com/index.php/home/article/view/177
https://jhrlmc.com/index.php/home/article/view/177

I even saved 7/20 of the little brats...despite my supposed dino hating instincts to kill them all...

November 16, 2024 at 10:54 AM
I even saved 7/20 of the little brats...despite my supposed dino hating instincts to kill them all...
I enjoyed the limited time titanosaur exhibit at @NHM_London to cap my visit to @nhcooper123 earlier in the week. I highly recommend, ends Jan 14th!
Perfect for anyone missing Dippy :)
Perfect for anyone missing Dippy :)


November 16, 2024 at 10:46 AM
I enjoyed the limited time titanosaur exhibit at @NHM_London to cap my visit to @nhcooper123 earlier in the week. I highly recommend, ends Jan 14th!
Perfect for anyone missing Dippy :)
Perfect for anyone missing Dippy :)
Here are some additional details on the major findings...

December 21, 2023 at 9:53 PM
Here are some additional details on the major findings...
Some additional details on the findings:

November 16, 2024 at 11:19 AM
Some additional details on the findings: